
|
|||||
|
 | |
| |
| |
| |
| |
| |
|
Gene: PGLYRP2 |
Gene summary for PGLYRP2 |
| Gene information | Species | Human | Gene symbol | PGLYRP2 | Gene ID | 114770 |
| Gene name | peptidoglycan recognition protein 2 | |
| Gene Alias | HMFT0141 | |
| Cytomap | 19p13.12 | |
| Gene Type | protein-coding | GO ID | GO:0000270 | UniProtAcc | Q96PD5 |
Top |
Malignant transformation analysis |
| Identification of the aberrant gene expression in precancerous and cancerous lesions by comparing the gene expression of stem-like cells in diseased tissues with normal stem cells |
| Entrez ID | Symbol | Replicates | Species | Organ | Tissue | Adj P-value | Log2FC | Malignancy |
| 114770 | PGLYRP2 | HCC1_Meng | Human | Liver | HCC | 1.76e-12 | 2.73e-02 | 0.0246 |
| 114770 | PGLYRP2 | HCC2 | Human | Liver | HCC | 4.96e-19 | 2.69e+00 | 0.5341 |
| 114770 | PGLYRP2 | S028 | Human | Liver | HCC | 1.97e-06 | 3.46e-01 | 0.2503 |
| 114770 | PGLYRP2 | S029 | Human | Liver | HCC | 1.48e-10 | 5.94e-01 | 0.2581 |
| Page: 1 |
| Tissue | Expression Dynamics | Abbreviation |
| Liver | 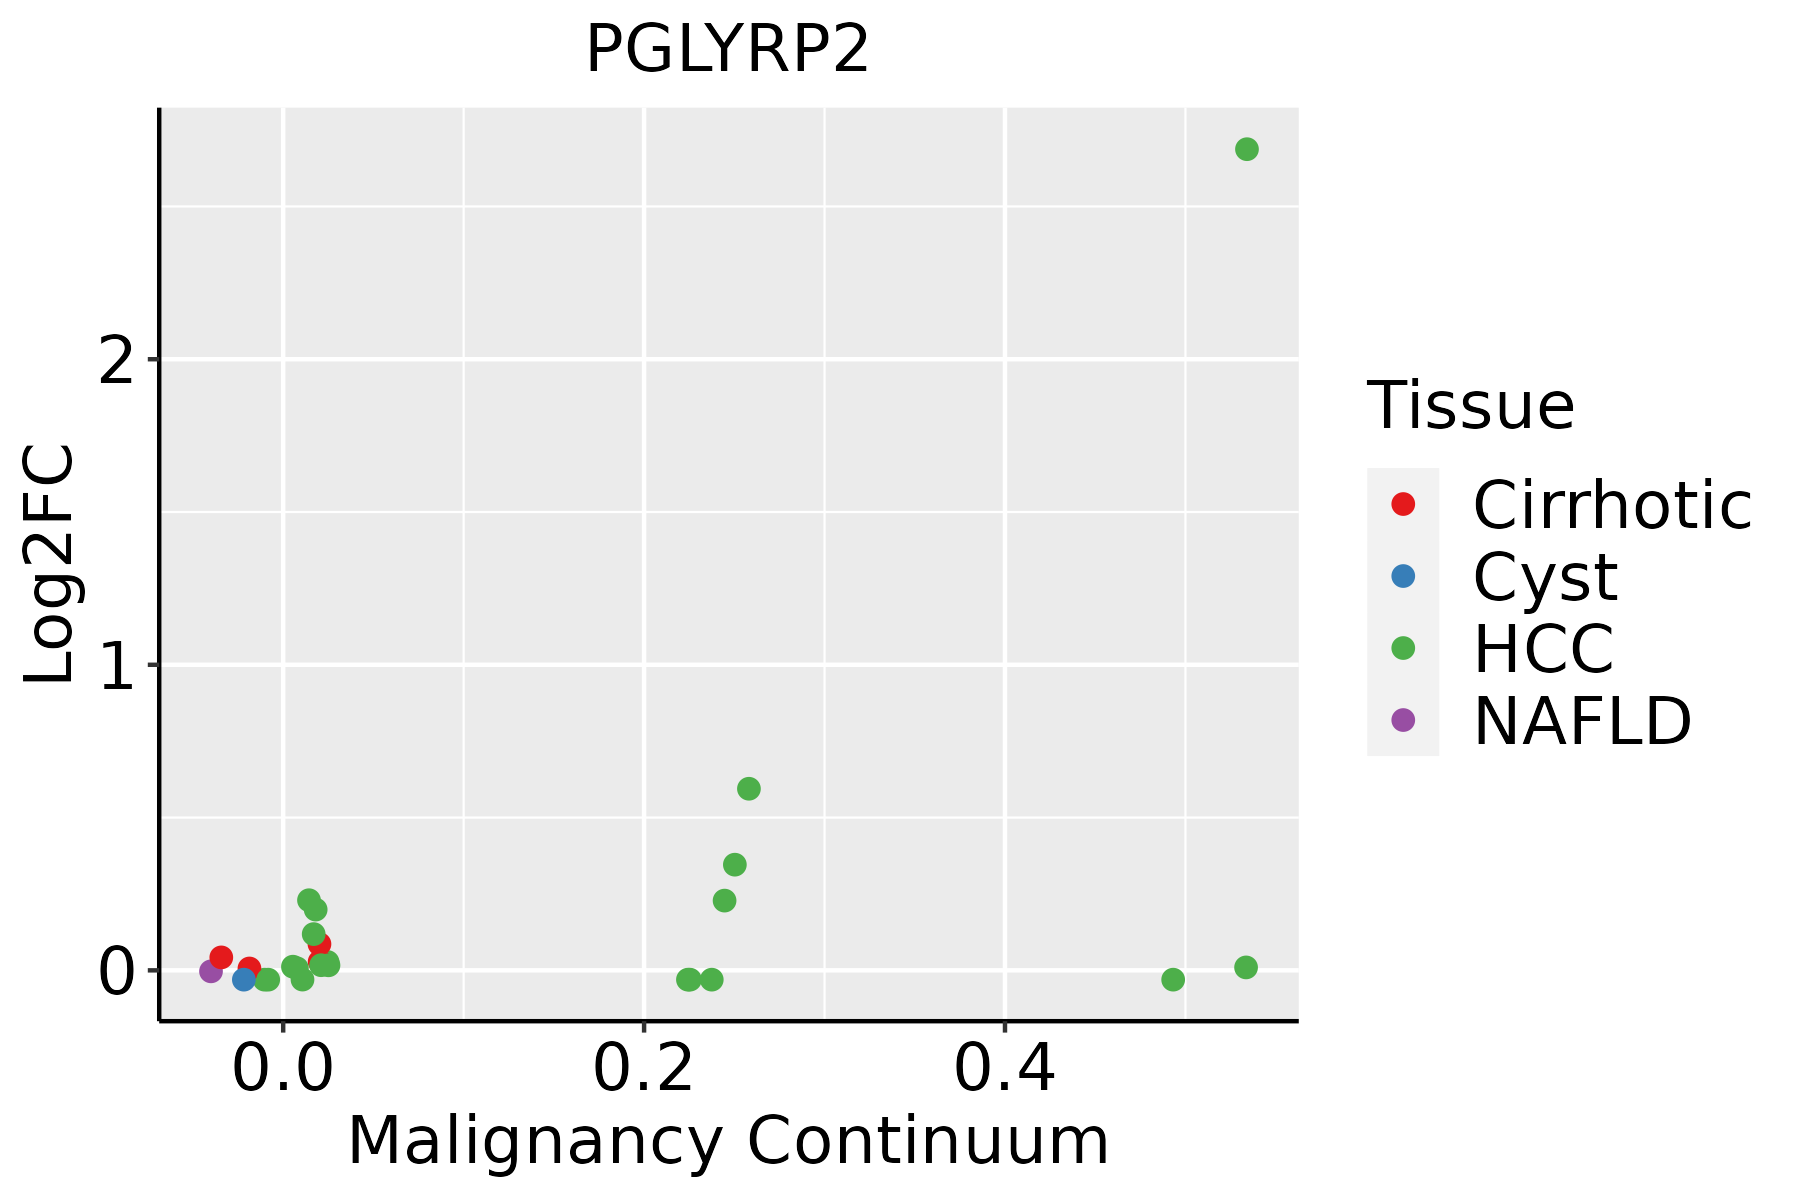 | HCC: Hepatocellular carcinoma |
| NAFLD: Non-alcoholic fatty liver disease |
| ∗log2FC in expression of this searched gene in stem-like cells from each diseased tissue sample relative to stem-like cells in normal samples in each tissue plotted against the malignancy continuum. Samples are colored based on if they are from different disease stage. |
Top |
Malignant transformation related pathway analysis |
| Find out the enriched GO biological processes and KEGG pathways involved in transition from healthy to precancer to cancer |
| Tissue | Disease Stage | Enriched GO biological Processes |
| Colorectum | AD |  |
| Colorectum | SER |  |
| Colorectum | MSS |  |
| Colorectum | MSI-H |  |
| Colorectum | FAP |  |
| ∗Top 15 enriched GO BP terms are showed in the bar plot of each disease state in each tissue. Each row represents a significant GO biological process which is colored according to the -log10(p.adjust). |
| Page: 1 2 3 4 5 6 7 8 9 |
| GO ID | Tissue | Disease Stage | Description | Gene Ratio | Bg Ratio | pvalue | p.adjust | Count |
| GO:004440322 | Liver | HCC | biological process involved in symbiotic interaction | 183/7958 | 290/18723 | 9.13e-13 | 4.59e-11 | 183 |
| GO:005170122 | Liver | HCC | biological process involved in interaction with host | 128/7958 | 203/18723 | 2.51e-09 | 6.91e-08 | 128 |
| GO:1901136 | Liver | HCC | carbohydrate derivative catabolic process | 98/7958 | 172/18723 | 8.71e-05 | 7.62e-04 | 98 |
| GO:0050777 | Liver | HCC | negative regulation of immune response | 101/7958 | 194/18723 | 4.40e-03 | 1.90e-02 | 101 |
| Page: 1 |
| Pathway ID | Tissue | Disease Stage | Description | Gene Ratio | Bg Ratio | pvalue | p.adjust | qvalue | Count |
| Page: 1 |
Top |
Cell-cell communication analysis |
| Identification of potential cell-cell interactions between two cell types and their ligand-receptor pairs for different disease states |
| Ligand | Receptor | LRpair | Pathway | Tissue | Disease Stage |
| Page: 1 |
Top |
Single-cell gene regulatory network inference analysis |
| Find out the significant the regulons (TFs) and the target genes of each regulon across cell types for different disease states |
| TF | Cell Type | Tissue | Disease Stage | Target Gene | RSS | Regulon Activity |
| ∗The dot plots of a searched regulon are shown for all cell subpopulations in each disease state of each tissue based on the regulon specific score inferred using pySCENIC and by calculating the average expression. |
| Page: 1 |
Top |
Somatic mutation of malignant transformation related genes |
| Annotation of somatic variants for genes involved in malignant transformation |
| Hugo Symbol | Variant Class | Variant Classification | dbSNP RS | HGVSc | HGVSp | HGVSp Short | SWISSPROT | BIOTYPE | SIFT | PolyPhen | Tumor Sample Barcode | Tissue | Histology | Sex | Age | Stage | Therapy Types | Drugs | Outcome |
| PGLYRP2 | SNV | Missense_Mutation | rs373319363 | c.958C>T | p.Arg320Trp | p.R320W | Q96PD5 | protein_coding | deleterious(0.01) | probably_damaging(1) | TCGA-A8-A07I-01 | Breast | breast invasive carcinoma | Female | >=65 | III/IV | Chemotherapy | 5-fluorouracil | CR |
| PGLYRP2 | SNV | Missense_Mutation | novel | c.1159N>T | p.Arg387Cys | p.R387C | Q96PD5 | protein_coding | deleterious(0.01) | probably_damaging(0.91) | TCGA-C8-A130-01 | Breast | breast invasive carcinoma | Female | <65 | III/IV | Unknown | Unknown | SD |
| PGLYRP2 | insertion | In_Frame_Ins | novel | c.832_833insCATTAATTT | p.Asp278delinsAlaLeuIleTyr | p.D278delinsALIY | Q96PD5 | protein_coding | TCGA-A2-A0D1-01 | Breast | breast invasive carcinoma | Female | >=65 | I/II | Chemotherapy | taxotere | SD | ||
| PGLYRP2 | insertion | Frame_Shift_Ins | novel | c.831_832insTTTTGCTTCATTATATTTATTT | p.Asp278PhefsTer8 | p.D278Ffs*8 | Q96PD5 | protein_coding | TCGA-A2-A0D1-01 | Breast | breast invasive carcinoma | Female | >=65 | I/II | Chemotherapy | taxotere | SD | ||
| PGLYRP2 | deletion | Frame_Shift_Del | c.941delN | p.Phe314SerfsTer13 | p.F314Sfs*13 | Q96PD5 | protein_coding | TCGA-C8-A12L-01 | Breast | breast invasive carcinoma | Female | >=65 | I/II | Unknown | Unknown | SD | |||
| PGLYRP2 | deletion | Frame_Shift_Del | novel | c.1447delN | p.Val483TrpfsTer? | p.V483Wfs*? | Q96PD5 | protein_coding | TCGA-EW-A2FV-01 | Breast | breast invasive carcinoma | Female | <65 | III/IV | Chemotherapy | docetaxel | SD | ||
| PGLYRP2 | insertion | In_Frame_Ins | novel | c.841_842insGTGAAT | p.Ile281delinsSerGluPhe | p.I281delinsSEF | Q96PD5 | protein_coding | TCGA-DS-A1OA-01 | Cervix | cervical & endocervical cancer | Female | >=65 | I/II | Chemotherapy | carboplatin | PD | ||
| PGLYRP2 | SNV | Missense_Mutation | c.260N>A | p.Ser87Asn | p.S87N | Q96PD5 | protein_coding | tolerated(0.19) | benign(0.048) | TCGA-A6-5665-01 | Colorectum | colon adenocarcinoma | Female | >=65 | I/II | Unknown | Unknown | PD | |
| PGLYRP2 | SNV | Missense_Mutation | c.392N>T | p.Gly131Val | p.G131V | Q96PD5 | protein_coding | deleterious(0) | probably_damaging(1) | TCGA-A6-6780-01 | Colorectum | colon adenocarcinoma | Male | >=65 | I/II | Unknown | Unknown | SD | |
| PGLYRP2 | SNV | Missense_Mutation | c.761C>T | p.Ala254Val | p.A254V | Q96PD5 | protein_coding | tolerated(0.26) | benign(0.003) | TCGA-AA-3811-01 | Colorectum | colon adenocarcinoma | Female | >=65 | III/IV | Unknown | Unknown | PD |
| Page: 1 2 3 4 5 6 7 8 |
Top |
Related drugs of malignant transformation related genes |
| Identification of chemicals and drugs interact with genes involved in malignant transfromation |
| (DGIdb 4.0) |
| Entrez ID | Symbol | Category | Interaction Types | Drug Claim Name | Drug Name | PMIDs |
| Page: 1 |

Copyright 2023-Present -The University of Texas Health Science Center at Houston |