
|
|||||
|
 | |
| |
| |
| |
| |
| |
|
Gene: PGLS |
Gene summary for PGLS |
| Gene information | Species | Human | Gene symbol | PGLS | Gene ID | 25796 |
| Gene name | 6-phosphogluconolactonase | |
| Gene Alias | 6PGL | |
| Cytomap | 19p13.11 | |
| Gene Type | protein-coding | GO ID | GO:0005975 | UniProtAcc | A0A0K0K1K7 |
Top |
Malignant transformation analysis |
| Identification of the aberrant gene expression in precancerous and cancerous lesions by comparing the gene expression of stem-like cells in diseased tissues with normal stem cells |
| Entrez ID | Symbol | Replicates | Species | Organ | Tissue | Adj P-value | Log2FC | Malignancy |
| 25796 | PGLS | CA_HPV_1 | Human | Cervix | CC | 9.29e-11 | -3.05e-01 | 0.0264 |
| 25796 | PGLS | CA_HPV_2 | Human | Cervix | CC | 1.69e-02 | -3.02e-01 | 0.0391 |
| 25796 | PGLS | CA_HPV_3 | Human | Cervix | CC | 2.75e-03 | -1.84e-02 | 0.0414 |
| 25796 | PGLS | N_HPV_1 | Human | Cervix | N_HPV | 4.43e-03 | -1.53e-01 | 0.0079 |
| 25796 | PGLS | CCI_1 | Human | Cervix | CC | 2.11e-05 | -6.38e-01 | 0.528 |
| 25796 | PGLS | CCI_2 | Human | Cervix | CC | 3.32e-02 | -5.51e-01 | 0.5249 |
| 25796 | PGLS | CCI_3 | Human | Cervix | CC | 3.02e-07 | -6.31e-01 | 0.516 |
| 25796 | PGLS | CCII_1 | Human | Cervix | CC | 6.33e-17 | -7.15e-01 | 0.3249 |
| 25796 | PGLS | sample3 | Human | Cervix | CC | 2.28e-02 | -9.35e-02 | 0.1387 |
| 25796 | PGLS | H2 | Human | Cervix | HSIL_HPV | 2.39e-06 | -3.40e-01 | 0.0632 |
| 25796 | PGLS | L1 | Human | Cervix | CC | 3.43e-08 | -5.43e-01 | 0.0802 |
| 25796 | PGLS | T1 | Human | Cervix | CC | 6.47e-05 | -4.11e-01 | 0.0918 |
| 25796 | PGLS | AEH-subject1 | Human | Endometrium | AEH | 9.22e-14 | -3.91e-01 | -0.3059 |
| 25796 | PGLS | AEH-subject2 | Human | Endometrium | AEH | 5.17e-06 | -1.96e-01 | -0.2525 |
| 25796 | PGLS | AEH-subject3 | Human | Endometrium | AEH | 2.99e-09 | -1.70e-01 | -0.2576 |
| 25796 | PGLS | AEH-subject4 | Human | Endometrium | AEH | 8.34e-10 | -4.23e-01 | -0.2657 |
| 25796 | PGLS | AEH-subject5 | Human | Endometrium | AEH | 6.37e-06 | -3.36e-01 | -0.2953 |
| 25796 | PGLS | EEC-subject1 | Human | Endometrium | EEC | 4.18e-14 | -4.18e-01 | -0.2682 |
| 25796 | PGLS | EEC-subject2 | Human | Endometrium | EEC | 5.93e-10 | -3.30e-01 | -0.2607 |
| 25796 | PGLS | EEC-subject3 | Human | Endometrium | EEC | 4.57e-38 | -5.08e-01 | -0.2525 |
| Page: 1 2 3 4 5 6 7 8 9 |
| Tissue | Expression Dynamics | Abbreviation |
| Cervix | 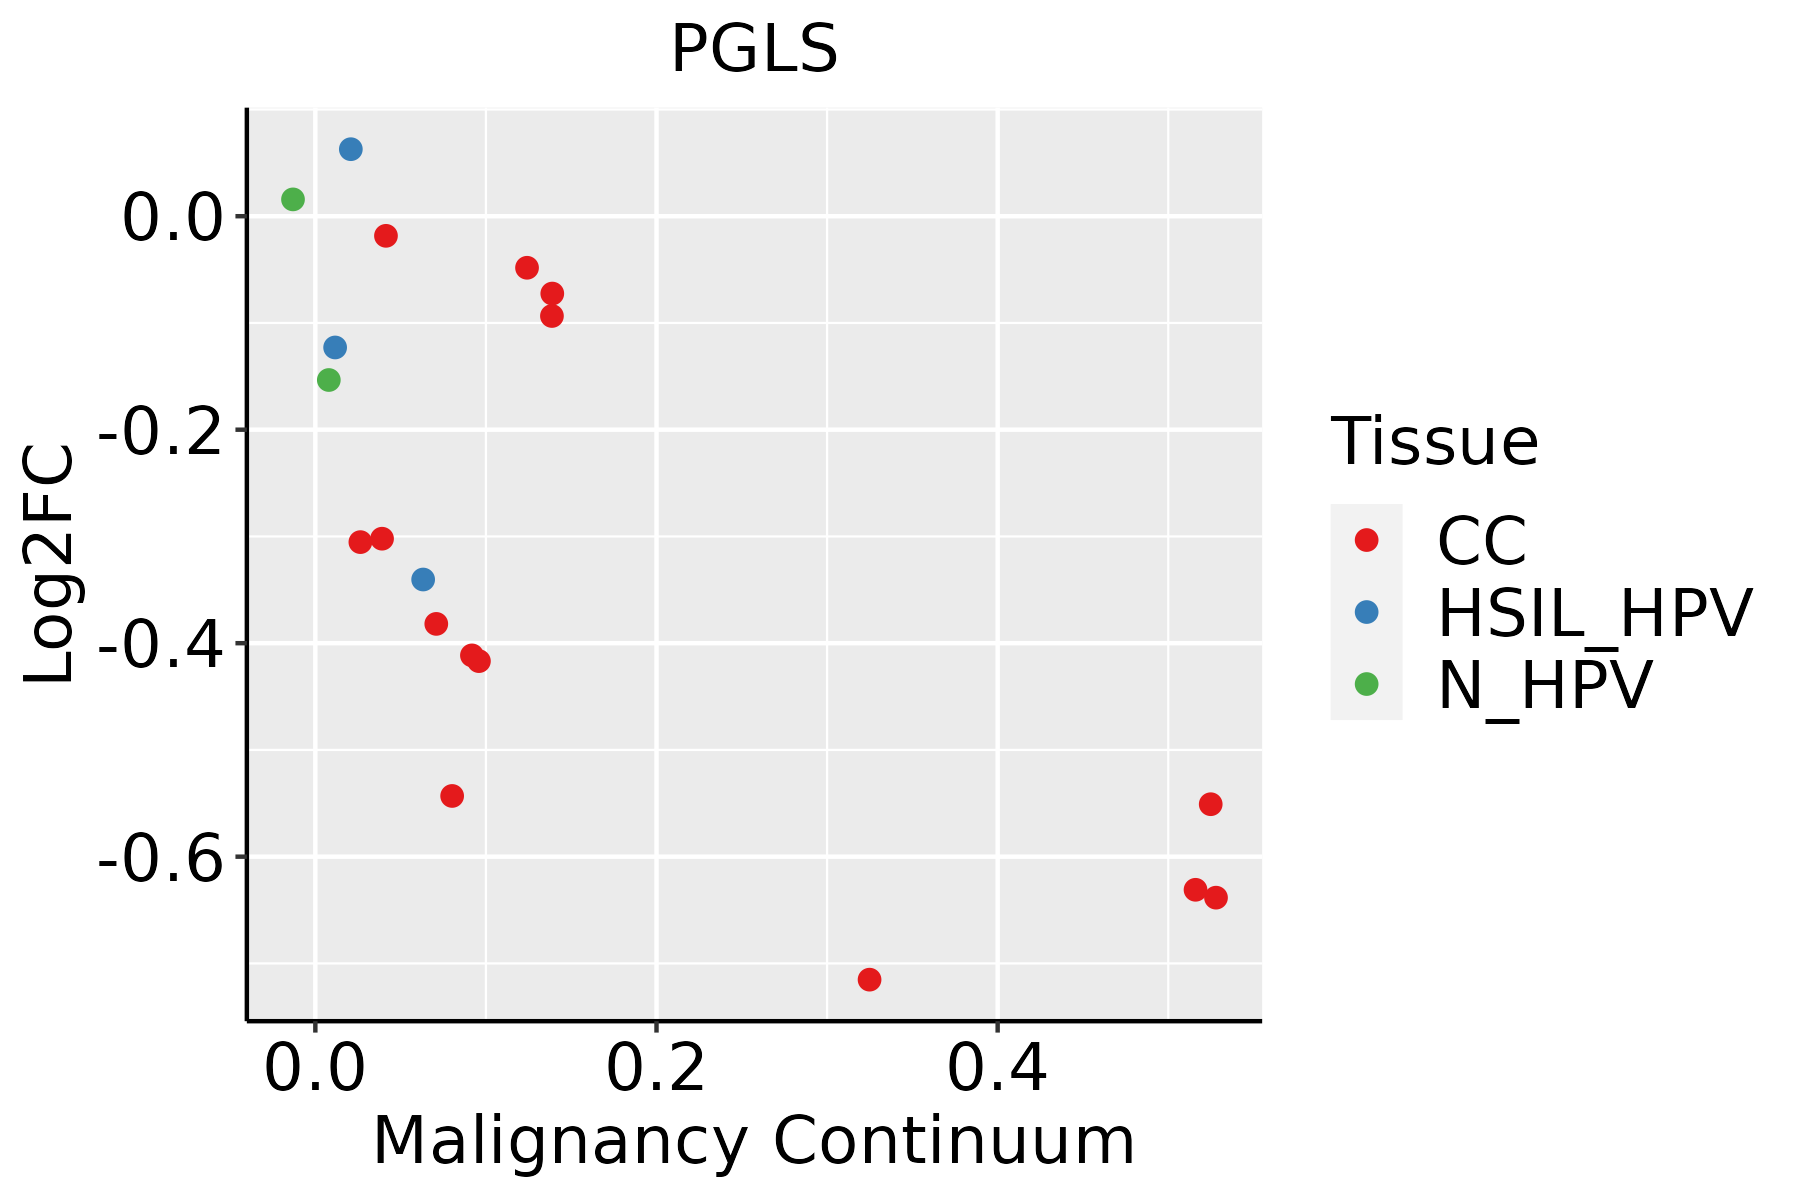 | CC: Cervix cancer |
| HSIL_HPV: HPV-infected high-grade squamous intraepithelial lesions | ||
| N_HPV: HPV-infected normal cervix | ||
| Endometrium | 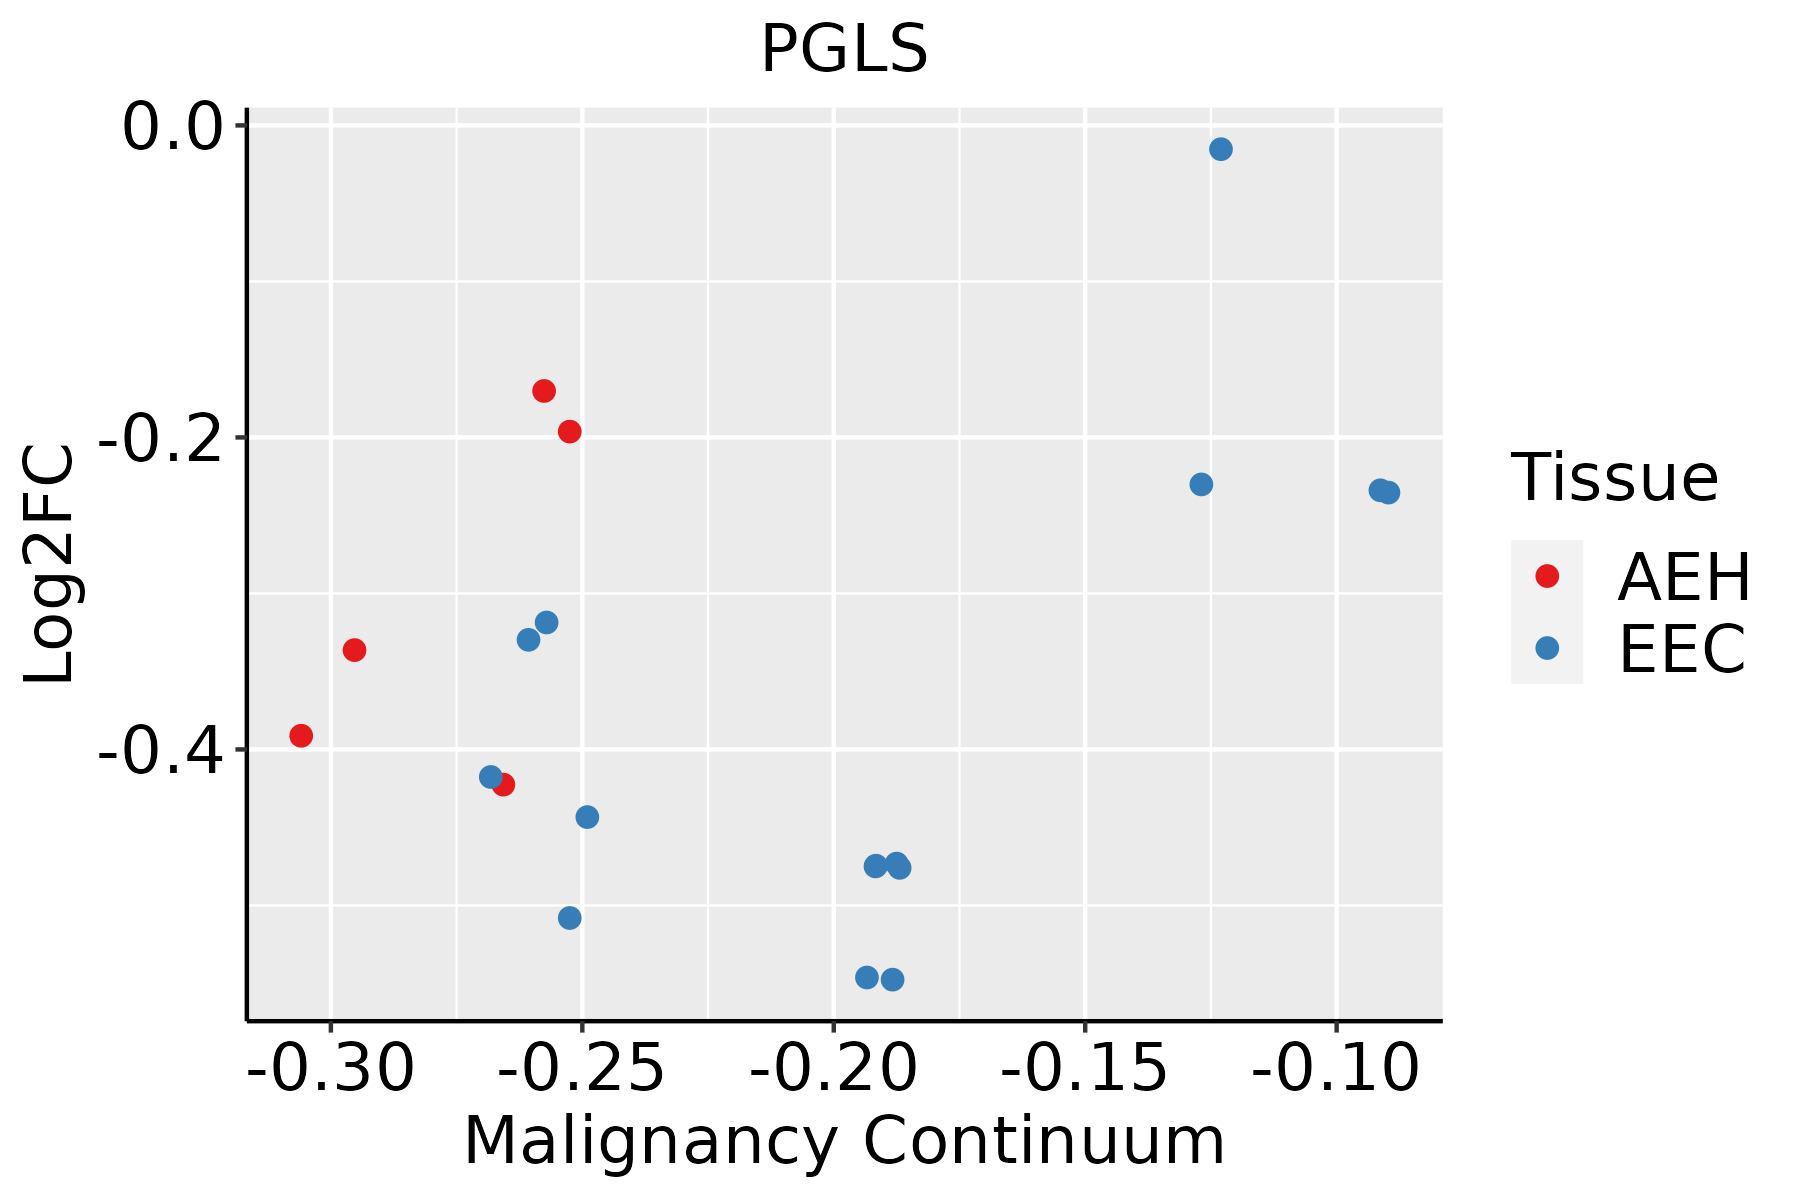 | AEH: Atypical endometrial hyperplasia |
| EEC: Endometrioid Cancer | ||
| Esophagus | 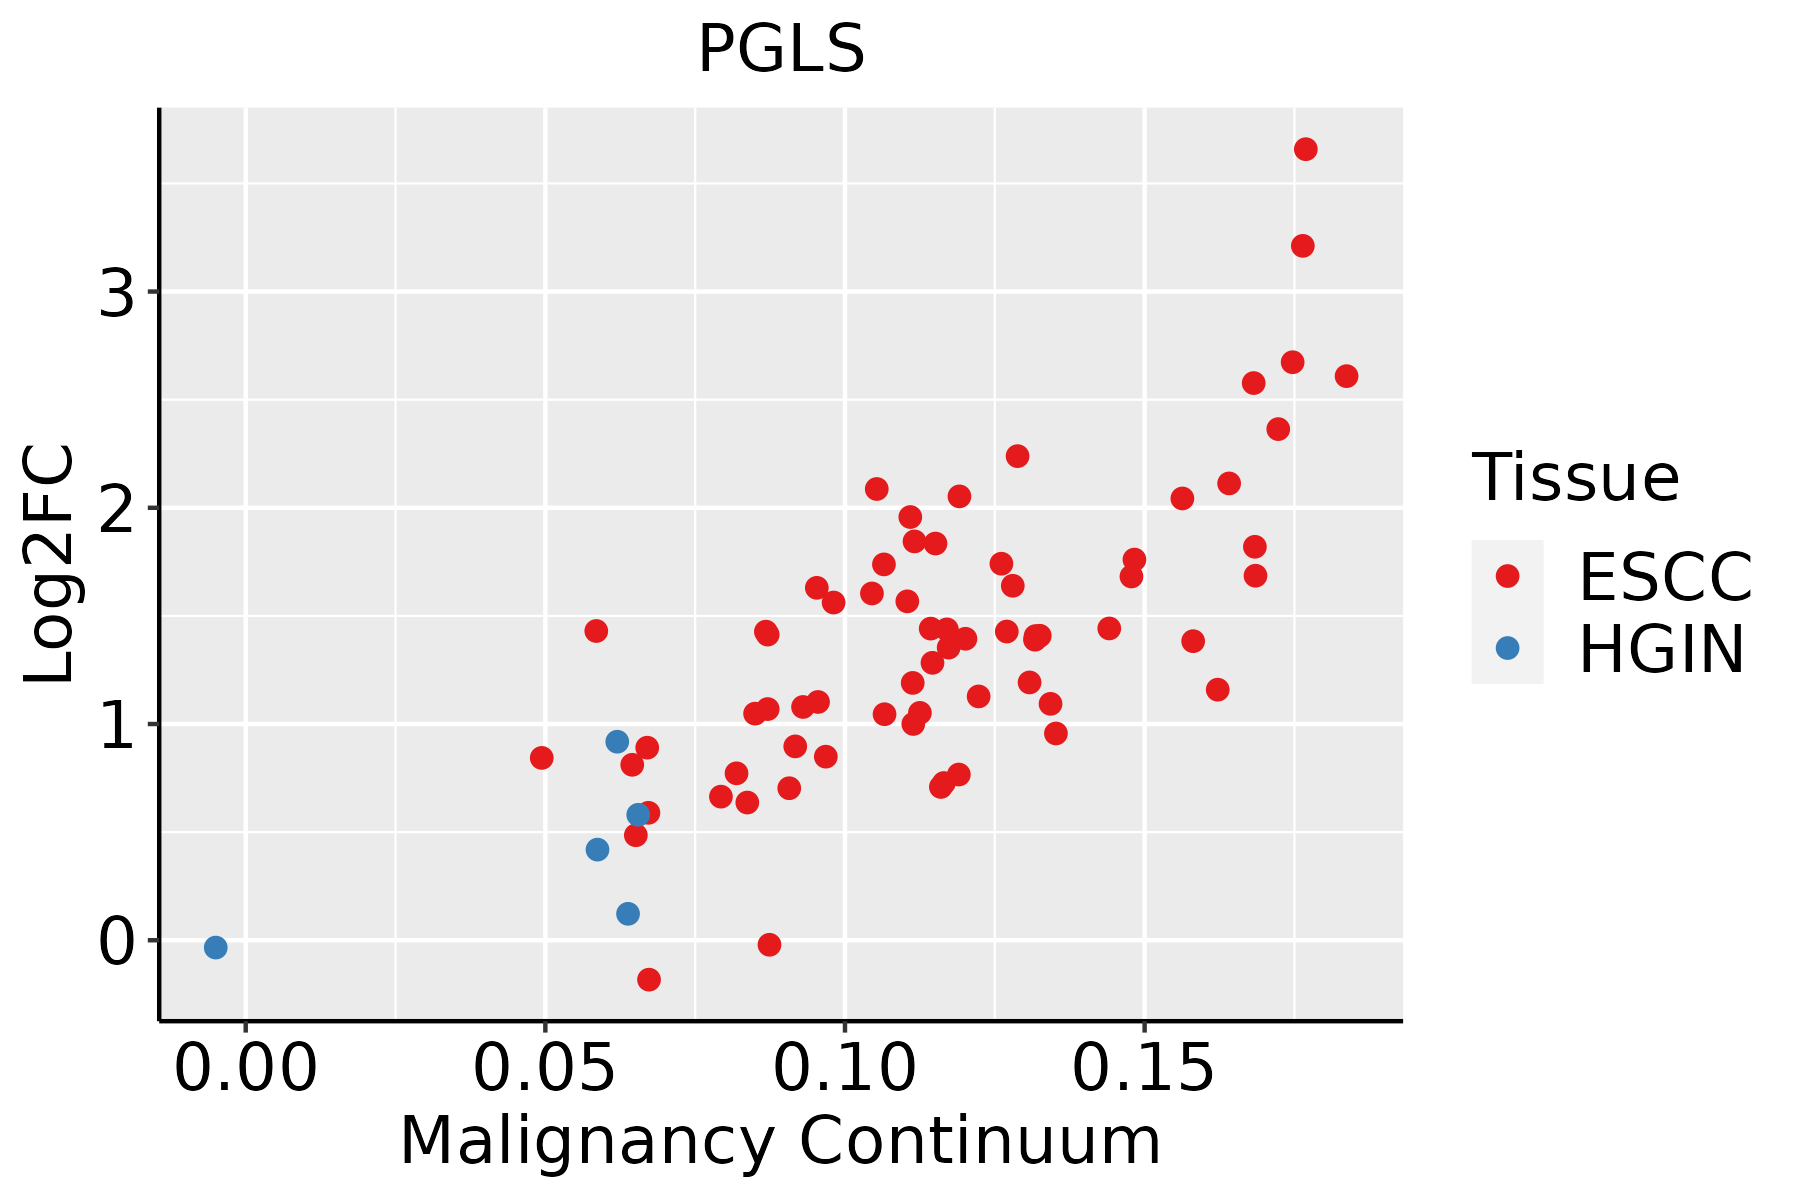 | ESCC: Esophageal squamous cell carcinoma |
| HGIN: High-grade intraepithelial neoplasias | ||
| LGIN: Low-grade intraepithelial neoplasias | ||
| Liver | 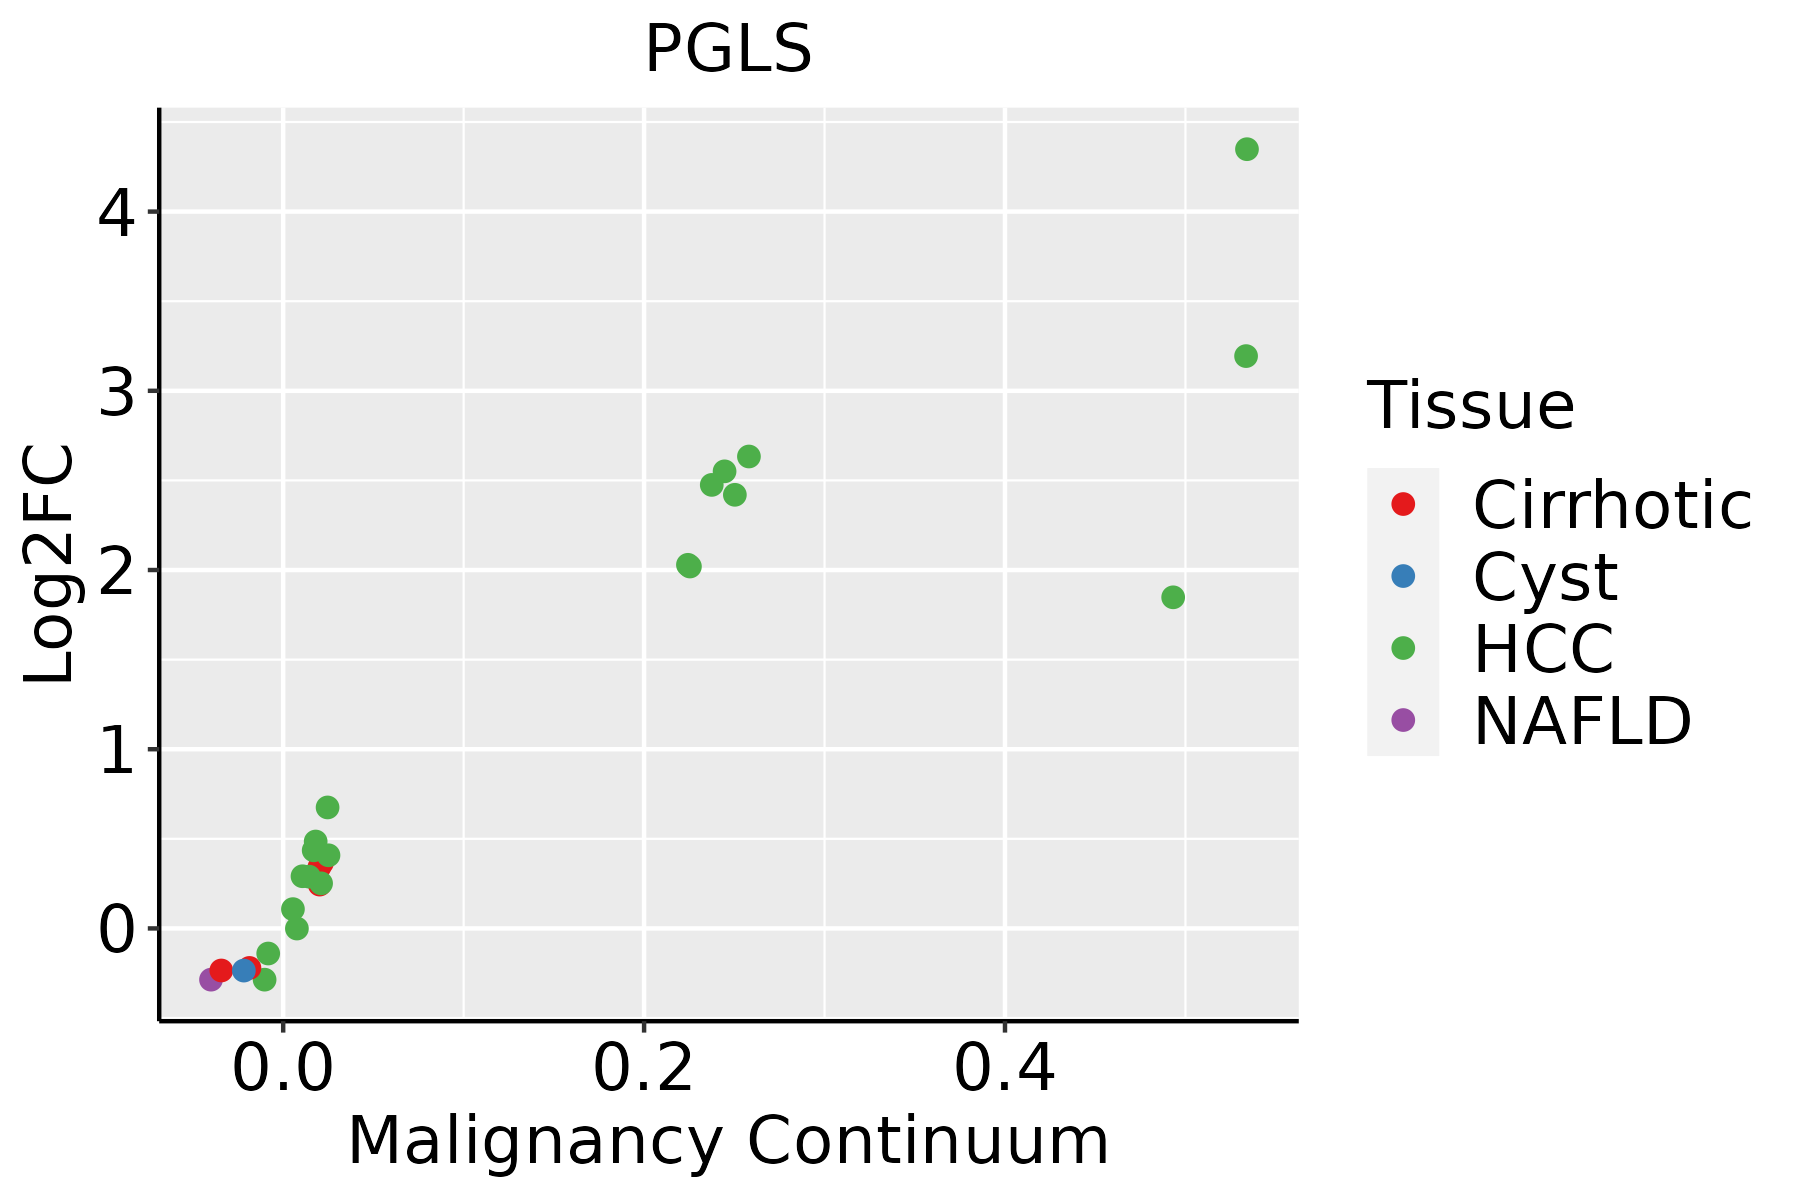 | HCC: Hepatocellular carcinoma |
| NAFLD: Non-alcoholic fatty liver disease | ||
| Oral Cavity | 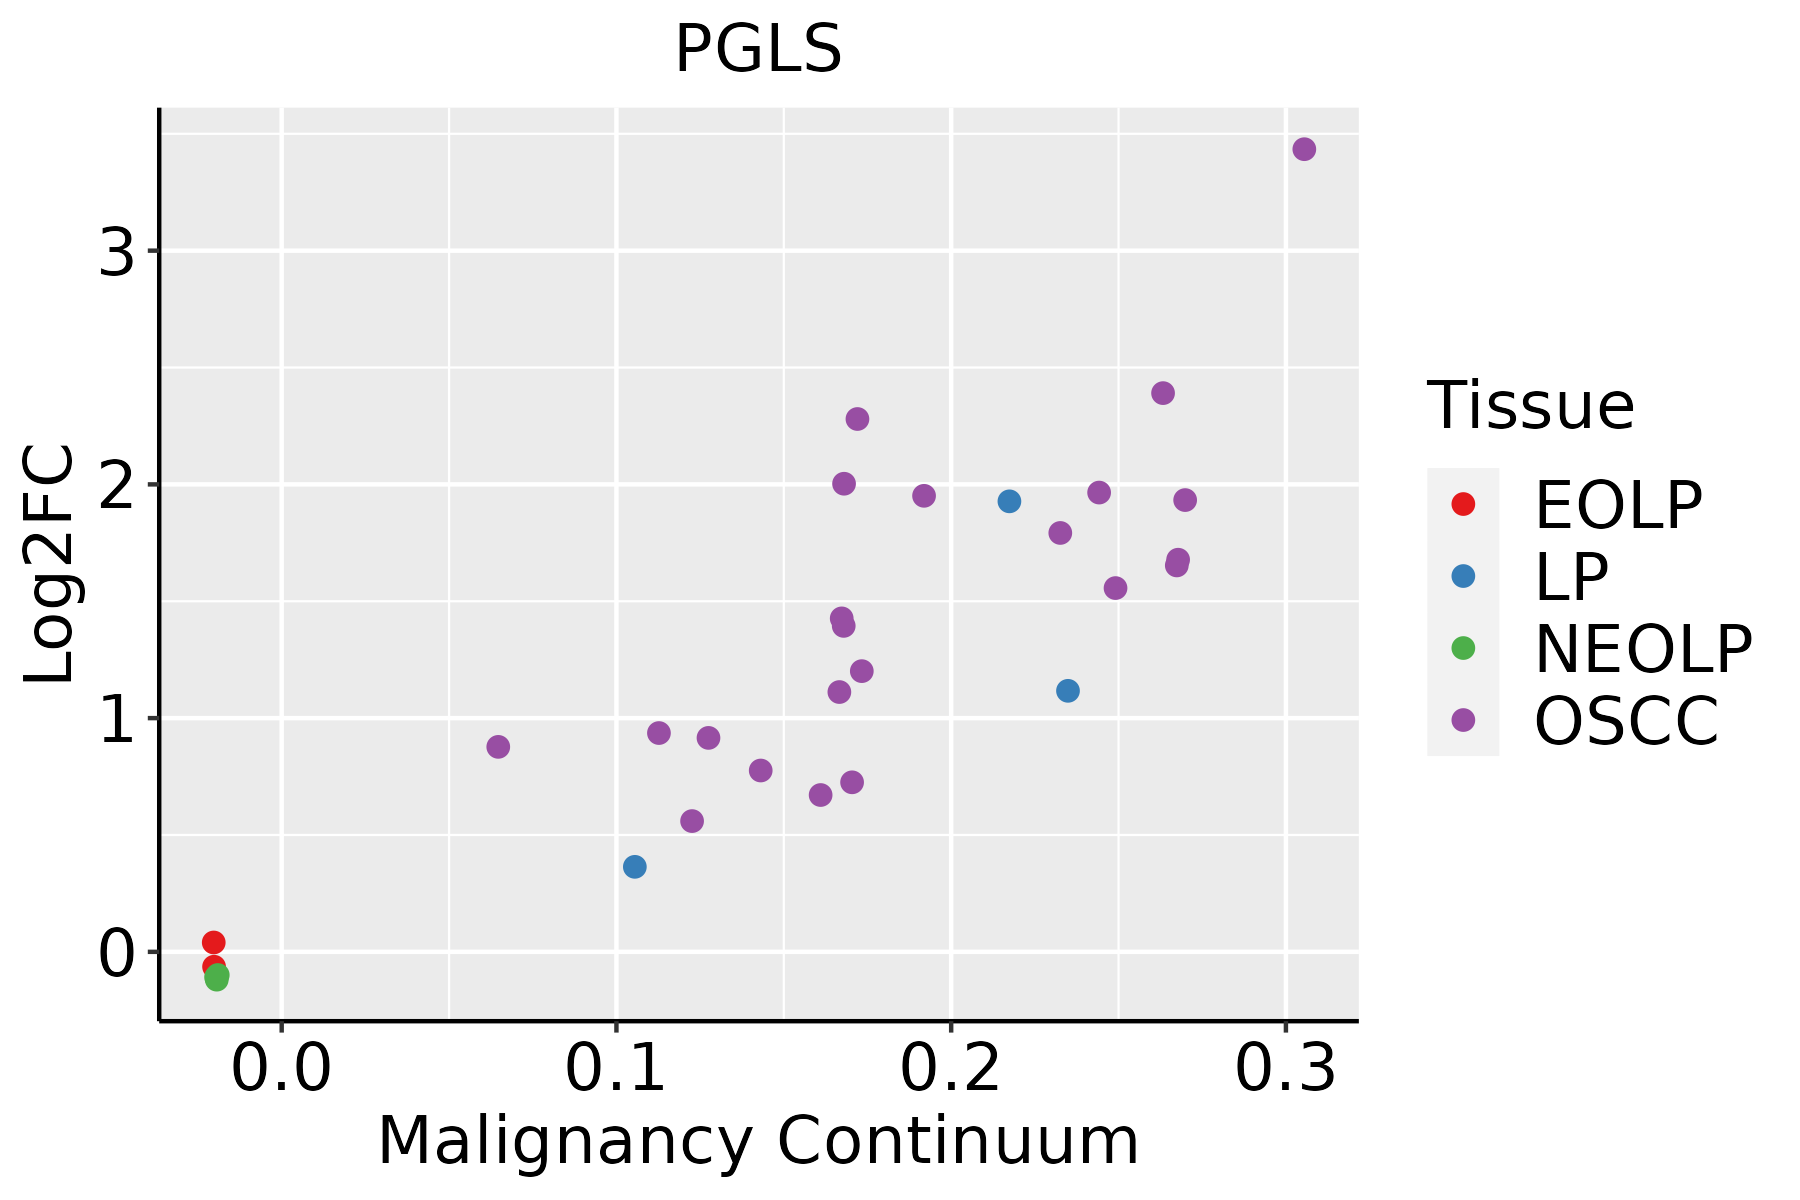 | EOLP: Erosive Oral lichen planus |
| LP: leukoplakia | ||
| NEOLP: Non-erosive oral lichen planus | ||
| OSCC: Oral squamous cell carcinoma | ||
| Prostate |  | BPH: Benign Prostatic Hyperplasia |
| Skin |  | AK: Actinic keratosis |
| cSCC: Cutaneous squamous cell carcinoma | ||
| SCCIS:squamous cell carcinoma in situ | ||
| Thyroid |  | ATC: Anaplastic thyroid cancer |
| HT: Hashimoto's thyroiditis | ||
| PTC: Papillary thyroid cancer |
| ∗log2FC in expression of this searched gene in stem-like cells from each diseased tissue sample relative to stem-like cells in normal samples in each tissue plotted against the malignancy continuum. Samples are colored based on if they are from different disease stage. |
Top |
Malignant transformation related pathway analysis |
| Find out the enriched GO biological processes and KEGG pathways involved in transition from healthy to precancer to cancer |
| Tissue | Disease Stage | Enriched GO biological Processes |
| Colorectum | AD |  |
| Colorectum | SER |  |
| Colorectum | MSS |  |
| Colorectum | MSI-H |  |
| Colorectum | FAP |  |
| ∗Top 15 enriched GO BP terms are showed in the bar plot of each disease state in each tissue. Each row represents a significant GO biological process which is colored according to the -log10(p.adjust). |
| Page: 1 2 3 4 5 6 7 8 9 |
| GO ID | Tissue | Disease Stage | Description | Gene Ratio | Bg Ratio | pvalue | p.adjust | Count |
| GO:00060919 | Cervix | CC | generation of precursor metabolites and energy | 105/2311 | 490/18723 | 7.40e-09 | 6.61e-07 | 105 |
| GO:000609114 | Cervix | HSIL_HPV | generation of precursor metabolites and energy | 32/737 | 490/18723 | 3.69e-03 | 3.27e-02 | 32 |
| GO:000609124 | Cervix | N_HPV | generation of precursor metabolites and energy | 40/534 | 490/18723 | 2.59e-09 | 7.88e-07 | 40 |
| GO:000609110 | Endometrium | AEH | generation of precursor metabolites and energy | 121/2100 | 490/18723 | 1.65e-17 | 8.23e-15 | 121 |
| GO:000609115 | Endometrium | EEC | generation of precursor metabolites and energy | 125/2168 | 490/18723 | 3.76e-18 | 1.88e-15 | 125 |
| GO:000609120 | Esophagus | HGIN | generation of precursor metabolites and energy | 145/2587 | 490/18723 | 3.41e-20 | 2.04e-17 | 145 |
| GO:00060983 | Esophagus | HGIN | pentose-phosphate shunt | 7/2587 | 15/18723 | 2.22e-03 | 2.28e-02 | 7 |
| GO:00067403 | Esophagus | HGIN | NADPH regeneration | 7/2587 | 16/18723 | 3.47e-03 | 3.22e-02 | 7 |
| GO:0006091110 | Esophagus | ESCC | generation of precursor metabolites and energy | 331/8552 | 490/18723 | 3.86e-23 | 8.45e-21 | 331 |
| GO:000674012 | Esophagus | ESCC | NADPH regeneration | 13/8552 | 16/18723 | 4.05e-03 | 1.62e-02 | 13 |
| GO:000609812 | Esophagus | ESCC | pentose-phosphate shunt | 12/8552 | 15/18723 | 7.31e-03 | 2.63e-02 | 12 |
| GO:00067393 | Esophagus | ESCC | NADP metabolic process | 23/8552 | 35/18723 | 1.34e-02 | 4.38e-02 | 23 |
| GO:000609112 | Liver | Cirrhotic | generation of precursor metabolites and energy | 238/4634 | 490/18723 | 6.85e-31 | 1.07e-27 | 238 |
| GO:0006098 | Liver | Cirrhotic | pentose-phosphate shunt | 9/4634 | 15/18723 | 3.88e-03 | 2.10e-02 | 9 |
| GO:0051156 | Liver | Cirrhotic | glucose 6-phosphate metabolic process | 12/4634 | 24/18723 | 6.58e-03 | 3.25e-02 | 12 |
| GO:0006740 | Liver | Cirrhotic | NADPH regeneration | 9/4634 | 16/18723 | 6.94e-03 | 3.38e-02 | 9 |
| GO:000609122 | Liver | HCC | generation of precursor metabolites and energy | 340/7958 | 490/18723 | 4.04e-34 | 2.85e-31 | 340 |
| GO:00067401 | Liver | HCC | NADPH regeneration | 14/7958 | 16/18723 | 2.73e-04 | 1.98e-03 | 14 |
| GO:0006739 | Liver | HCC | NADP metabolic process | 25/7958 | 35/18723 | 5.05e-04 | 3.29e-03 | 25 |
| GO:00060981 | Liver | HCC | pentose-phosphate shunt | 13/7958 | 15/18723 | 5.67e-04 | 3.61e-03 | 13 |
| Page: 1 2 |
| Pathway ID | Tissue | Disease Stage | Description | Gene Ratio | Bg Ratio | pvalue | p.adjust | qvalue | Count |
| hsa0120016 | Esophagus | HGIN | Carbon metabolism | 31/1383 | 115/8465 | 2.51e-03 | 2.10e-02 | 1.67e-02 | 31 |
| hsa0120017 | Esophagus | HGIN | Carbon metabolism | 31/1383 | 115/8465 | 2.51e-03 | 2.10e-02 | 1.67e-02 | 31 |
| hsa0120023 | Esophagus | ESCC | Carbon metabolism | 79/4205 | 115/8465 | 2.50e-05 | 1.21e-04 | 6.22e-05 | 79 |
| hsa0120033 | Esophagus | ESCC | Carbon metabolism | 79/4205 | 115/8465 | 2.50e-05 | 1.21e-04 | 6.22e-05 | 79 |
| hsa0120021 | Liver | Cirrhotic | Carbon metabolism | 64/2530 | 115/8465 | 6.37e-09 | 1.18e-07 | 7.26e-08 | 64 |
| hsa00030 | Liver | Cirrhotic | Pentose phosphate pathway | 16/2530 | 30/8465 | 6.04e-03 | 2.12e-02 | 1.30e-02 | 16 |
| hsa0120031 | Liver | Cirrhotic | Carbon metabolism | 64/2530 | 115/8465 | 6.37e-09 | 1.18e-07 | 7.26e-08 | 64 |
| hsa000301 | Liver | Cirrhotic | Pentose phosphate pathway | 16/2530 | 30/8465 | 6.04e-03 | 2.12e-02 | 1.30e-02 | 16 |
| hsa0120041 | Liver | HCC | Carbon metabolism | 89/4020 | 115/8465 | 3.92e-11 | 6.56e-10 | 3.65e-10 | 89 |
| hsa000302 | Liver | HCC | Pentose phosphate pathway | 21/4020 | 30/8465 | 1.06e-02 | 2.71e-02 | 1.51e-02 | 21 |
| hsa0120051 | Liver | HCC | Carbon metabolism | 89/4020 | 115/8465 | 3.92e-11 | 6.56e-10 | 3.65e-10 | 89 |
| hsa000303 | Liver | HCC | Pentose phosphate pathway | 21/4020 | 30/8465 | 1.06e-02 | 2.71e-02 | 1.51e-02 | 21 |
| hsa0120014 | Oral cavity | OSCC | Carbon metabolism | 74/3704 | 115/8465 | 6.10e-06 | 3.05e-05 | 1.55e-05 | 74 |
| hsa0120015 | Oral cavity | OSCC | Carbon metabolism | 74/3704 | 115/8465 | 6.10e-06 | 3.05e-05 | 1.55e-05 | 74 |
| hsa0120022 | Oral cavity | LP | Carbon metabolism | 62/2418 | 115/8465 | 8.38e-09 | 1.39e-07 | 8.99e-08 | 62 |
| hsa0120032 | Oral cavity | LP | Carbon metabolism | 62/2418 | 115/8465 | 8.38e-09 | 1.39e-07 | 8.99e-08 | 62 |
| Page: 1 |
Top |
Cell-cell communication analysis |
| Identification of potential cell-cell interactions between two cell types and their ligand-receptor pairs for different disease states |
| Ligand | Receptor | LRpair | Pathway | Tissue | Disease Stage |
| Page: 1 |
Top |
Single-cell gene regulatory network inference analysis |
| Find out the significant the regulons (TFs) and the target genes of each regulon across cell types for different disease states |
| TF | Cell Type | Tissue | Disease Stage | Target Gene | RSS | Regulon Activity |
| ∗The dot plots of a searched regulon are shown for all cell subpopulations in each disease state of each tissue based on the regulon specific score inferred using pySCENIC and by calculating the average expression. |
| Page: 1 |
Top |
Somatic mutation of malignant transformation related genes |
| Annotation of somatic variants for genes involved in malignant transformation |
| Hugo Symbol | Variant Class | Variant Classification | dbSNP RS | HGVSc | HGVSp | HGVSp Short | SWISSPROT | BIOTYPE | SIFT | PolyPhen | Tumor Sample Barcode | Tissue | Histology | Sex | Age | Stage | Therapy Types | Drugs | Outcome |
| PGLS | SNV | Missense_Mutation | c.649N>C | p.Glu217Gln | p.E217Q | O95336 | protein_coding | tolerated(0.08) | benign(0.173) | TCGA-AC-A23H-01 | Breast | breast invasive carcinoma | Female | >=65 | I/II | Unknown | Unknown | PD | |
| PGLS | SNV | Missense_Mutation | rs376388573 | c.454N>A | p.Asp152Asn | p.D152N | O95336 | protein_coding | deleterious(0) | probably_damaging(0.996) | TCGA-2W-A8YY-01 | Cervix | cervical & endocervical cancer | Female | <65 | I/II | Chemotherapy | cisplatin | CR |
| PGLS | SNV | Missense_Mutation | c.205N>T | p.Ser69Cys | p.S69C | O95336 | protein_coding | deleterious(0.05) | benign(0.332) | TCGA-CK-4951-01 | Colorectum | colon adenocarcinoma | Female | >=65 | I/II | Unknown | Unknown | PD | |
| PGLS | SNV | Missense_Mutation | c.640C>T | p.Arg214Cys | p.R214C | O95336 | protein_coding | deleterious(0) | probably_damaging(0.978) | TCGA-EI-6511-01 | Colorectum | rectum adenocarcinoma | Male | <65 | III/IV | Chemotherapy | oxaliplatinum+5-fu | SD | |
| PGLS | SNV | Missense_Mutation | novel | c.457N>T | p.Gly153Cys | p.G153C | O95336 | protein_coding | deleterious(0) | probably_damaging(0.999) | TCGA-AX-A2HA-01 | Endometrium | uterine corpus endometrioid carcinoma | Female | <65 | I/II | Unknown | Unknown | SD |
| PGLS | SNV | Missense_Mutation | novel | c.667N>T | p.Pro223Ser | p.P223S | O95336 | protein_coding | deleterious(0.03) | benign(0) | TCGA-B5-A5OD-01 | Endometrium | uterine corpus endometrioid carcinoma | Female | >=65 | III/IV | Chemotherapy | carboplatin | SD |
| PGLS | SNV | Missense_Mutation | c.458N>A | p.Gly153Asp | p.G153D | O95336 | protein_coding | deleterious(0) | probably_damaging(0.996) | TCGA-D1-A17F-01 | Endometrium | uterine corpus endometrioid carcinoma | Female | >=65 | I/II | Unknown | Unknown | SD | |
| PGLS | SNV | Missense_Mutation | rs146930299 | c.553N>T | p.Arg185Cys | p.R185C | O95336 | protein_coding | deleterious(0) | probably_damaging(1) | TCGA-FI-A2D5-01 | Endometrium | uterine corpus endometrioid carcinoma | Female | <65 | III/IV | Chemotherapy | carboplatinum | PD |
| PGLS | SNV | Missense_Mutation | novel | c.293N>G | p.His98Arg | p.H98R | O95336 | protein_coding | tolerated(0.18) | possibly_damaging(0.474) | TCGA-DD-AACE-01 | Liver | liver hepatocellular carcinoma | Male | <65 | I/II | Unknown | Unknown | PD |
| PGLS | deletion | Frame_Shift_Del | novel | c.445delG | p.Val149TrpfsTer38 | p.V149Wfs*38 | O95336 | protein_coding | TCGA-WQ-A9G7-01 | Liver | liver hepatocellular carcinoma | Female | >=65 | III/IV | Unknown | Unknown | SD |
| Page: 1 2 |
Top |
Related drugs of malignant transformation related genes |
| Identification of chemicals and drugs interact with genes involved in malignant transfromation |
| (DGIdb 4.0) |
| Entrez ID | Symbol | Category | Interaction Types | Drug Claim Name | Drug Name | PMIDs |
| Page: 1 |

Copyright 2023-Present -The University of Texas Health Science Center at Houston |