
|
|||||
|
 | |
| |
| |
| |
| |
| |
|
Gene: PGK1 |
Gene summary for PGK1 |
| Gene information | Species | Human | Gene symbol | PGK1 | Gene ID | 5230 |
| Gene name | phosphoglycerate kinase 1 | |
| Gene Alias | HEL-S-68p | |
| Cytomap | Xq21.1 | |
| Gene Type | protein-coding | GO ID | GO:0001525 | UniProtAcc | P00558 |
Top |
Malignant transformation analysis |
| Identification of the aberrant gene expression in precancerous and cancerous lesions by comparing the gene expression of stem-like cells in diseased tissues with normal stem cells |
| Entrez ID | Symbol | Replicates | Species | Organ | Tissue | Adj P-value | Log2FC | Malignancy |
| 5230 | PGK1 | GSM4909281 | Human | Breast | IDC | 1.29e-26 | 7.14e-01 | 0.21 |
| 5230 | PGK1 | GSM4909282 | Human | Breast | IDC | 2.75e-22 | 5.77e-01 | -0.0288 |
| 5230 | PGK1 | GSM4909285 | Human | Breast | IDC | 1.30e-13 | 5.32e-01 | 0.21 |
| 5230 | PGK1 | GSM4909286 | Human | Breast | IDC | 1.40e-05 | -2.60e-01 | 0.1081 |
| 5230 | PGK1 | GSM4909288 | Human | Breast | IDC | 7.40e-04 | 1.34e-01 | 0.0988 |
| 5230 | PGK1 | GSM4909289 | Human | Breast | IDC | 7.57e-06 | 4.47e-01 | 0.1064 |
| 5230 | PGK1 | GSM4909290 | Human | Breast | IDC | 2.59e-04 | 4.14e-01 | 0.2096 |
| 5230 | PGK1 | GSM4909294 | Human | Breast | IDC | 4.91e-14 | 4.19e-01 | 0.2022 |
| 5230 | PGK1 | GSM4909296 | Human | Breast | IDC | 5.12e-13 | -2.83e-01 | 0.1524 |
| 5230 | PGK1 | GSM4909297 | Human | Breast | IDC | 2.15e-10 | -7.55e-02 | 0.1517 |
| 5230 | PGK1 | GSM4909298 | Human | Breast | IDC | 2.06e-03 | -1.46e-01 | 0.1551 |
| 5230 | PGK1 | GSM4909301 | Human | Breast | IDC | 1.73e-03 | -2.49e-01 | 0.1577 |
| 5230 | PGK1 | GSM4909302 | Human | Breast | IDC | 3.17e-02 | 2.58e-01 | 0.1545 |
| 5230 | PGK1 | GSM4909304 | Human | Breast | IDC | 2.62e-03 | 3.73e-01 | 0.1636 |
| 5230 | PGK1 | GSM4909311 | Human | Breast | IDC | 3.59e-31 | -3.13e-01 | 0.1534 |
| 5230 | PGK1 | GSM4909312 | Human | Breast | IDC | 9.98e-10 | -1.77e-01 | 0.1552 |
| 5230 | PGK1 | GSM4909313 | Human | Breast | IDC | 1.84e-03 | -2.00e-01 | 0.0391 |
| 5230 | PGK1 | GSM4909315 | Human | Breast | IDC | 2.81e-42 | 7.84e-01 | 0.21 |
| 5230 | PGK1 | GSM4909316 | Human | Breast | IDC | 4.88e-08 | 2.77e-01 | 0.21 |
| 5230 | PGK1 | GSM4909317 | Human | Breast | IDC | 1.34e-07 | 4.67e-01 | 0.1355 |
| Page: 1 2 3 4 5 6 7 8 9 10 11 12 13 14 15 |
| Tissue | Expression Dynamics | Abbreviation |
| Breast | 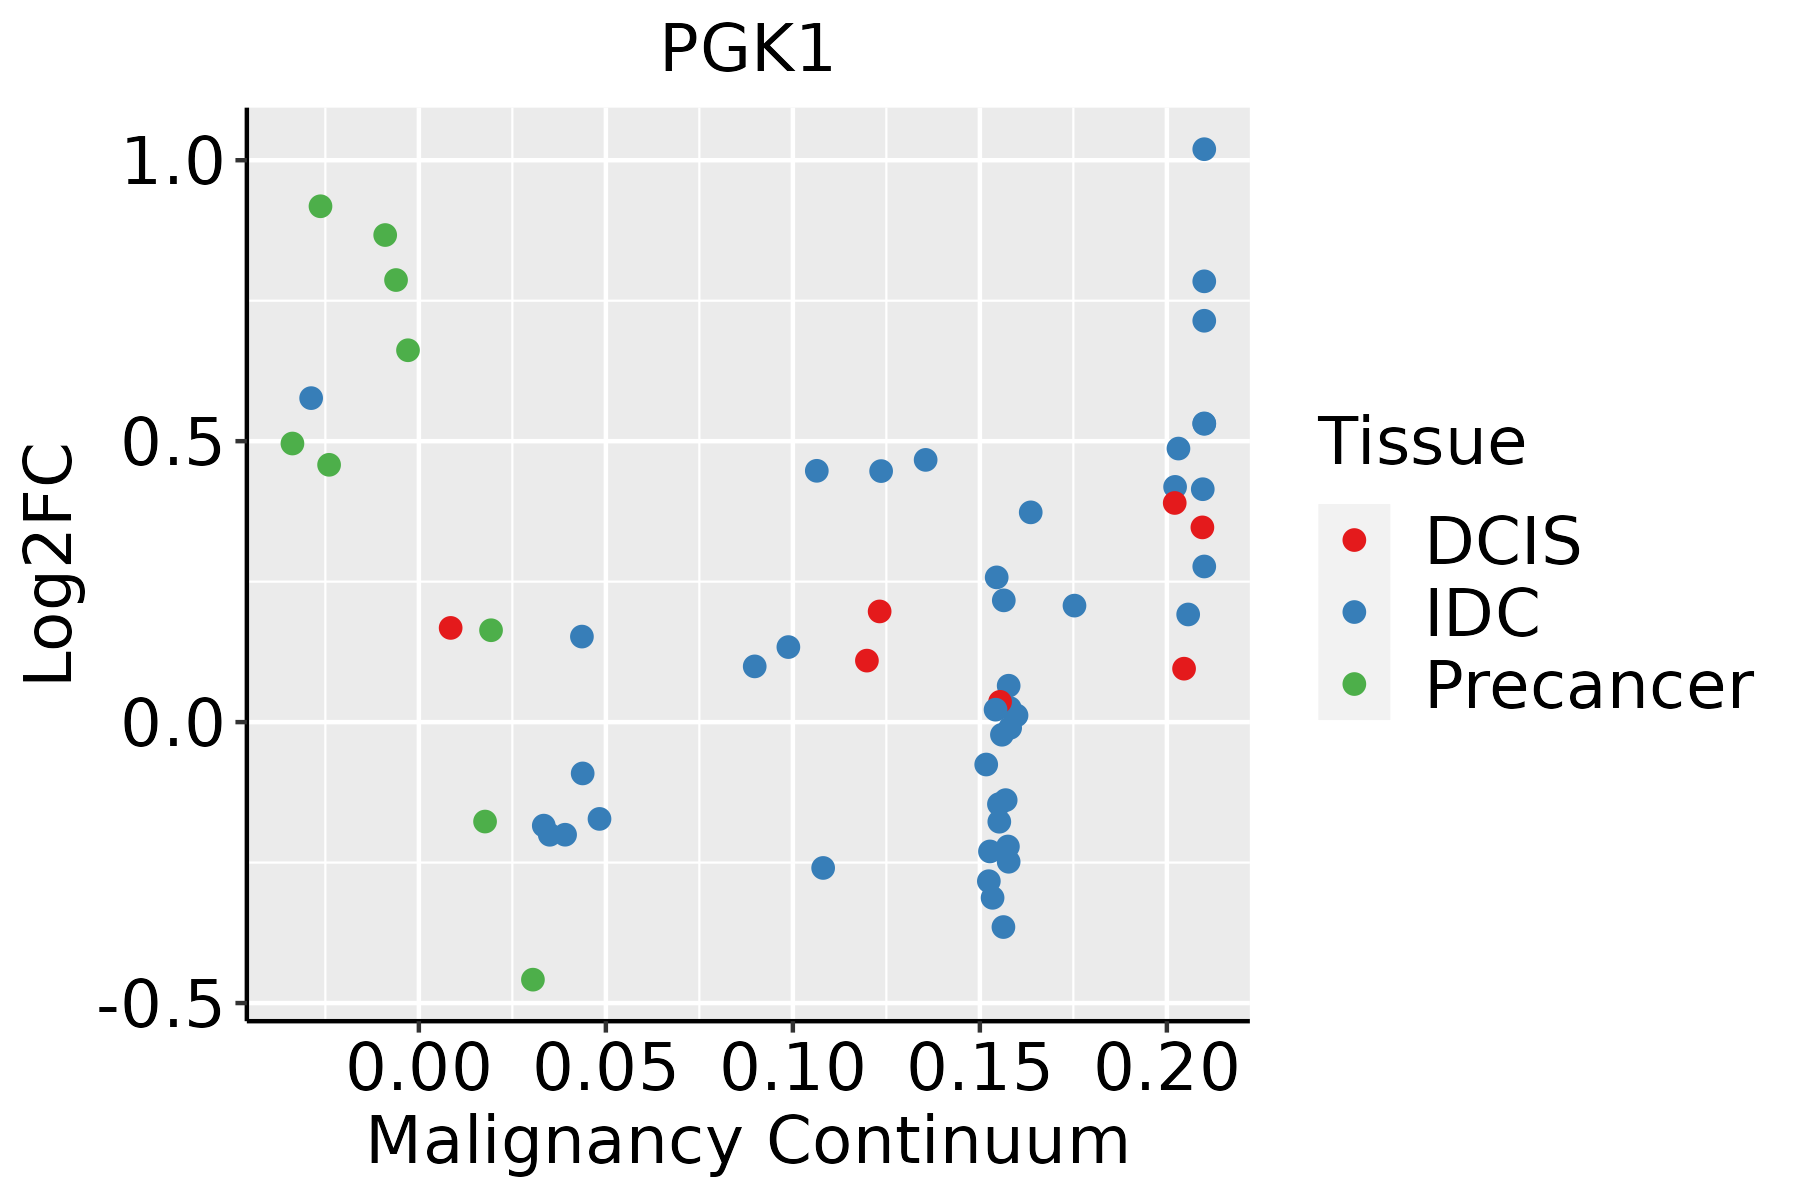 | IDC: Invasive ductal carcinoma |
| DCIS: Ductal carcinoma in situ | ||
| Precancer(BRCA1-mut): Precancerous lesion from BRCA1 mutation carriers | ||
| Cervix | 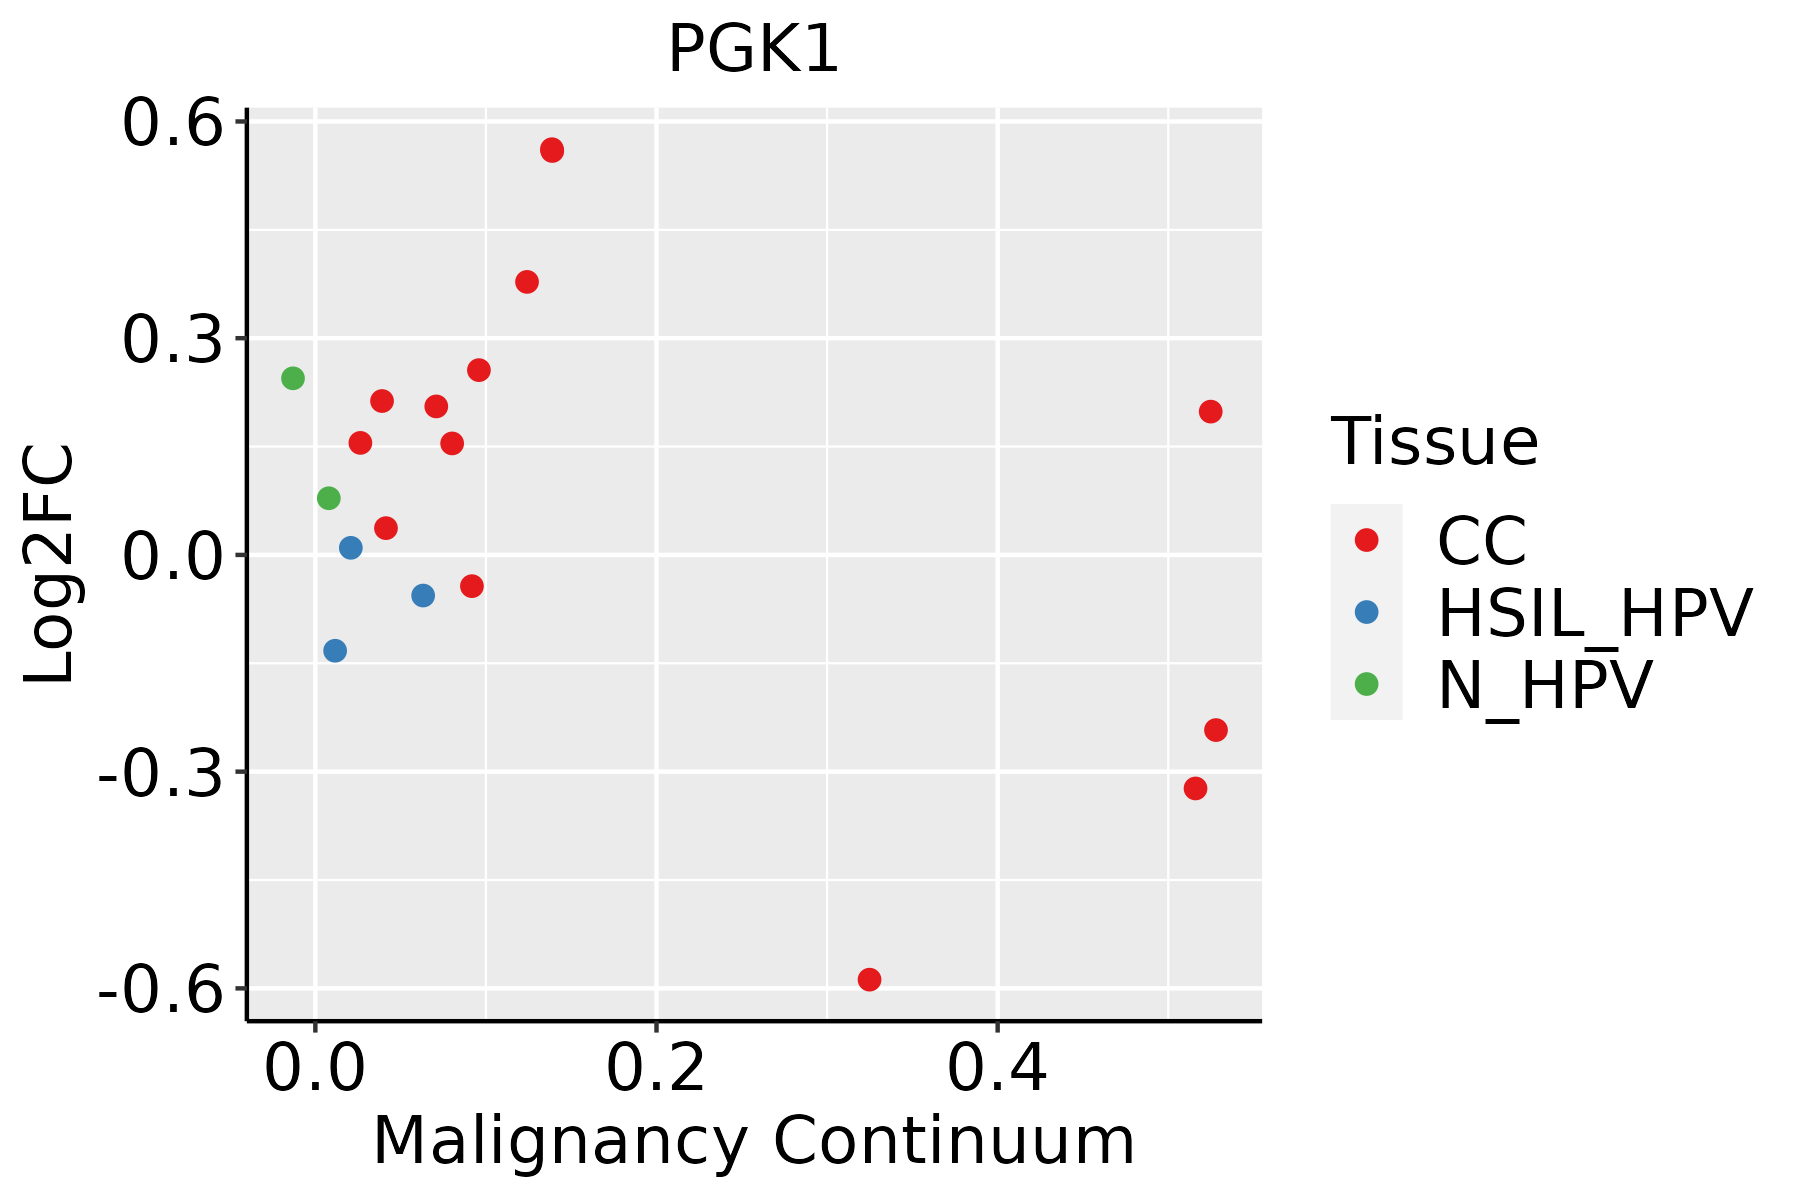 | CC: Cervix cancer |
| HSIL_HPV: HPV-infected high-grade squamous intraepithelial lesions | ||
| N_HPV: HPV-infected normal cervix | ||
| Colorectum (GSE201348) |  | FAP: Familial adenomatous polyposis |
| CRC: Colorectal cancer | ||
| Colorectum (HTA11) |  | AD: Adenomas |
| SER: Sessile serrated lesions | ||
| MSI-H: Microsatellite-high colorectal cancer | ||
| MSS: Microsatellite stable colorectal cancer | ||
| Endometrium | 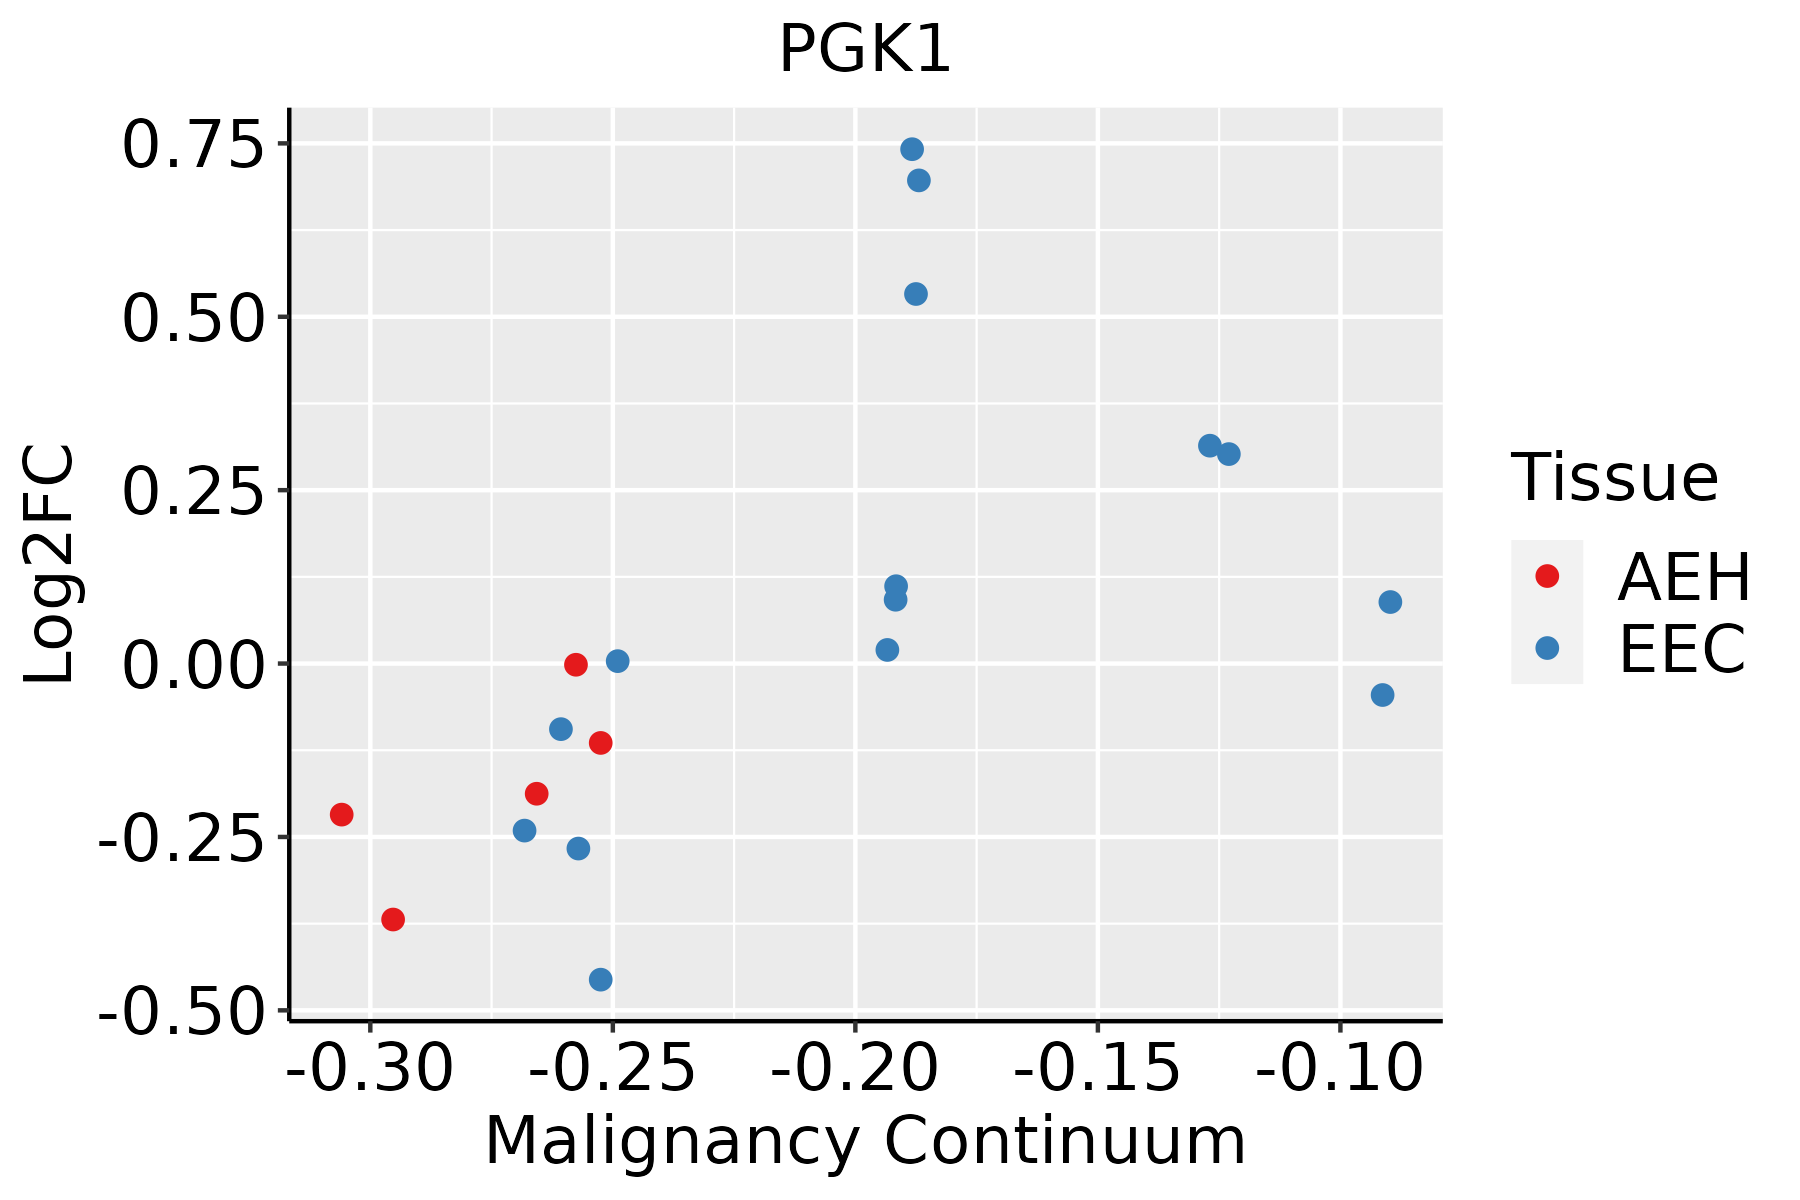 | AEH: Atypical endometrial hyperplasia |
| EEC: Endometrioid Cancer | ||
| Esophagus | 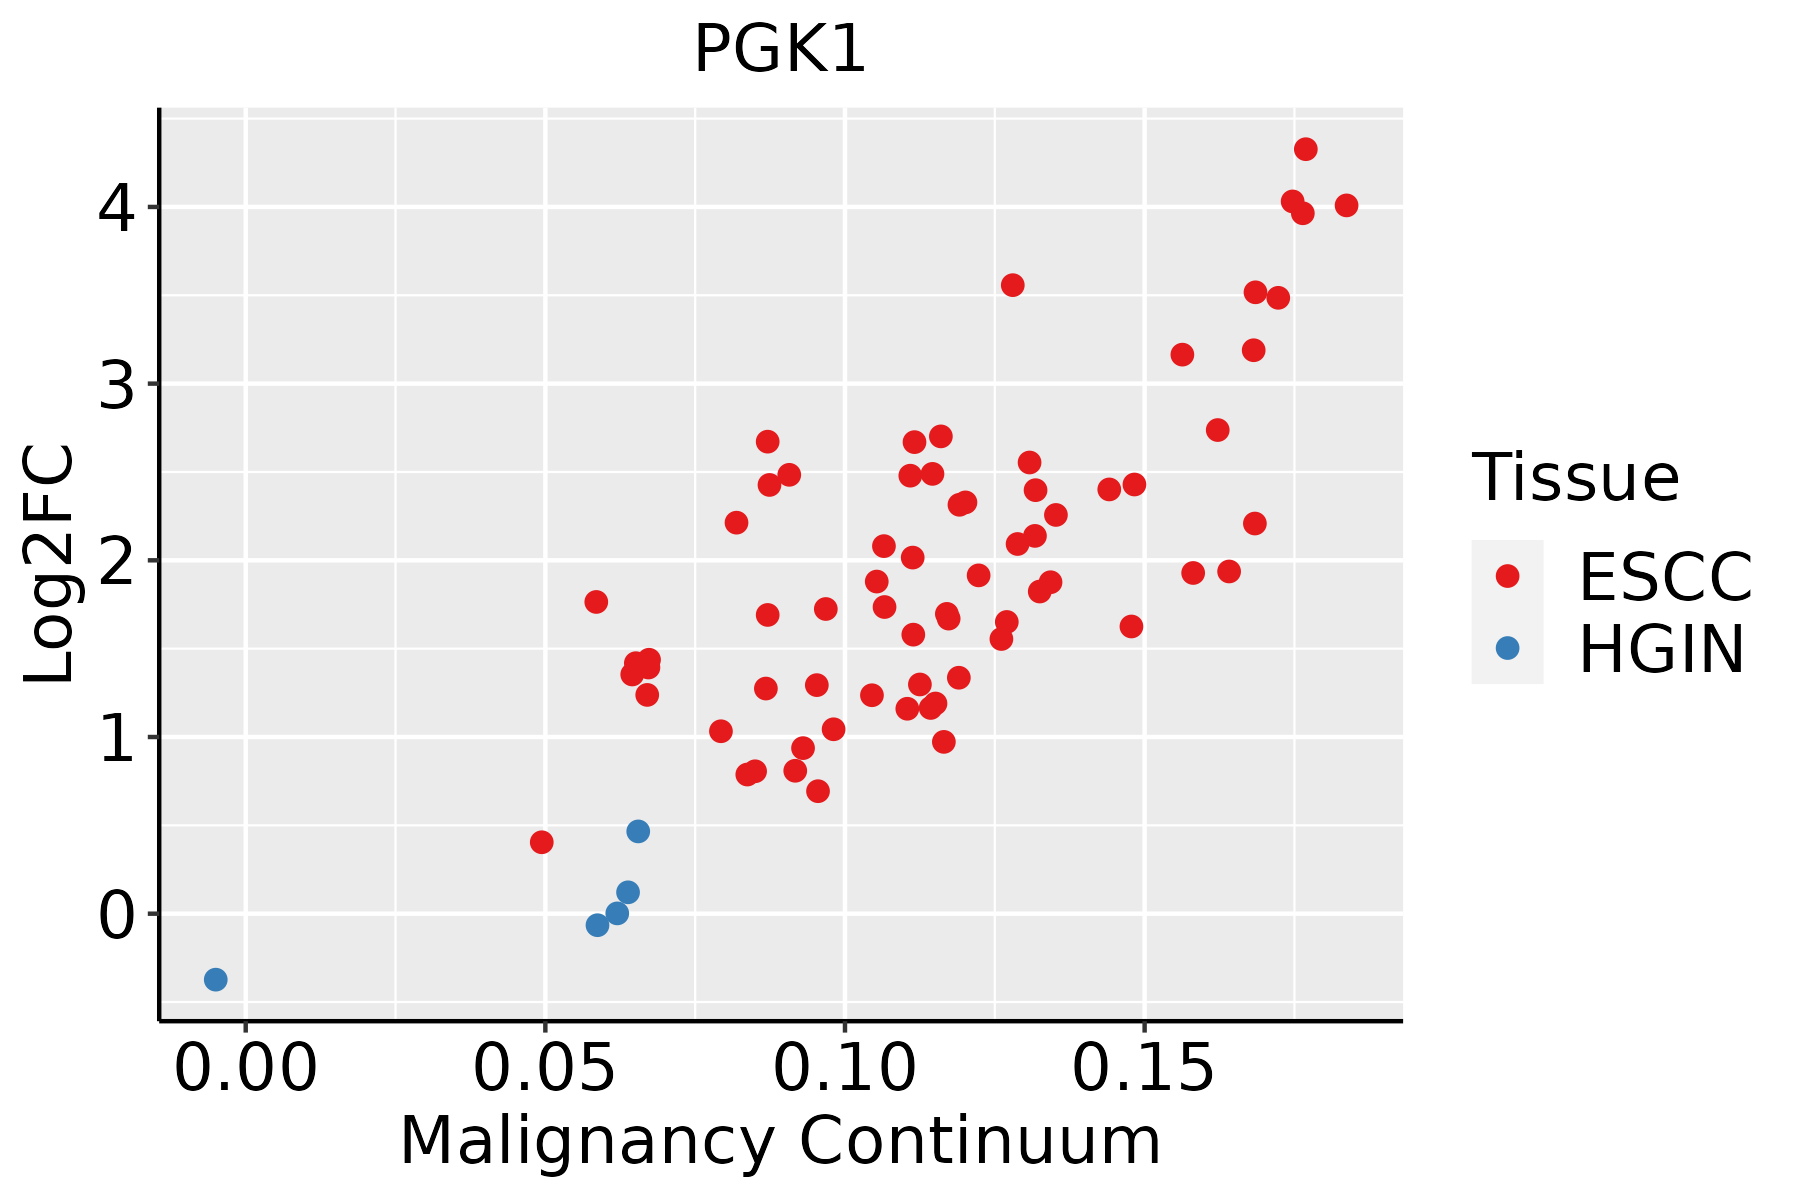 | ESCC: Esophageal squamous cell carcinoma |
| HGIN: High-grade intraepithelial neoplasias | ||
| LGIN: Low-grade intraepithelial neoplasias | ||
| GC | 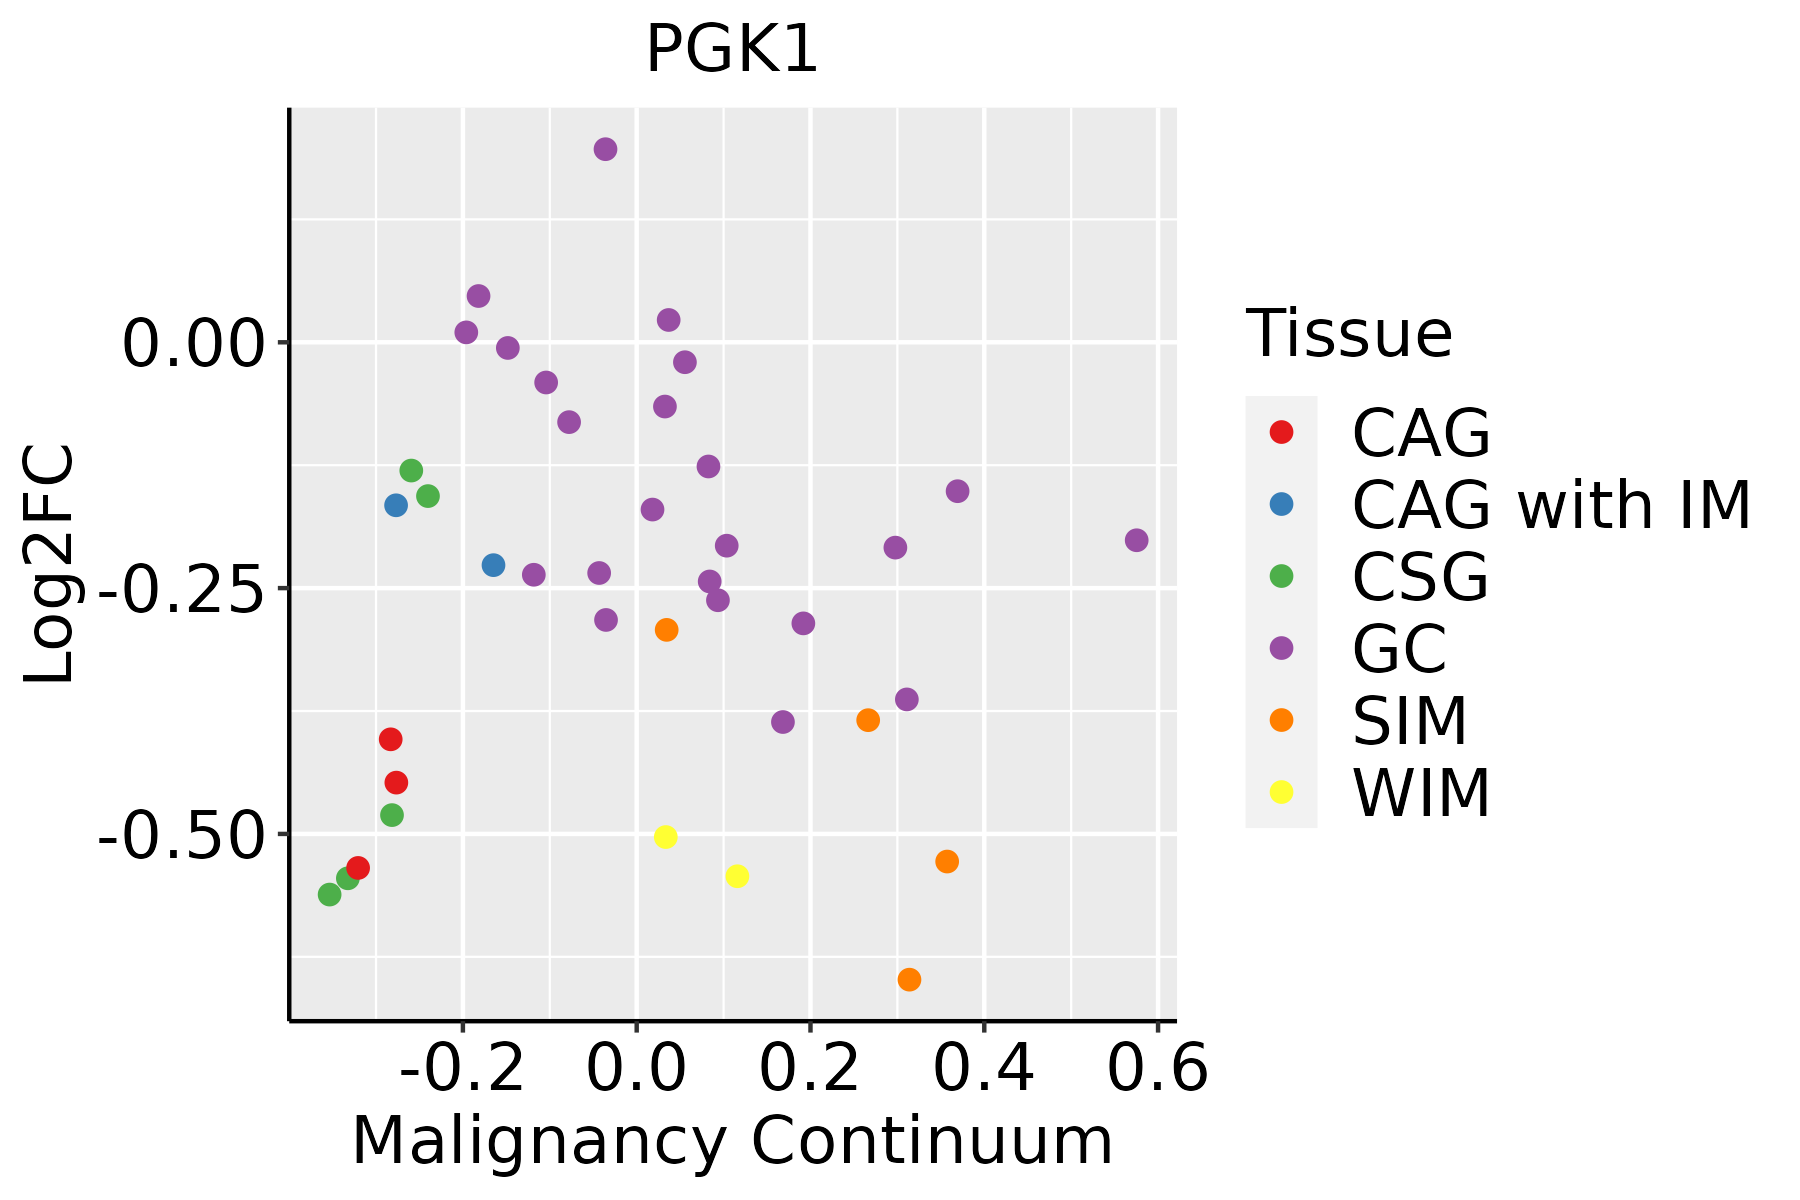 | CAG: Chronic atrophic gastritis |
| CAG with IM: Chronic atrophic gastritis with intestinal metaplasia | ||
| CSG: Chronic superficial gastritis | ||
| GC: Gastric cancer | ||
| SIM: Severe intestinal metaplasia | ||
| WIM: Wild intestinal metaplasia | ||
| Liver | 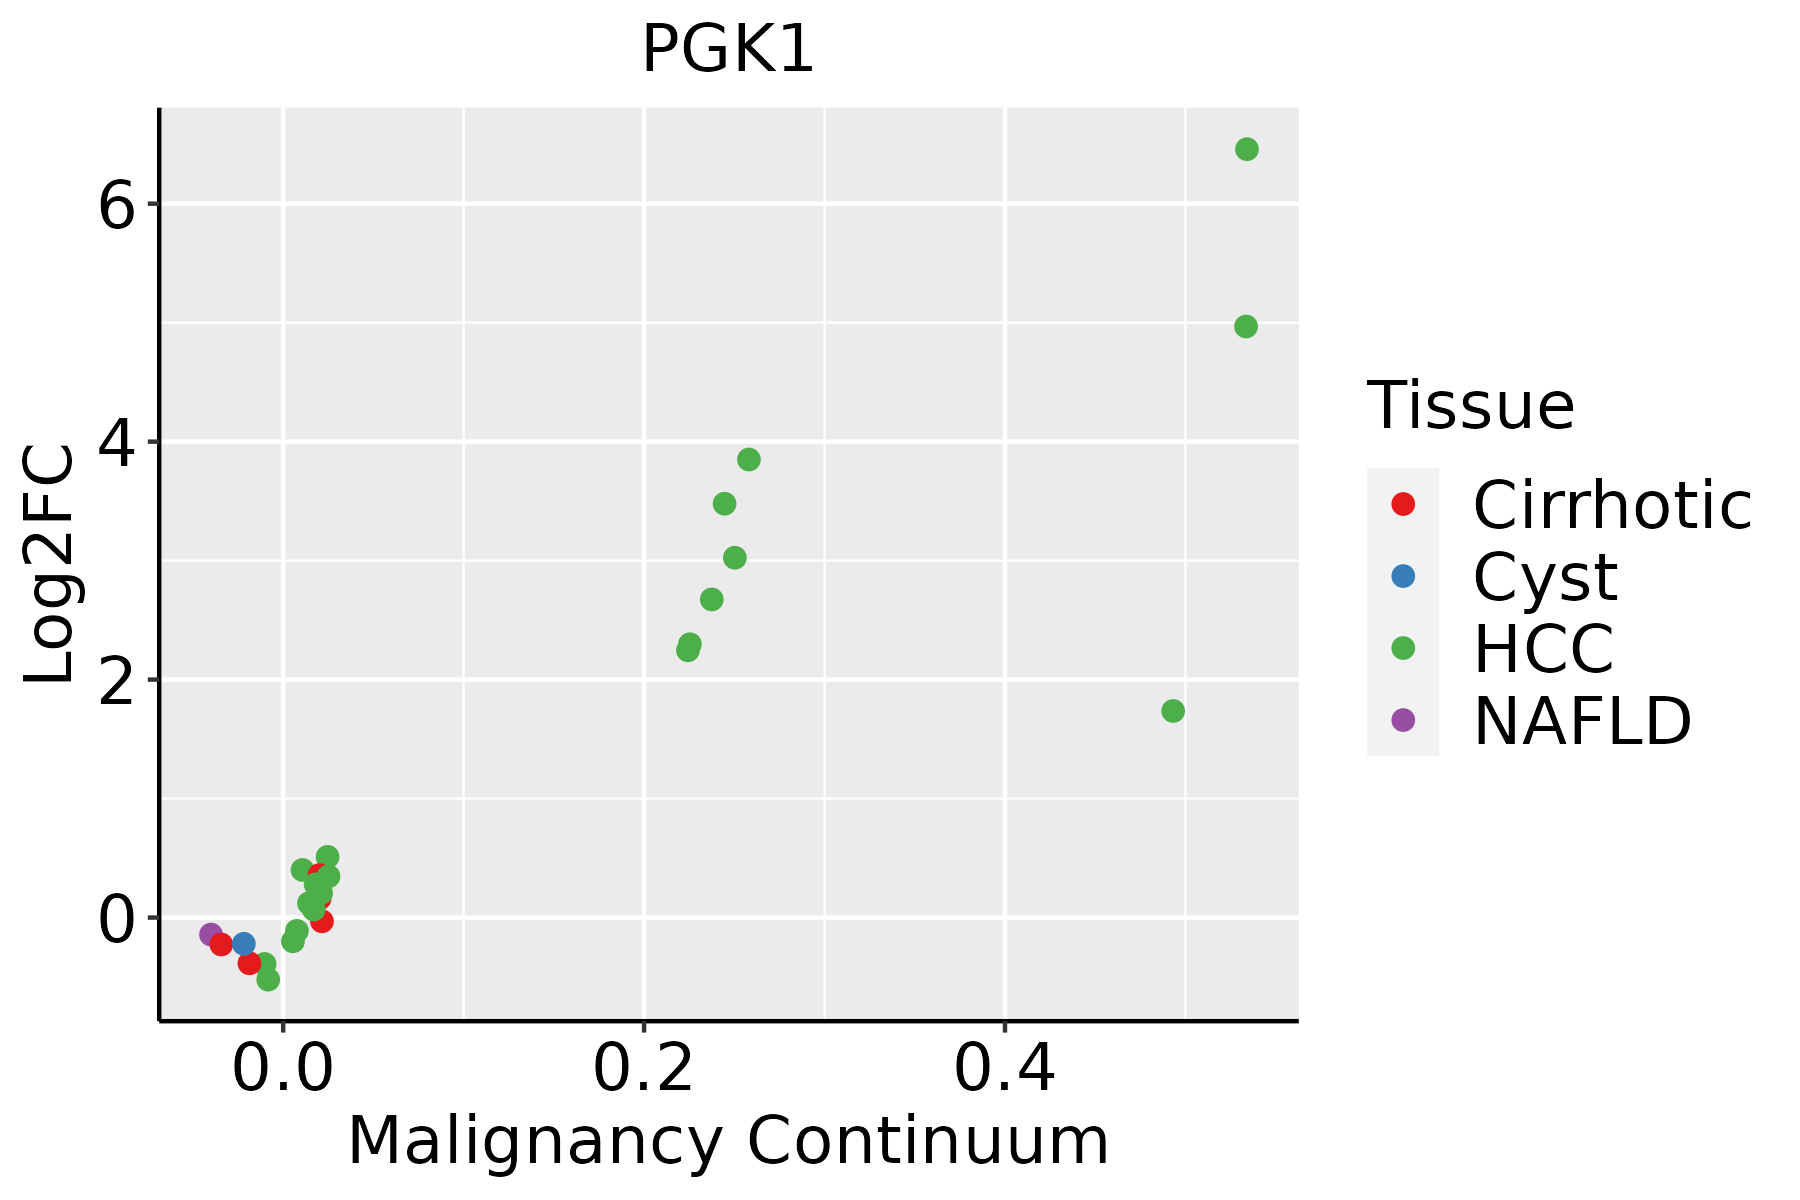 | HCC: Hepatocellular carcinoma |
| NAFLD: Non-alcoholic fatty liver disease | ||
| Oral Cavity |  | EOLP: Erosive Oral lichen planus |
| LP: leukoplakia | ||
| NEOLP: Non-erosive oral lichen planus | ||
| OSCC: Oral squamous cell carcinoma | ||
| Prostate | 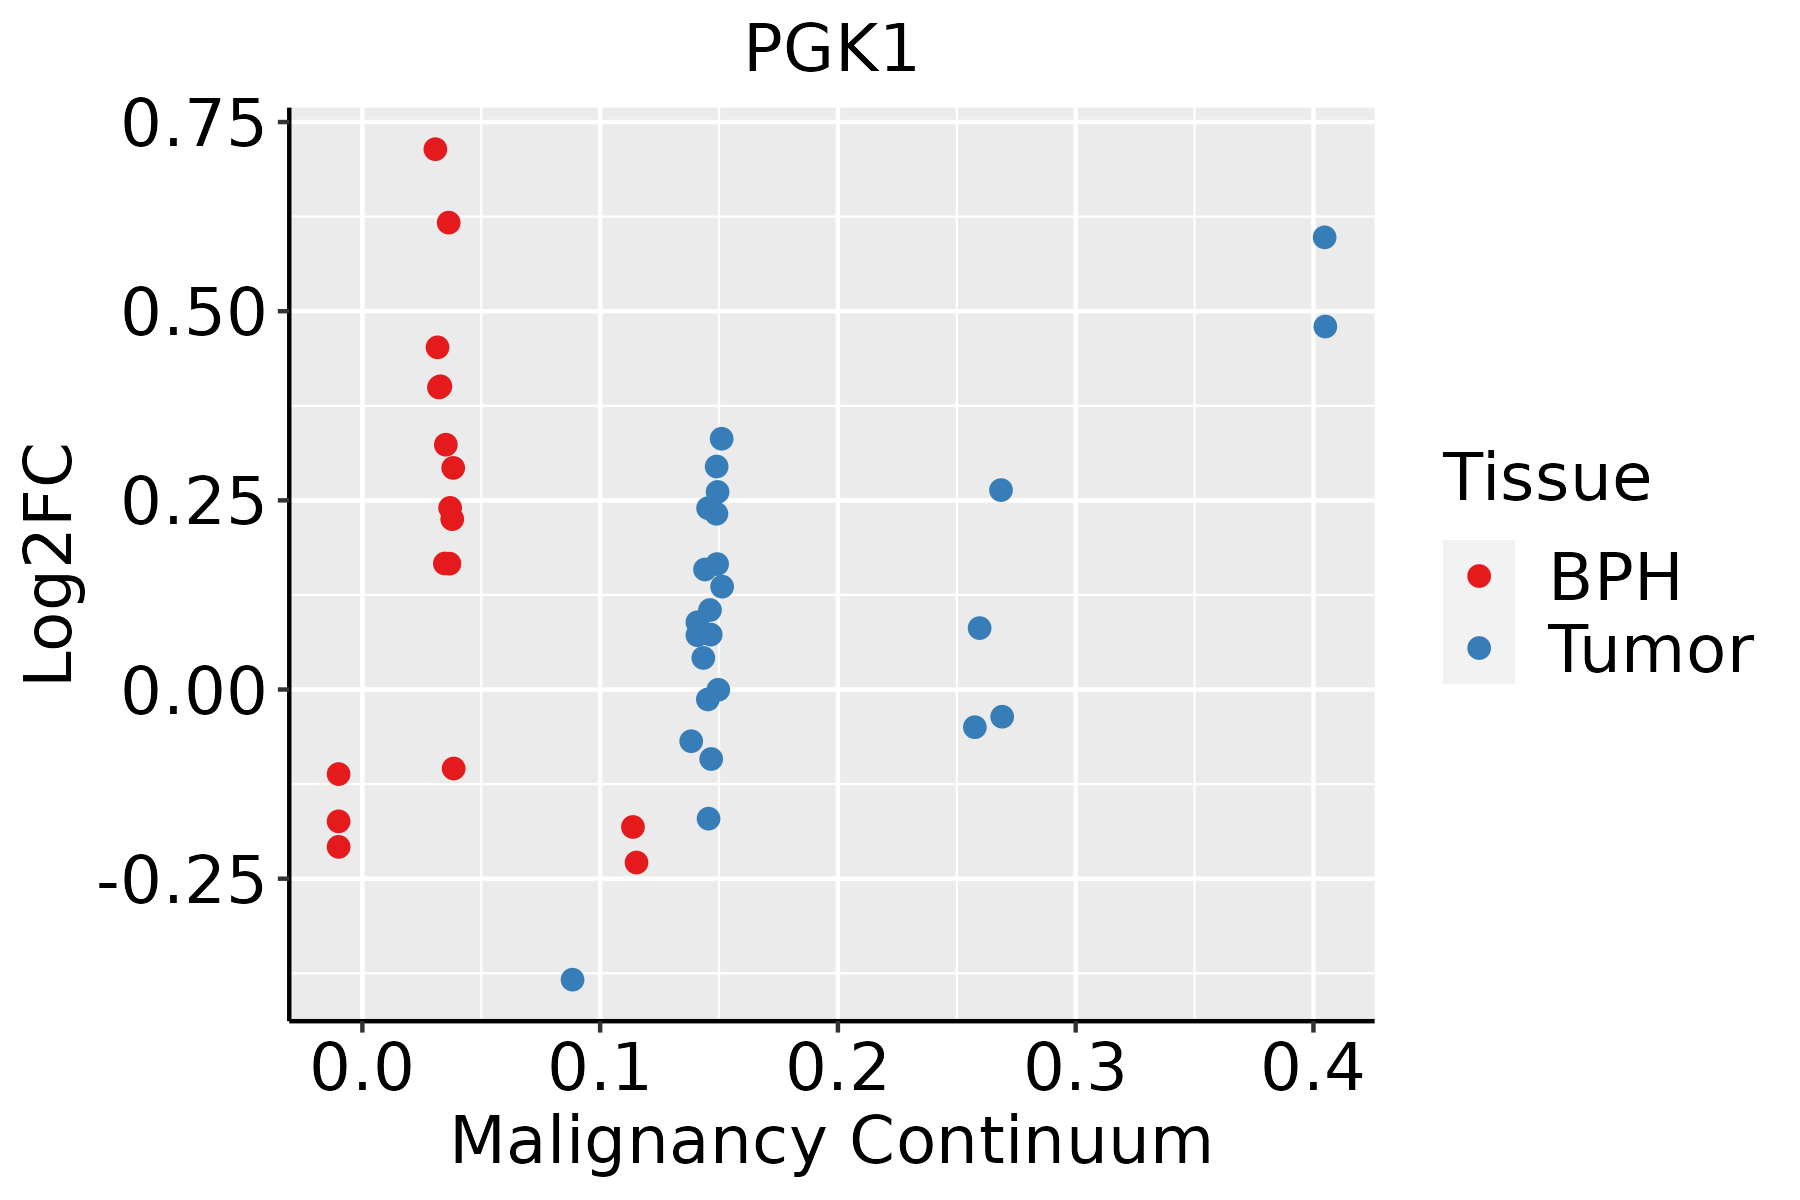 | BPH: Benign Prostatic Hyperplasia |
| Skin | 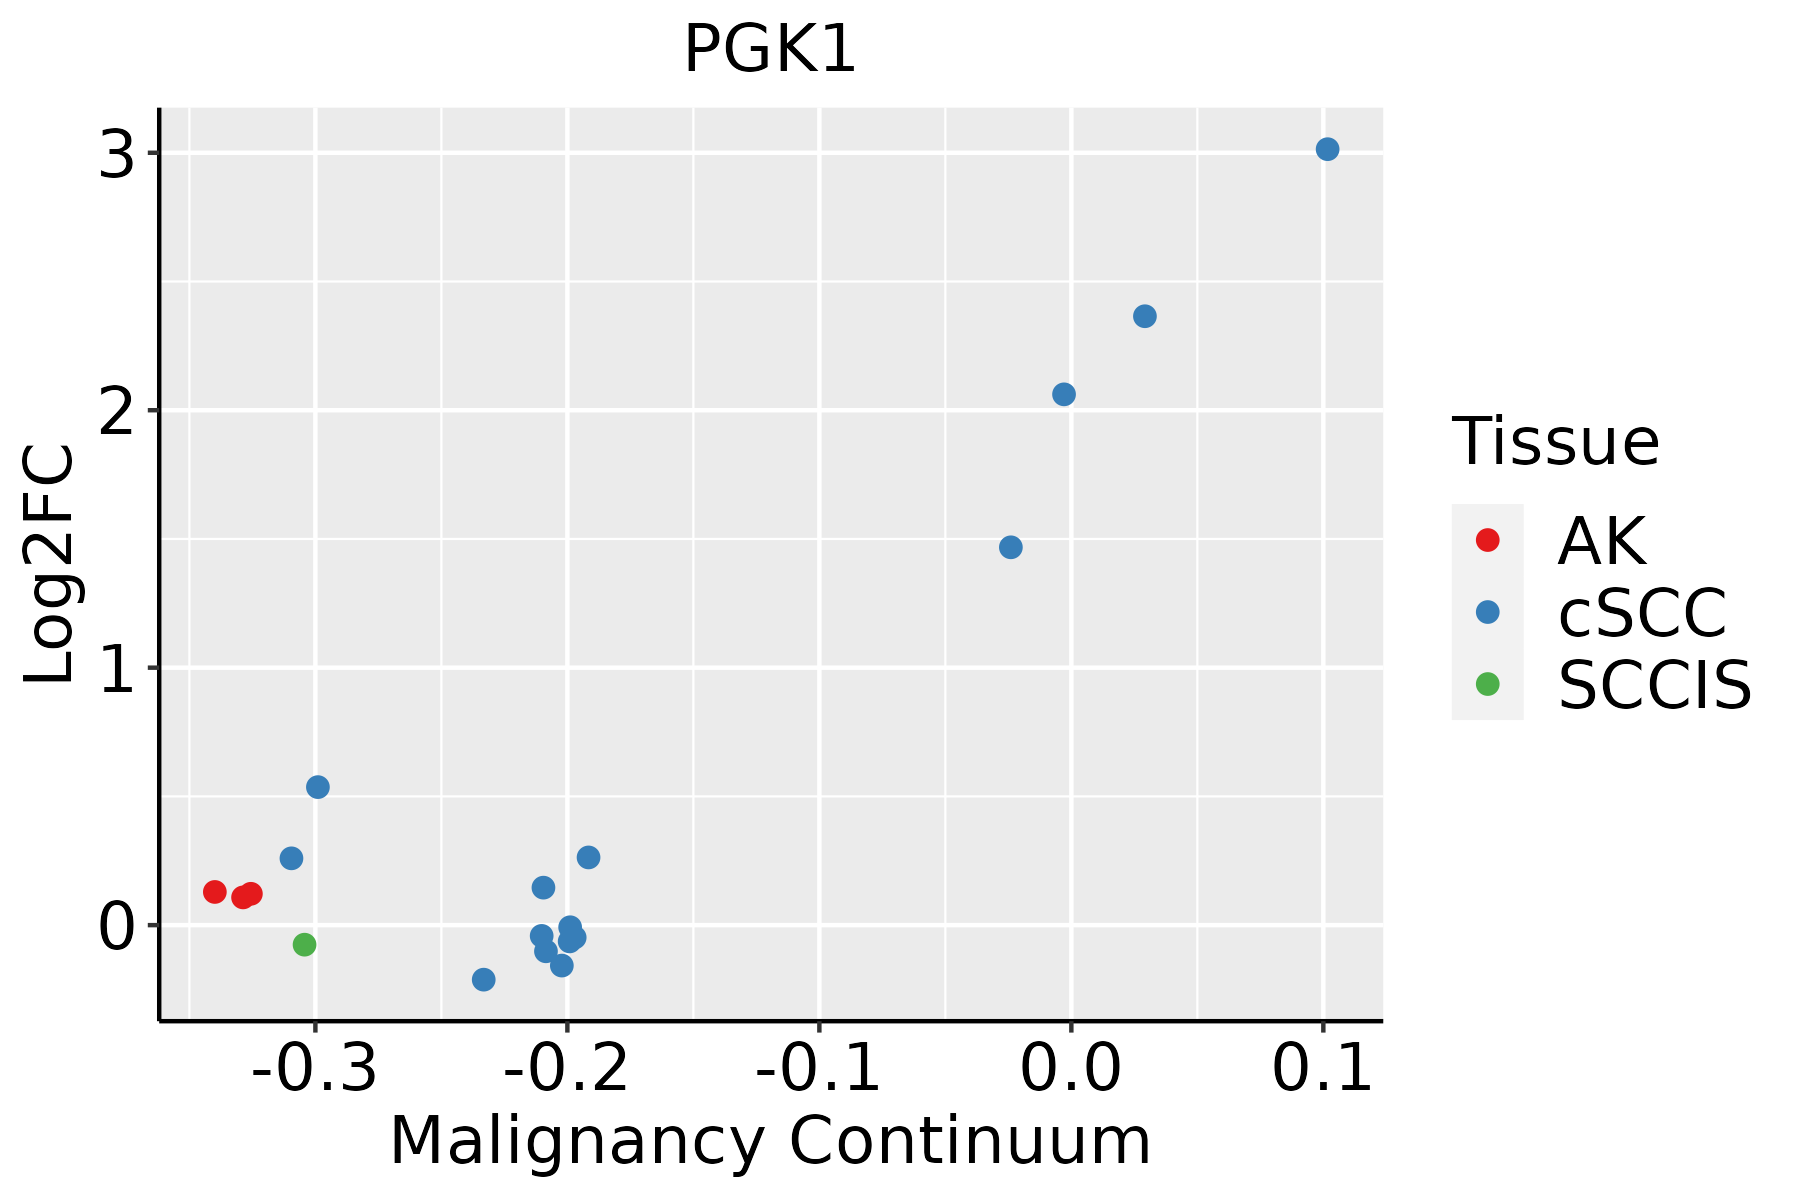 | AK: Actinic keratosis |
| cSCC: Cutaneous squamous cell carcinoma | ||
| SCCIS:squamous cell carcinoma in situ | ||
| Thyroid | 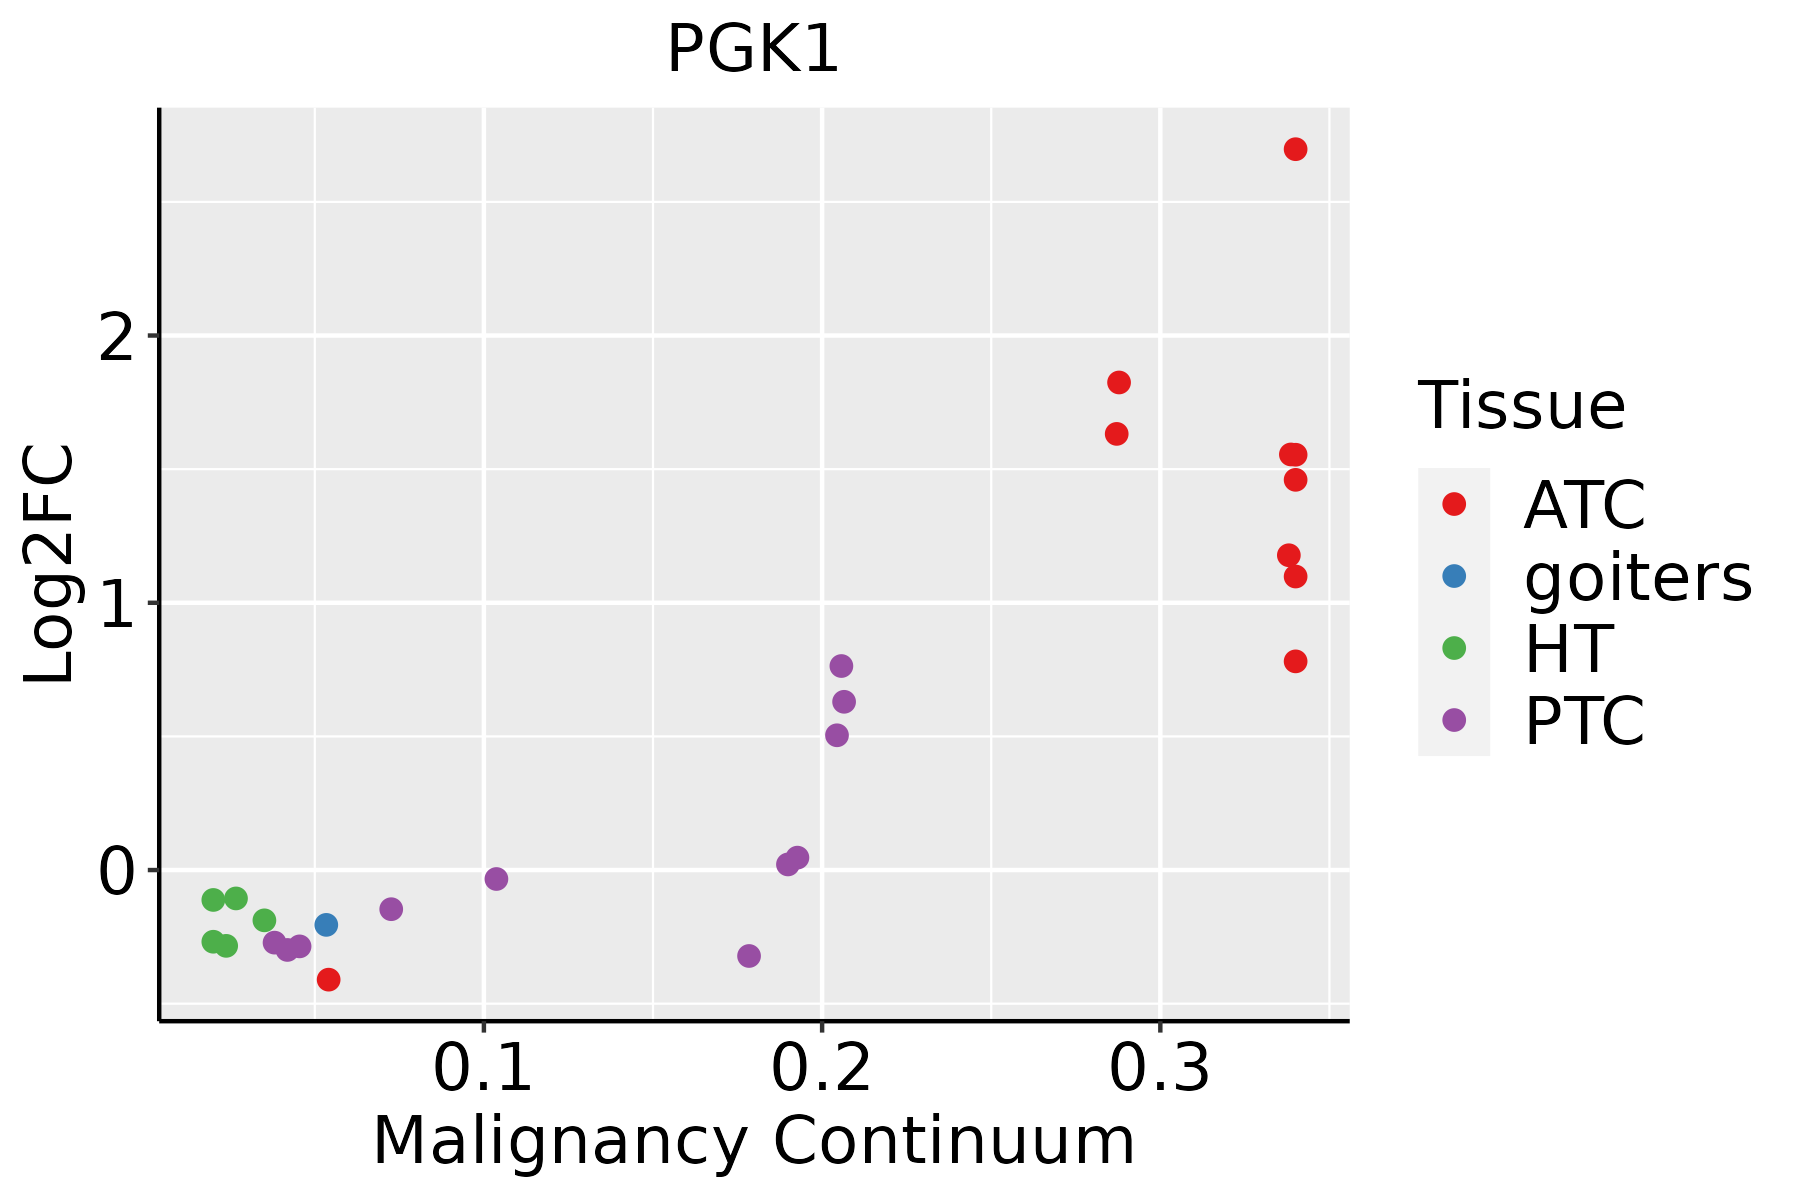 | ATC: Anaplastic thyroid cancer |
| HT: Hashimoto's thyroiditis | ||
| PTC: Papillary thyroid cancer |
| ∗log2FC in expression of this searched gene in stem-like cells from each diseased tissue sample relative to stem-like cells in normal samples in each tissue plotted against the malignancy continuum. Samples are colored based on if they are from different disease stage. |
Top |
Malignant transformation related pathway analysis |
| Find out the enriched GO biological processes and KEGG pathways involved in transition from healthy to precancer to cancer |
| Tissue | Disease Stage | Enriched GO biological Processes |
| Colorectum | AD |  |
| Colorectum | SER |  |
| Colorectum | MSS |  |
| Colorectum | MSI-H |  |
| Colorectum | FAP |  |
| ∗Top 15 enriched GO BP terms are showed in the bar plot of each disease state in each tissue. Each row represents a significant GO biological process which is colored according to the -log10(p.adjust). |
| Page: 1 2 3 4 5 6 7 8 9 |
| GO ID | Tissue | Disease Stage | Description | Gene Ratio | Bg Ratio | pvalue | p.adjust | Count |
| GO:00460349 | Breast | Precancer | ATP metabolic process | 82/1080 | 277/18723 | 1.94e-36 | 5.19e-33 | 82 |
| GO:00060918 | Breast | Precancer | generation of precursor metabolites and energy | 94/1080 | 490/18723 | 1.54e-25 | 1.64e-22 | 94 |
| GO:00362939 | Breast | Precancer | response to decreased oxygen levels | 53/1080 | 322/18723 | 4.09e-12 | 6.84e-10 | 53 |
| GO:00016669 | Breast | Precancer | response to hypoxia | 51/1080 | 307/18723 | 7.33e-12 | 1.11e-09 | 51 |
| GO:00704829 | Breast | Precancer | response to oxygen levels | 55/1080 | 347/18723 | 7.47e-12 | 1.11e-09 | 55 |
| GO:00362948 | Breast | Precancer | cellular response to decreased oxygen levels | 31/1080 | 161/18723 | 2.61e-09 | 2.11e-07 | 31 |
| GO:00714538 | Breast | Precancer | cellular response to oxygen levels | 32/1080 | 177/18723 | 7.32e-09 | 5.52e-07 | 32 |
| GO:00714565 | Breast | Precancer | cellular response to hypoxia | 29/1080 | 151/18723 | 8.98e-09 | 6.50e-07 | 29 |
| GO:00196938 | Breast | Precancer | ribose phosphate metabolic process | 49/1080 | 396/18723 | 3.81e-07 | 1.78e-05 | 49 |
| GO:00091509 | Breast | Precancer | purine ribonucleotide metabolic process | 46/1080 | 368/18723 | 6.47e-07 | 2.71e-05 | 46 |
| GO:00091179 | Breast | Precancer | nucleotide metabolic process | 56/1080 | 489/18723 | 7.40e-07 | 3.00e-05 | 56 |
| GO:00092598 | Breast | Precancer | ribonucleotide metabolic process | 47/1080 | 385/18723 | 9.69e-07 | 3.84e-05 | 47 |
| GO:00469398 | Breast | Precancer | nucleotide phosphorylation | 20/1080 | 101/18723 | 1.07e-06 | 4.18e-05 | 20 |
| GO:00067539 | Breast | Precancer | nucleoside phosphate metabolic process | 56/1080 | 497/18723 | 1.24e-06 | 4.70e-05 | 56 |
| GO:00061639 | Breast | Precancer | purine nucleotide metabolic process | 47/1080 | 396/18723 | 2.14e-06 | 7.50e-05 | 47 |
| GO:00091858 | Breast | Precancer | ribonucleoside diphosphate metabolic process | 20/1080 | 106/18723 | 2.37e-06 | 8.17e-05 | 20 |
| GO:00060968 | Breast | Precancer | glycolytic process | 17/1080 | 81/18723 | 2.94e-06 | 9.73e-05 | 17 |
| GO:00061658 | Breast | Precancer | nucleoside diphosphate phosphorylation | 19/1080 | 99/18723 | 3.23e-06 | 1.05e-04 | 19 |
| GO:00067578 | Breast | Precancer | ATP generation from ADP | 17/1080 | 82/18723 | 3.52e-06 | 1.13e-04 | 17 |
| GO:00091328 | Breast | Precancer | nucleoside diphosphate metabolic process | 21/1080 | 124/18723 | 7.98e-06 | 2.17e-04 | 21 |
| Page: 1 2 3 4 5 6 7 8 9 10 11 12 13 14 15 16 17 18 19 20 21 22 23 24 25 26 27 28 29 30 31 32 33 34 35 36 37 38 39 |
| Pathway ID | Tissue | Disease Stage | Description | Gene Ratio | Bg Ratio | pvalue | p.adjust | qvalue | Count |
| hsa0406616 | Breast | Precancer | HIF-1 signaling pathway | 23/684 | 109/8465 | 1.51e-05 | 1.59e-04 | 1.22e-04 | 23 |
| hsa0001010 | Breast | Precancer | Glycolysis / Gluconeogenesis | 13/684 | 67/8465 | 2.39e-03 | 1.51e-02 | 1.16e-02 | 13 |
| hsa0120012 | Breast | Precancer | Carbon metabolism | 18/684 | 115/8465 | 4.79e-03 | 2.75e-02 | 2.11e-02 | 18 |
| hsa0406617 | Breast | Precancer | HIF-1 signaling pathway | 23/684 | 109/8465 | 1.51e-05 | 1.59e-04 | 1.22e-04 | 23 |
| hsa0001013 | Breast | Precancer | Glycolysis / Gluconeogenesis | 13/684 | 67/8465 | 2.39e-03 | 1.51e-02 | 1.16e-02 | 13 |
| hsa0120013 | Breast | Precancer | Carbon metabolism | 18/684 | 115/8465 | 4.79e-03 | 2.75e-02 | 2.11e-02 | 18 |
| hsa0406623 | Breast | IDC | HIF-1 signaling pathway | 22/867 | 109/8465 | 1.36e-03 | 1.00e-02 | 7.50e-03 | 22 |
| hsa0406633 | Breast | IDC | HIF-1 signaling pathway | 22/867 | 109/8465 | 1.36e-03 | 1.00e-02 | 7.50e-03 | 22 |
| hsa0406642 | Breast | DCIS | HIF-1 signaling pathway | 22/846 | 109/8465 | 9.83e-04 | 7.05e-03 | 5.20e-03 | 22 |
| hsa0406652 | Breast | DCIS | HIF-1 signaling pathway | 22/846 | 109/8465 | 9.83e-04 | 7.05e-03 | 5.20e-03 | 22 |
| hsa0406618 | Cervix | CC | HIF-1 signaling pathway | 27/1267 | 109/8465 | 4.72e-03 | 1.64e-02 | 9.72e-03 | 27 |
| hsa0406619 | Cervix | CC | HIF-1 signaling pathway | 27/1267 | 109/8465 | 4.72e-03 | 1.64e-02 | 9.72e-03 | 27 |
| hsa01200 | Colorectum | AD | Carbon metabolism | 55/2092 | 115/8465 | 5.53e-08 | 8.42e-07 | 5.37e-07 | 55 |
| hsa00010 | Colorectum | AD | Glycolysis / Gluconeogenesis | 34/2092 | 67/8465 | 3.63e-06 | 4.34e-05 | 2.77e-05 | 34 |
| hsa04066 | Colorectum | AD | HIF-1 signaling pathway | 48/2092 | 109/8465 | 7.25e-06 | 7.84e-05 | 5.00e-05 | 48 |
| hsa01230 | Colorectum | AD | Biosynthesis of amino acids | 28/2092 | 75/8465 | 9.99e-03 | 3.89e-02 | 2.48e-02 | 28 |
| hsa012001 | Colorectum | AD | Carbon metabolism | 55/2092 | 115/8465 | 5.53e-08 | 8.42e-07 | 5.37e-07 | 55 |
| hsa000101 | Colorectum | AD | Glycolysis / Gluconeogenesis | 34/2092 | 67/8465 | 3.63e-06 | 4.34e-05 | 2.77e-05 | 34 |
| hsa040661 | Colorectum | AD | HIF-1 signaling pathway | 48/2092 | 109/8465 | 7.25e-06 | 7.84e-05 | 5.00e-05 | 48 |
| hsa012301 | Colorectum | AD | Biosynthesis of amino acids | 28/2092 | 75/8465 | 9.99e-03 | 3.89e-02 | 2.48e-02 | 28 |
| Page: 1 2 3 4 5 6 |
Top |
Cell-cell communication analysis |
| Identification of potential cell-cell interactions between two cell types and their ligand-receptor pairs for different disease states |
| Ligand | Receptor | LRpair | Pathway | Tissue | Disease Stage |
| Page: 1 |
Top |
Single-cell gene regulatory network inference analysis |
| Find out the significant the regulons (TFs) and the target genes of each regulon across cell types for different disease states |
| TF | Cell Type | Tissue | Disease Stage | Target Gene | RSS | Regulon Activity |
| ∗The dot plots of a searched regulon are shown for all cell subpopulations in each disease state of each tissue based on the regulon specific score inferred using pySCENIC and by calculating the average expression. |
| Page: 1 |
Top |
Somatic mutation of malignant transformation related genes |
| Annotation of somatic variants for genes involved in malignant transformation |
| Hugo Symbol | Variant Class | Variant Classification | dbSNP RS | HGVSc | HGVSp | HGVSp Short | SWISSPROT | BIOTYPE | SIFT | PolyPhen | Tumor Sample Barcode | Tissue | Histology | Sex | Age | Stage | Therapy Types | Drugs | Outcome |
| PGK1 | SNV | Missense_Mutation | c.570N>A | p.Met190Ile | p.M190I | P00558 | protein_coding | tolerated(0.07) | benign(0.384) | TCGA-A8-A09N-01 | Breast | breast invasive carcinoma | Female | <65 | III/IV | Unknown | Unknown | SD | |
| PGK1 | SNV | Missense_Mutation | c.877N>C | p.Asp293His | p.D293H | P00558 | protein_coding | deleterious(0.01) | possibly_damaging(0.704) | TCGA-AC-A23H-01 | Breast | breast invasive carcinoma | Female | >=65 | I/II | Unknown | Unknown | PD | |
| PGK1 | SNV | Missense_Mutation | novel | c.11N>G | p.Ser4Cys | p.S4C | P00558 | protein_coding | deleterious(0.01) | possibly_damaging(0.594) | TCGA-BH-A0B6-01 | Breast | breast invasive carcinoma | Female | <65 | I/II | Unknown | Unknown | SD |
| PGK1 | SNV | Missense_Mutation | c.599C>T | p.Ala200Val | p.A200V | P00558 | protein_coding | tolerated(0.21) | benign(0.173) | TCGA-BH-A0HF-01 | Breast | breast invasive carcinoma | Female | >=65 | I/II | Hormone Therapy | arimidex | SD | |
| PGK1 | SNV | Missense_Mutation | c.725T>C | p.Phe242Ser | p.F242S | P00558 | protein_coding | deleterious(0.01) | possibly_damaging(0.452) | TCGA-D8-A27T-01 | Breast | breast invasive carcinoma | Female | <65 | III/IV | Chemotherapy | doxorubicine+cyclophosphamide | SD | |
| PGK1 | SNV | Missense_Mutation | novel | c.388N>T | p.Gly130Trp | p.G130W | P00558 | protein_coding | deleterious(0) | probably_damaging(1) | TCGA-VS-A94Z-01 | Cervix | cervical & endocervical cancer | Female | <65 | I/II | Chemotherapy | cisplatin | CR |
| PGK1 | SNV | Missense_Mutation | rs141397576 | c.107A>C | p.Asn36Thr | p.N36T | P00558 | protein_coding | deleterious(0.03) | possibly_damaging(0.907) | TCGA-AA-3975-01 | Colorectum | colon adenocarcinoma | Male | >=65 | I/II | Unknown | Unknown | SD |
| PGK1 | SNV | Missense_Mutation | c.802N>T | p.Asp268Tyr | p.D268Y | P00558 | protein_coding | deleterious(0) | possibly_damaging(0.598) | TCGA-AA-3984-01 | Colorectum | colon adenocarcinoma | Female | <65 | I/II | Unknown | Unknown | SD | |
| PGK1 | SNV | Missense_Mutation | novel | c.365N>C | p.Leu122Pro | p.L122P | P00558 | protein_coding | deleterious(0) | probably_damaging(0.997) | TCGA-AZ-6605-01 | Colorectum | colon adenocarcinoma | Male | >=65 | III/IV | Chemotherapy | folfox | SD |
| PGK1 | SNV | Missense_Mutation | c.1061N>T | p.Ala354Val | p.A354V | P00558 | protein_coding | deleterious(0.03) | benign(0.003) | TCGA-CK-4951-01 | Colorectum | colon adenocarcinoma | Female | >=65 | I/II | Unknown | Unknown | PD |
| Page: 1 2 3 4 5 |
Top |
Related drugs of malignant transformation related genes |
| Identification of chemicals and drugs interact with genes involved in malignant transfromation |
| (DGIdb 4.0) |
| Entrez ID | Symbol | Category | Interaction Types | Drug Claim Name | Drug Name | PMIDs |
| 5230 | PGK1 | ENZYME, KINASE | lamivudine | LAMIVUDINE |
| Page: 1 |

Copyright 2023-Present -The University of Texas Health Science Center at Houston |