
|
|||||
|
 | |
| |
| |
| |
| |
| |
|
Gene: PGF |
Gene summary for PGF |
| Gene information | Species | Human | Gene symbol | PGF | Gene ID | 5228 |
| Gene name | placental growth factor | |
| Gene Alias | D12S1900 | |
| Cytomap | 14q24.3 | |
| Gene Type | protein-coding | GO ID | GO:0000003 | UniProtAcc | P49763 |
Top |
Malignant transformation analysis |
| Identification of the aberrant gene expression in precancerous and cancerous lesions by comparing the gene expression of stem-like cells in diseased tissues with normal stem cells |
| Entrez ID | Symbol | Replicates | Species | Organ | Tissue | Adj P-value | Log2FC | Malignancy |
| 5228 | PGF | LZE4T | Human | Esophagus | ESCC | 2.82e-18 | 9.12e-01 | 0.0811 |
| 5228 | PGF | LZE8T | Human | Esophagus | ESCC | 1.10e-09 | 1.65e-01 | 0.067 |
| 5228 | PGF | LZE24T | Human | Esophagus | ESCC | 1.21e-03 | 1.72e-02 | 0.0596 |
| 5228 | PGF | LZE6T | Human | Esophagus | ESCC | 3.20e-04 | 2.43e-01 | 0.0845 |
| 5228 | PGF | P2T-E | Human | Esophagus | ESCC | 6.93e-11 | 4.09e-01 | 0.1177 |
| 5228 | PGF | P4T-E | Human | Esophagus | ESCC | 6.04e-20 | 6.70e-01 | 0.1323 |
| 5228 | PGF | P5T-E | Human | Esophagus | ESCC | 1.51e-49 | 1.23e+00 | 0.1327 |
| 5228 | PGF | P8T-E | Human | Esophagus | ESCC | 6.79e-03 | 5.73e-02 | 0.0889 |
| 5228 | PGF | P10T-E | Human | Esophagus | ESCC | 1.47e-12 | 7.76e-01 | 0.116 |
| 5228 | PGF | P11T-E | Human | Esophagus | ESCC | 6.99e-05 | 7.54e-01 | 0.1426 |
| 5228 | PGF | P15T-E | Human | Esophagus | ESCC | 9.83e-23 | 1.13e+00 | 0.1149 |
| 5228 | PGF | P16T-E | Human | Esophagus | ESCC | 2.34e-11 | 4.53e-01 | 0.1153 |
| 5228 | PGF | P17T-E | Human | Esophagus | ESCC | 2.87e-03 | 4.24e-01 | 0.1278 |
| 5228 | PGF | P19T-E | Human | Esophagus | ESCC | 2.86e-02 | 1.09e+00 | 0.1662 |
| 5228 | PGF | P20T-E | Human | Esophagus | ESCC | 4.19e-04 | 9.87e-03 | 0.1124 |
| 5228 | PGF | P21T-E | Human | Esophagus | ESCC | 1.60e-09 | 2.77e-01 | 0.1617 |
| 5228 | PGF | P22T-E | Human | Esophagus | ESCC | 3.81e-11 | 1.84e-01 | 0.1236 |
| 5228 | PGF | P23T-E | Human | Esophagus | ESCC | 3.19e-07 | 5.99e-02 | 0.108 |
| 5228 | PGF | P26T-E | Human | Esophagus | ESCC | 9.94e-44 | 1.48e+00 | 0.1276 |
| 5228 | PGF | P27T-E | Human | Esophagus | ESCC | 7.04e-11 | 5.44e-01 | 0.1055 |
| Page: 1 2 3 4 |
| Tissue | Expression Dynamics | Abbreviation |
| Esophagus |  | ESCC: Esophageal squamous cell carcinoma |
| HGIN: High-grade intraepithelial neoplasias | ||
| LGIN: Low-grade intraepithelial neoplasias | ||
| Oral Cavity |  | EOLP: Erosive Oral lichen planus |
| LP: leukoplakia | ||
| NEOLP: Non-erosive oral lichen planus | ||
| OSCC: Oral squamous cell carcinoma | ||
| Skin | 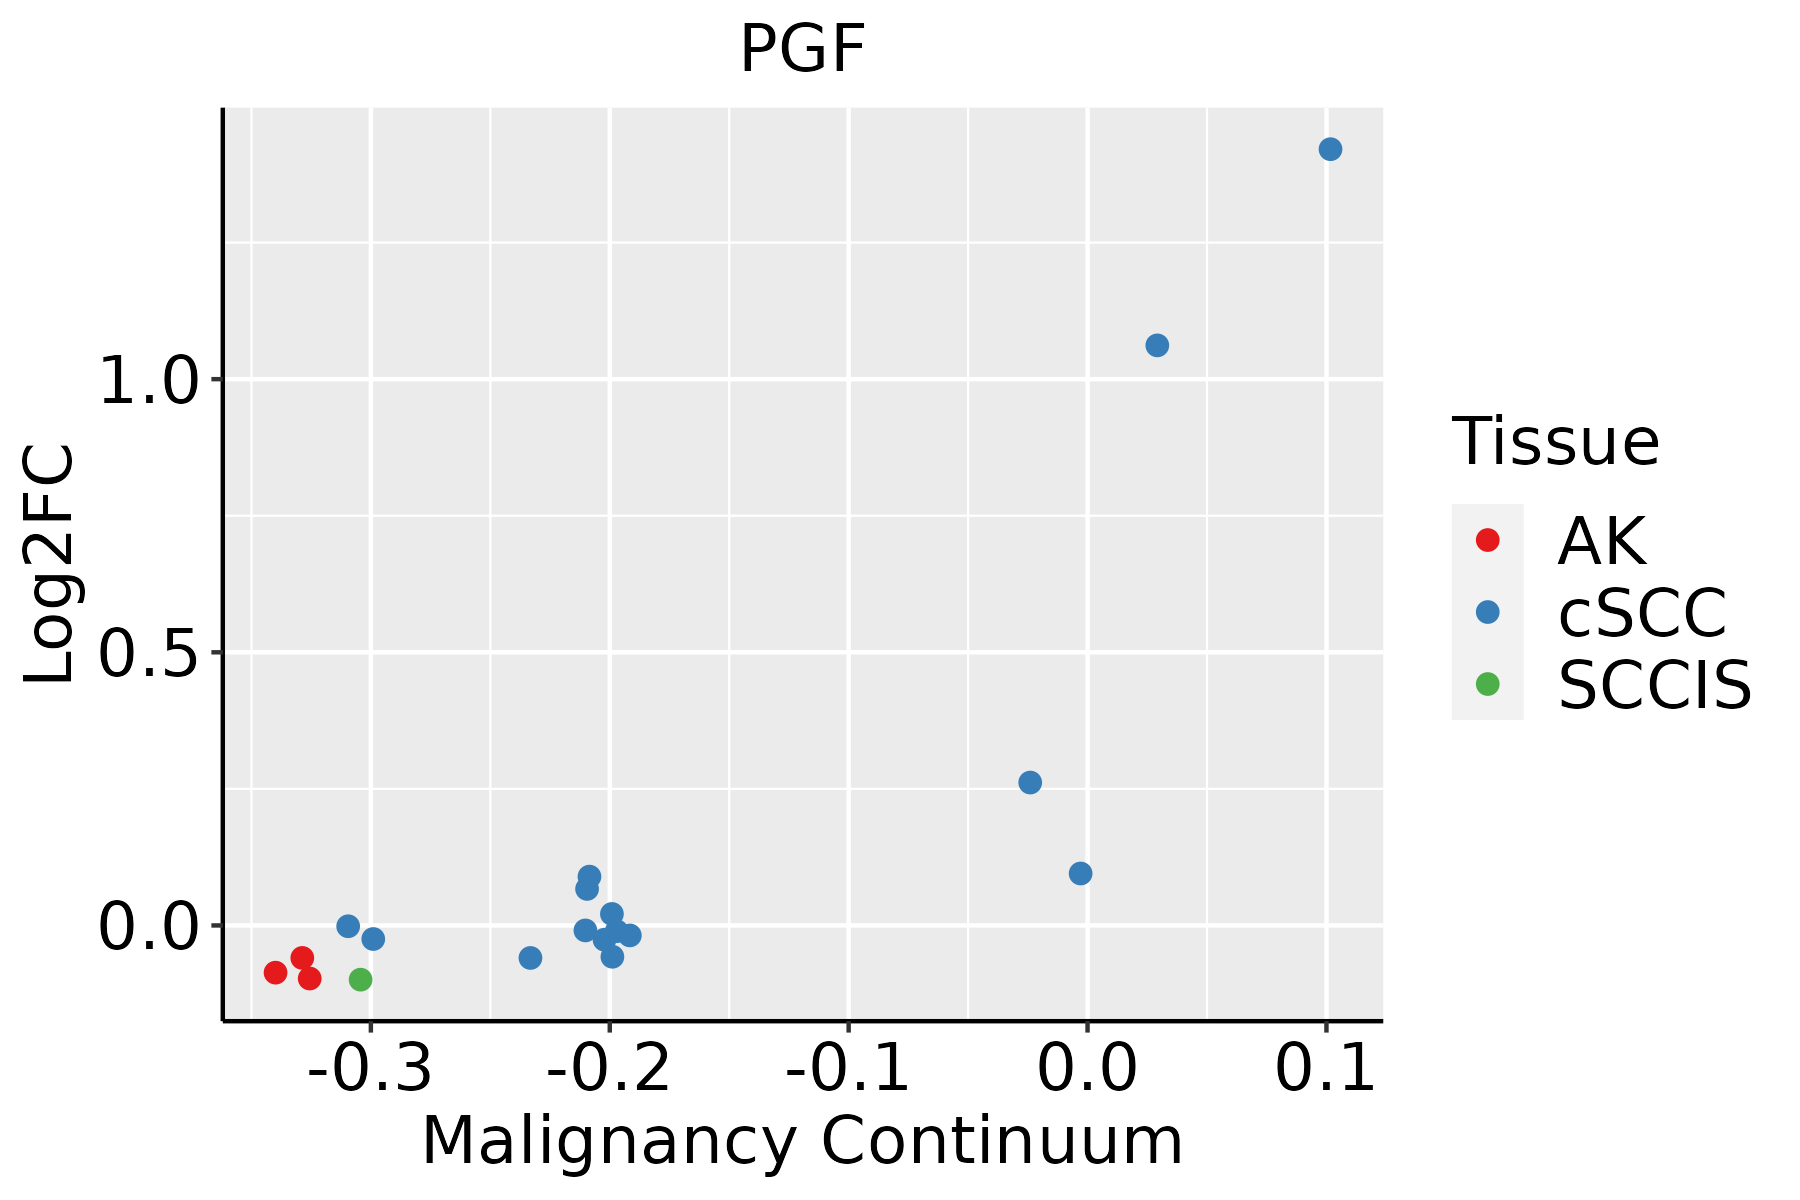 | AK: Actinic keratosis |
| cSCC: Cutaneous squamous cell carcinoma | ||
| SCCIS:squamous cell carcinoma in situ | ||
| Thyroid | 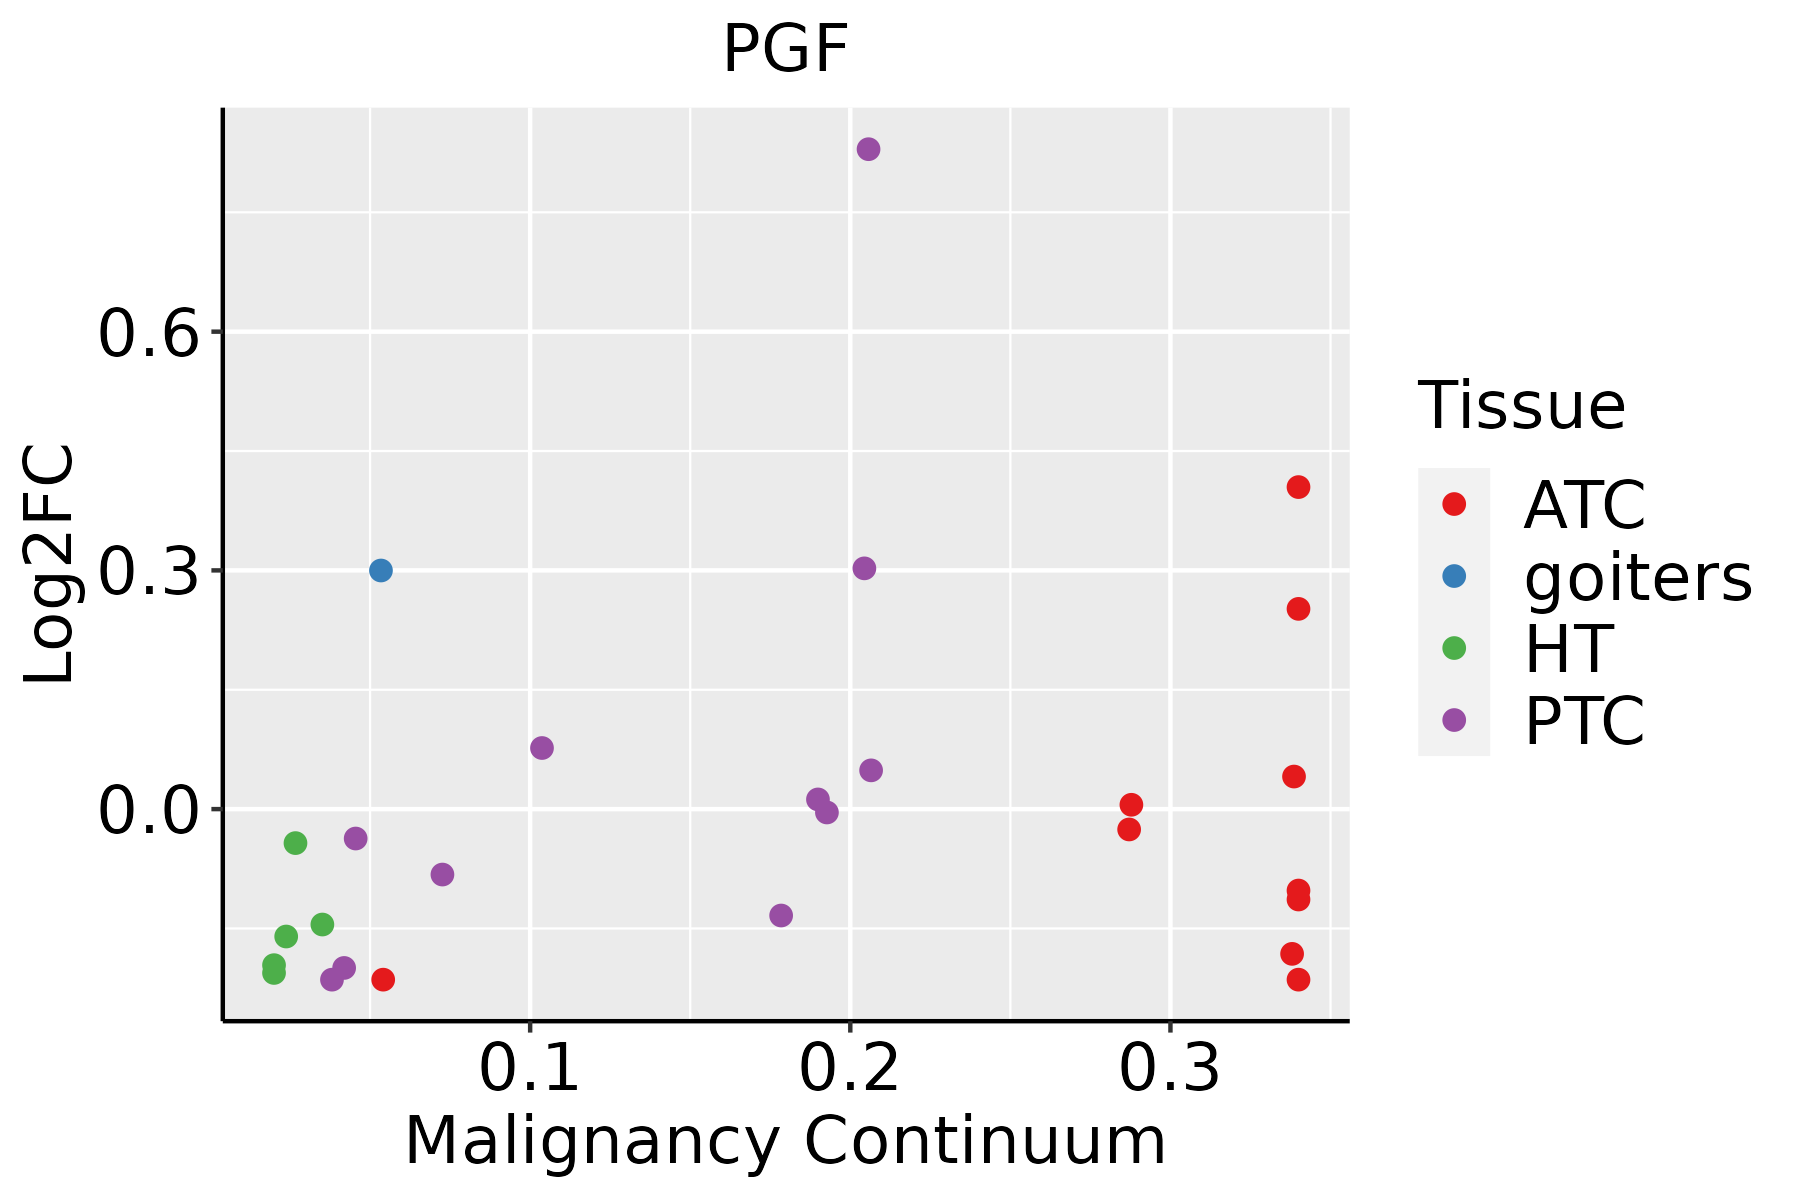 | ATC: Anaplastic thyroid cancer |
| HT: Hashimoto's thyroiditis | ||
| PTC: Papillary thyroid cancer |
| ∗log2FC in expression of this searched gene in stem-like cells from each diseased tissue sample relative to stem-like cells in normal samples in each tissue plotted against the malignancy continuum. Samples are colored based on if they are from different disease stage. |
Top |
Malignant transformation related pathway analysis |
| Find out the enriched GO biological processes and KEGG pathways involved in transition from healthy to precancer to cancer |
| Tissue | Disease Stage | Enriched GO biological Processes |
| Colorectum | AD |  |
| Colorectum | SER |  |
| Colorectum | MSS |  |
| Colorectum | MSI-H |  |
| Colorectum | FAP |  |
| ∗Top 15 enriched GO BP terms are showed in the bar plot of each disease state in each tissue. Each row represents a significant GO biological process which is colored according to the -log10(p.adjust). |
| Page: 1 2 3 4 5 6 7 8 9 |
| GO ID | Tissue | Disease Stage | Description | Gene Ratio | Bg Ratio | pvalue | p.adjust | Count |
| GO:0070482111 | Esophagus | ESCC | response to oxygen levels | 218/8552 | 347/18723 | 6.91e-11 | 2.17e-09 | 218 |
| GO:0036293111 | Esophagus | ESCC | response to decreased oxygen levels | 201/8552 | 322/18723 | 8.37e-10 | 2.04e-08 | 201 |
| GO:0001666111 | Esophagus | ESCC | response to hypoxia | 192/8552 | 307/18723 | 1.59e-09 | 3.69e-08 | 192 |
| GO:003109910 | Esophagus | ESCC | regeneration | 122/8552 | 198/18723 | 4.26e-06 | 4.57e-05 | 122 |
| GO:000941020 | Esophagus | ESCC | response to xenobiotic stimulus | 253/8552 | 462/18723 | 4.55e-05 | 3.58e-04 | 253 |
| GO:005067318 | Esophagus | ESCC | epithelial cell proliferation | 238/8552 | 437/18723 | 1.19e-04 | 8.20e-04 | 238 |
| GO:00311009 | Esophagus | ESCC | animal organ regeneration | 50/8552 | 76/18723 | 3.17e-04 | 1.88e-03 | 50 |
| GO:005067817 | Esophagus | ESCC | regulation of epithelial cell proliferation | 206/8552 | 381/18723 | 5.51e-04 | 3.02e-03 | 206 |
| GO:000268515 | Esophagus | ESCC | regulation of leukocyte migration | 114/8552 | 210/18723 | 7.26e-03 | 2.63e-02 | 114 |
| GO:00513025 | Esophagus | ESCC | regulation of cell division | 97/8552 | 177/18723 | 8.93e-03 | 3.12e-02 | 97 |
| GO:007048219 | Oral cavity | OSCC | response to oxygen levels | 200/7305 | 347/18723 | 1.17e-12 | 5.13e-11 | 200 |
| GO:000166619 | Oral cavity | OSCC | response to hypoxia | 177/7305 | 307/18723 | 2.21e-11 | 7.50e-10 | 177 |
| GO:003629319 | Oral cavity | OSCC | response to decreased oxygen levels | 182/7305 | 322/18723 | 1.14e-10 | 3.41e-09 | 182 |
| GO:00310999 | Oral cavity | OSCC | regeneration | 114/7305 | 198/18723 | 8.54e-08 | 1.50e-06 | 114 |
| GO:000268714 | Oral cavity | OSCC | positive regulation of leukocyte migration | 78/7305 | 135/18723 | 7.43e-06 | 8.08e-05 | 78 |
| GO:005067310 | Oral cavity | OSCC | epithelial cell proliferation | 212/7305 | 437/18723 | 2.82e-05 | 2.61e-04 | 212 |
| GO:000941018 | Oral cavity | OSCC | response to xenobiotic stimulus | 222/7305 | 462/18723 | 4.00e-05 | 3.48e-04 | 222 |
| GO:000268510 | Oral cavity | OSCC | regulation of leukocyte migration | 108/7305 | 210/18723 | 1.63e-04 | 1.13e-03 | 108 |
| GO:00321037 | Oral cavity | OSCC | positive regulation of response to external stimulus | 203/7305 | 427/18723 | 1.79e-04 | 1.22e-03 | 203 |
| GO:00509216 | Oral cavity | OSCC | positive regulation of chemotaxis | 76/7305 | 141/18723 | 2.30e-04 | 1.49e-03 | 76 |
| Page: 1 2 3 4 5 6 |
| Pathway ID | Tissue | Disease Stage | Description | Gene Ratio | Bg Ratio | pvalue | p.adjust | qvalue | Count |
| hsa0451020 | Esophagus | ESCC | Focal adhesion | 127/4205 | 203/8465 | 1.25e-04 | 4.99e-04 | 2.56e-04 | 127 |
| hsa041517 | Esophagus | ESCC | PI3K-Akt signaling pathway | 197/4205 | 354/8465 | 1.24e-02 | 2.83e-02 | 1.45e-02 | 197 |
| hsa04510111 | Esophagus | ESCC | Focal adhesion | 127/4205 | 203/8465 | 1.25e-04 | 4.99e-04 | 2.56e-04 | 127 |
| hsa0415114 | Esophagus | ESCC | PI3K-Akt signaling pathway | 197/4205 | 354/8465 | 1.24e-02 | 2.83e-02 | 1.45e-02 | 197 |
| hsa0451019 | Oral cavity | OSCC | Focal adhesion | 128/3704 | 203/8465 | 1.71e-08 | 1.63e-07 | 8.31e-08 | 128 |
| hsa0401014 | Oral cavity | OSCC | MAPK signaling pathway | 165/3704 | 302/8465 | 7.11e-05 | 2.74e-04 | 1.40e-04 | 165 |
| hsa041516 | Oral cavity | OSCC | PI3K-Akt signaling pathway | 185/3704 | 354/8465 | 6.26e-04 | 1.86e-03 | 9.49e-04 | 185 |
| hsa0401518 | Oral cavity | OSCC | Rap1 signaling pathway | 107/3704 | 210/8465 | 2.01e-02 | 4.34e-02 | 2.21e-02 | 107 |
| hsa04510110 | Oral cavity | OSCC | Focal adhesion | 128/3704 | 203/8465 | 1.71e-08 | 1.63e-07 | 8.31e-08 | 128 |
| hsa0401015 | Oral cavity | OSCC | MAPK signaling pathway | 165/3704 | 302/8465 | 7.11e-05 | 2.74e-04 | 1.40e-04 | 165 |
| hsa0415113 | Oral cavity | OSCC | PI3K-Akt signaling pathway | 185/3704 | 354/8465 | 6.26e-04 | 1.86e-03 | 9.49e-04 | 185 |
| hsa0401519 | Oral cavity | OSCC | Rap1 signaling pathway | 107/3704 | 210/8465 | 2.01e-02 | 4.34e-02 | 2.21e-02 | 107 |
| hsa0451043 | Oral cavity | NEOLP | Focal adhesion | 71/1112 | 203/8465 | 7.25e-16 | 7.68e-14 | 4.83e-14 | 71 |
| hsa0415141 | Oral cavity | NEOLP | PI3K-Akt signaling pathway | 79/1112 | 354/8465 | 8.42e-07 | 9.92e-06 | 6.24e-06 | 79 |
| hsa0401041 | Oral cavity | NEOLP | MAPK signaling pathway | 59/1112 | 302/8465 | 9.40e-04 | 4.67e-03 | 2.94e-03 | 59 |
| hsa0401524 | Oral cavity | NEOLP | Rap1 signaling pathway | 40/1112 | 210/8465 | 9.07e-03 | 3.17e-02 | 1.99e-02 | 40 |
| hsa0451053 | Oral cavity | NEOLP | Focal adhesion | 71/1112 | 203/8465 | 7.25e-16 | 7.68e-14 | 4.83e-14 | 71 |
| hsa0415151 | Oral cavity | NEOLP | PI3K-Akt signaling pathway | 79/1112 | 354/8465 | 8.42e-07 | 9.92e-06 | 6.24e-06 | 79 |
| hsa0401051 | Oral cavity | NEOLP | MAPK signaling pathway | 59/1112 | 302/8465 | 9.40e-04 | 4.67e-03 | 2.94e-03 | 59 |
| hsa0401534 | Oral cavity | NEOLP | Rap1 signaling pathway | 40/1112 | 210/8465 | 9.07e-03 | 3.17e-02 | 1.99e-02 | 40 |
| Page: 1 |
Top |
Cell-cell communication analysis |
| Identification of potential cell-cell interactions between two cell types and their ligand-receptor pairs for different disease states |
| Ligand | Receptor | LRpair | Pathway | Tissue | Disease Stage |
| PGF | FLT1 | PGF_VEGFR1 | VEGF | Breast | ADJ |
| PGF | FLT1 | PGF_VEGFR1 | VEGF | Breast | DCIS |
| PGF | FLT1 | PGF_VEGFR1 | VEGF | Breast | Healthy |
| PGF | FLT1 | PGF_VEGFR1 | VEGF | Breast | IDC |
| PGF | FLT1 | PGF_VEGFR1 | VEGF | Breast | Precancer |
| PGF | FLT1 | PGF_VEGFR1 | VEGF | Cervix | Precancer |
| PGF | FLT1 | PGF_VEGFR1 | VEGF | Endometrium | AEH |
| PGF | FLT1 | PGF_VEGFR1 | VEGF | Endometrium | EEC |
| PGF | FLT1 | PGF_VEGFR1 | VEGF | Endometrium | Healthy |
| PGF | FLT1 | PGF_VEGFR1 | VEGF | Esophagus | ESCC |
| PGF | FLT1 | PGF_VEGFR1 | VEGF | GC | ADJ |
| PGF | FLT1 | PGF_VEGFR1 | VEGF | GC | GC |
| PGF | FLT1 | PGF_VEGFR1 | VEGF | HNSCC | ADJ |
| PGF | FLT1 | PGF_VEGFR1 | VEGF | HNSCC | OSCC |
| PGF | FLT1 | PGF_VEGFR1 | VEGF | HNSCC | Precancer |
| PGF | FLT1 | PGF_VEGFR1 | VEGF | Liver | HCC |
| PGF | FLT1 | PGF_VEGFR1 | VEGF | Liver | Healthy |
| PGF | FLT1 | PGF_VEGFR1 | VEGF | Liver | Precancer |
| PGF | FLT1 | PGF_VEGFR1 | VEGF | Lung | IAC |
| PGF | FLT1 | PGF_VEGFR1 | VEGF | Prostate | Healthy |
| Page: 1 2 |
Top |
Single-cell gene regulatory network inference analysis |
| Find out the significant the regulons (TFs) and the target genes of each regulon across cell types for different disease states |
| TF | Cell Type | Tissue | Disease Stage | Target Gene | RSS | Regulon Activity |
| ∗The dot plots of a searched regulon are shown for all cell subpopulations in each disease state of each tissue based on the regulon specific score inferred using pySCENIC and by calculating the average expression. |
| Page: 1 |
Top |
Somatic mutation of malignant transformation related genes |
| Annotation of somatic variants for genes involved in malignant transformation |
| Hugo Symbol | Variant Class | Variant Classification | dbSNP RS | HGVSc | HGVSp | HGVSp Short | SWISSPROT | BIOTYPE | SIFT | PolyPhen | Tumor Sample Barcode | Tissue | Histology | Sex | Age | Stage | Therapy Types | Drugs | Outcome |
| PGF | SNV | Missense_Mutation | novel | c.405N>T | p.Glu135Asp | p.E135D | P49763 | protein_coding | tolerated(0.89) | benign(0) | TCGA-AN-A046-01 | Breast | breast invasive carcinoma | Female | >=65 | I/II | Unknown | Unknown | SD |
| PGF | SNV | Missense_Mutation | c.286N>T | p.Pro96Ser | p.P96S | P49763 | protein_coding | deleterious(0.01) | benign(0.419) | TCGA-AO-A128-01 | Breast | breast invasive carcinoma | Female | <65 | I/II | Chemotherapy | doxorubicin | SD | |
| PGF | SNV | Missense_Mutation | rs748554696 | c.493N>A | p.Asp165Asn | p.D165N | P49763 | protein_coding | tolerated_low_confidence(0.96) | benign(0) | TCGA-E9-A5UP-01 | Breast | breast invasive carcinoma | Female | <65 | I/II | Hormone Therapy | tamoxiphen | SD |
| PGF | SNV | Missense_Mutation | rs764795497 | c.380N>A | p.Arg127His | p.R127H | P49763 | protein_coding | tolerated(0.12) | benign(0.003) | TCGA-A6-3808-01 | Colorectum | colon adenocarcinoma | Male | >=65 | I/II | Unknown | Unknown | SD |
| PGF | insertion | Frame_Shift_Ins | rs756979630 | c.73_74insC | p.Gln25ProfsTer66 | p.Q25Pfs*66 | P49763 | protein_coding | TCGA-G4-6588-01 | Colorectum | colon adenocarcinoma | Female | <65 | I/II | Unknown | Unknown | SD | ||
| PGF | SNV | Missense_Mutation | rs748554696 | c.493G>A | p.Asp165Asn | p.D165N | P49763 | protein_coding | tolerated_low_confidence(0.96) | benign(0) | TCGA-A5-A0G1-01 | Endometrium | uterine corpus endometrioid carcinoma | Female | >=65 | I/II | Unknown | Unknown | SD |
| PGF | SNV | Missense_Mutation | rs200980724 | c.100N>A | p.Gly34Ser | p.G34S | P49763 | protein_coding | tolerated(0.75) | benign(0) | TCGA-AJ-A3EK-01 | Endometrium | uterine corpus endometrioid carcinoma | Female | <65 | I/II | Chemotherapy | carboplatin | CR |
| PGF | SNV | Missense_Mutation | novel | c.397N>A | p.Leu133Met | p.L133M | P49763 | protein_coding | tolerated(0.1) | benign(0) | TCGA-AX-A2HC-01 | Endometrium | uterine corpus endometrioid carcinoma | Female | <65 | III/IV | Chemotherapy | paclitaxel | PD |
| PGF | SNV | Missense_Mutation | rs762510592 | c.392G>A | p.Arg131Gln | p.R131Q | P49763 | protein_coding | deleterious(0) | benign(0.104) | TCGA-BG-A222-01 | Endometrium | uterine corpus endometrioid carcinoma | Female | <65 | I/II | Unknown | Unknown | SD |
| PGF | SNV | Missense_Mutation | rs751046183 | c.385N>A | p.Glu129Lys | p.E129K | P49763 | protein_coding | deleterious(0) | possibly_damaging(0.692) | TCGA-D1-A16Y-01 | Endometrium | uterine corpus endometrioid carcinoma | Female | <65 | I/II | Unknown | Unknown | SD |
| Page: 1 2 3 |
Top |
Related drugs of malignant transformation related genes |
| Identification of chemicals and drugs interact with genes involved in malignant transfromation |
| (DGIdb 4.0) |
| Entrez ID | Symbol | Category | Interaction Types | Drug Claim Name | Drug Name | PMIDs |
| 5228 | PGF | GROWTH FACTOR, DRUGGABLE GENOME | SFLT-01 | |||
| 5228 | PGF | GROWTH FACTOR, DRUGGABLE GENOME | inhibitor | CHEMBL1742982 | AFLIBERCEPT | |
| 5228 | PGF | GROWTH FACTOR, DRUGGABLE GENOME | TB-403 | TB-403 | ||
| 5228 | PGF | GROWTH FACTOR, DRUGGABLE GENOME | Aflibercept | AFLIBERCEPT | ||
| 5228 | PGF | GROWTH FACTOR, DRUGGABLE GENOME | TB-403 | TB-403 | ||
| 5228 | PGF | GROWTH FACTOR, DRUGGABLE GENOME | RO-5323441 | TB-403 | ||
| 5228 | PGF | GROWTH FACTOR, DRUGGABLE GENOME | R7334 | |||
| 5228 | PGF | GROWTH FACTOR, DRUGGABLE GENOME | inhibitor | CHEMBL2108313 | CONBERCEPT |
| Page: 1 |

Copyright 2023-Present -The University of Texas Health Science Center at Houston |