
|
|||||
|
 | |
| |
| |
| |
| |
| |
|
Gene: PGD |
Gene summary for PGD |
| Gene information | Species | Human | Gene symbol | PGD | Gene ID | 5226 |
| Gene name | phosphogluconate dehydrogenase | |
| Gene Alias | 6PGD | |
| Cytomap | 1p36.22 | |
| Gene Type | protein-coding | GO ID | GO:0005975 | UniProtAcc | B4E2U0 |
Top |
Malignant transformation analysis |
| Identification of the aberrant gene expression in precancerous and cancerous lesions by comparing the gene expression of stem-like cells in diseased tissues with normal stem cells |
| Entrez ID | Symbol | Replicates | Species | Organ | Tissue | Adj P-value | Log2FC | Malignancy |
| 5226 | PGD | HTA11_347_2000001011 | Human | Colorectum | AD | 9.16e-03 | 2.31e-01 | -0.1954 |
| 5226 | PGD | HTA11_696_2000001011 | Human | Colorectum | AD | 6.10e-10 | 4.15e-01 | -0.1464 |
| 5226 | PGD | HTA11_1391_2000001011 | Human | Colorectum | AD | 2.34e-12 | 6.96e-01 | -0.059 |
| 5226 | PGD | HTA11_866_3004761011 | Human | Colorectum | AD | 2.32e-06 | 4.39e-01 | 0.096 |
| 5226 | PGD | HTA11_8622_2000001021 | Human | Colorectum | SER | 3.11e-03 | 4.52e-01 | 0.0528 |
| 5226 | PGD | HTA11_7696_3000711011 | Human | Colorectum | AD | 5.78e-08 | 3.88e-01 | 0.0674 |
| 5226 | PGD | HTA11_99999970781_79442 | Human | Colorectum | MSS | 5.57e-10 | 4.43e-01 | 0.294 |
| 5226 | PGD | HTA11_99999965062_69753 | Human | Colorectum | MSI-H | 1.28e-02 | 1.12e+00 | 0.3487 |
| 5226 | PGD | HTA11_99999965104_69814 | Human | Colorectum | MSS | 4.70e-07 | 5.78e-01 | 0.281 |
| 5226 | PGD | HTA11_99999971662_82457 | Human | Colorectum | MSS | 4.90e-27 | 8.09e-01 | 0.3859 |
| 5226 | PGD | HTA11_99999973899_84307 | Human | Colorectum | MSS | 2.93e-07 | 6.18e-01 | 0.2585 |
| 5226 | PGD | HTA11_99999974143_84620 | Human | Colorectum | MSS | 5.05e-04 | 2.23e-01 | 0.3005 |
| 5226 | PGD | LZE2D | Human | Esophagus | HGIN | 4.04e-03 | 1.06e+00 | 0.0642 |
| 5226 | PGD | LZE2T | Human | Esophagus | ESCC | 4.35e-14 | 2.58e+00 | 0.082 |
| 5226 | PGD | LZE4T | Human | Esophagus | ESCC | 9.90e-46 | 2.85e+00 | 0.0811 |
| 5226 | PGD | LZE7T | Human | Esophagus | ESCC | 1.16e-26 | 2.42e+00 | 0.0667 |
| 5226 | PGD | LZE8T | Human | Esophagus | ESCC | 1.17e-05 | 4.94e-01 | 0.067 |
| 5226 | PGD | LZE20T | Human | Esophagus | ESCC | 4.81e-11 | 1.04e+00 | 0.0662 |
| 5226 | PGD | LZE22D1 | Human | Esophagus | HGIN | 2.27e-10 | 1.16e+00 | 0.0595 |
| 5226 | PGD | LZE22T | Human | Esophagus | ESCC | 5.71e-13 | 2.26e+00 | 0.068 |
| Page: 1 2 3 4 5 6 7 |
| Tissue | Expression Dynamics | Abbreviation |
| Colorectum (GSE201348) |  | FAP: Familial adenomatous polyposis |
| CRC: Colorectal cancer | ||
| Colorectum (HTA11) |  | AD: Adenomas |
| SER: Sessile serrated lesions | ||
| MSI-H: Microsatellite-high colorectal cancer | ||
| MSS: Microsatellite stable colorectal cancer | ||
| Esophagus | 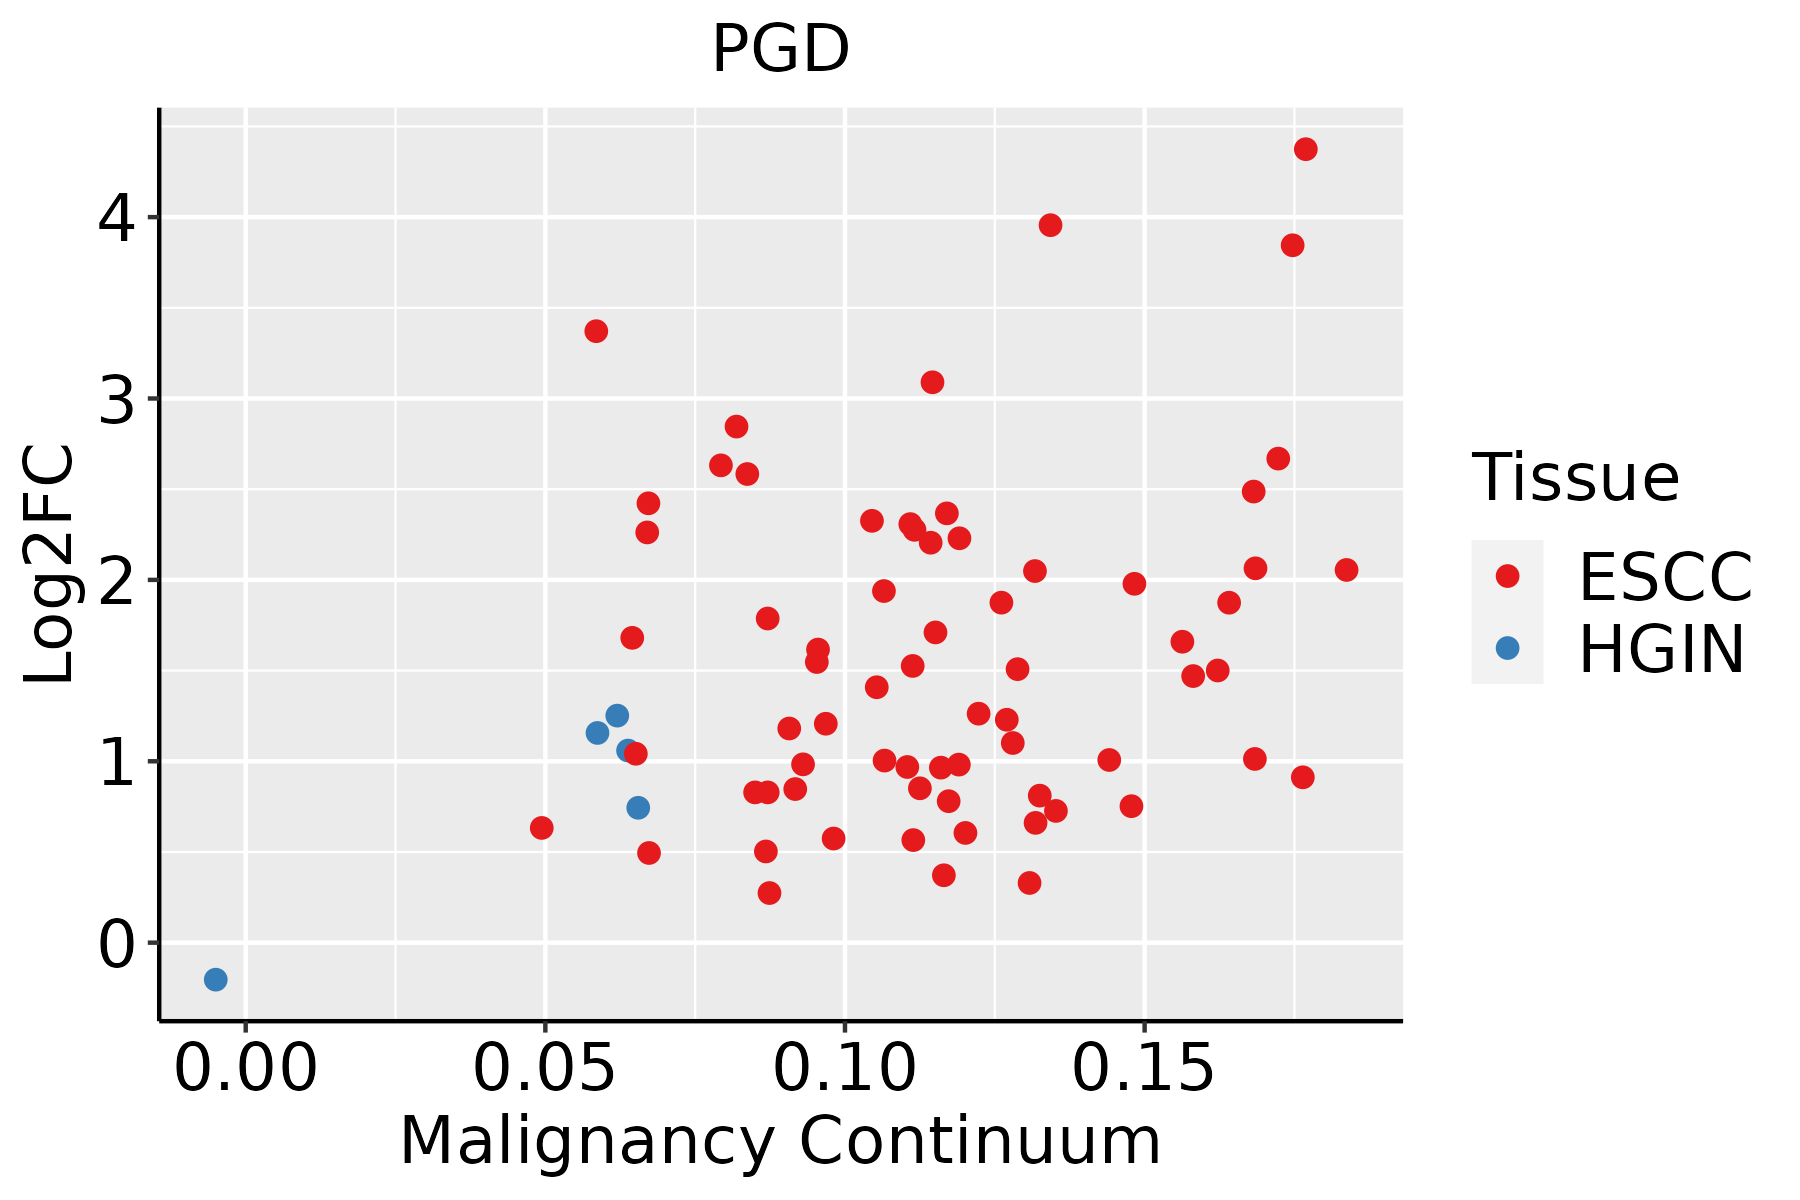 | ESCC: Esophageal squamous cell carcinoma |
| HGIN: High-grade intraepithelial neoplasias | ||
| LGIN: Low-grade intraepithelial neoplasias | ||
| Liver |  | HCC: Hepatocellular carcinoma |
| NAFLD: Non-alcoholic fatty liver disease | ||
| Oral Cavity |  | EOLP: Erosive Oral lichen planus |
| LP: leukoplakia | ||
| NEOLP: Non-erosive oral lichen planus | ||
| OSCC: Oral squamous cell carcinoma | ||
| Skin | 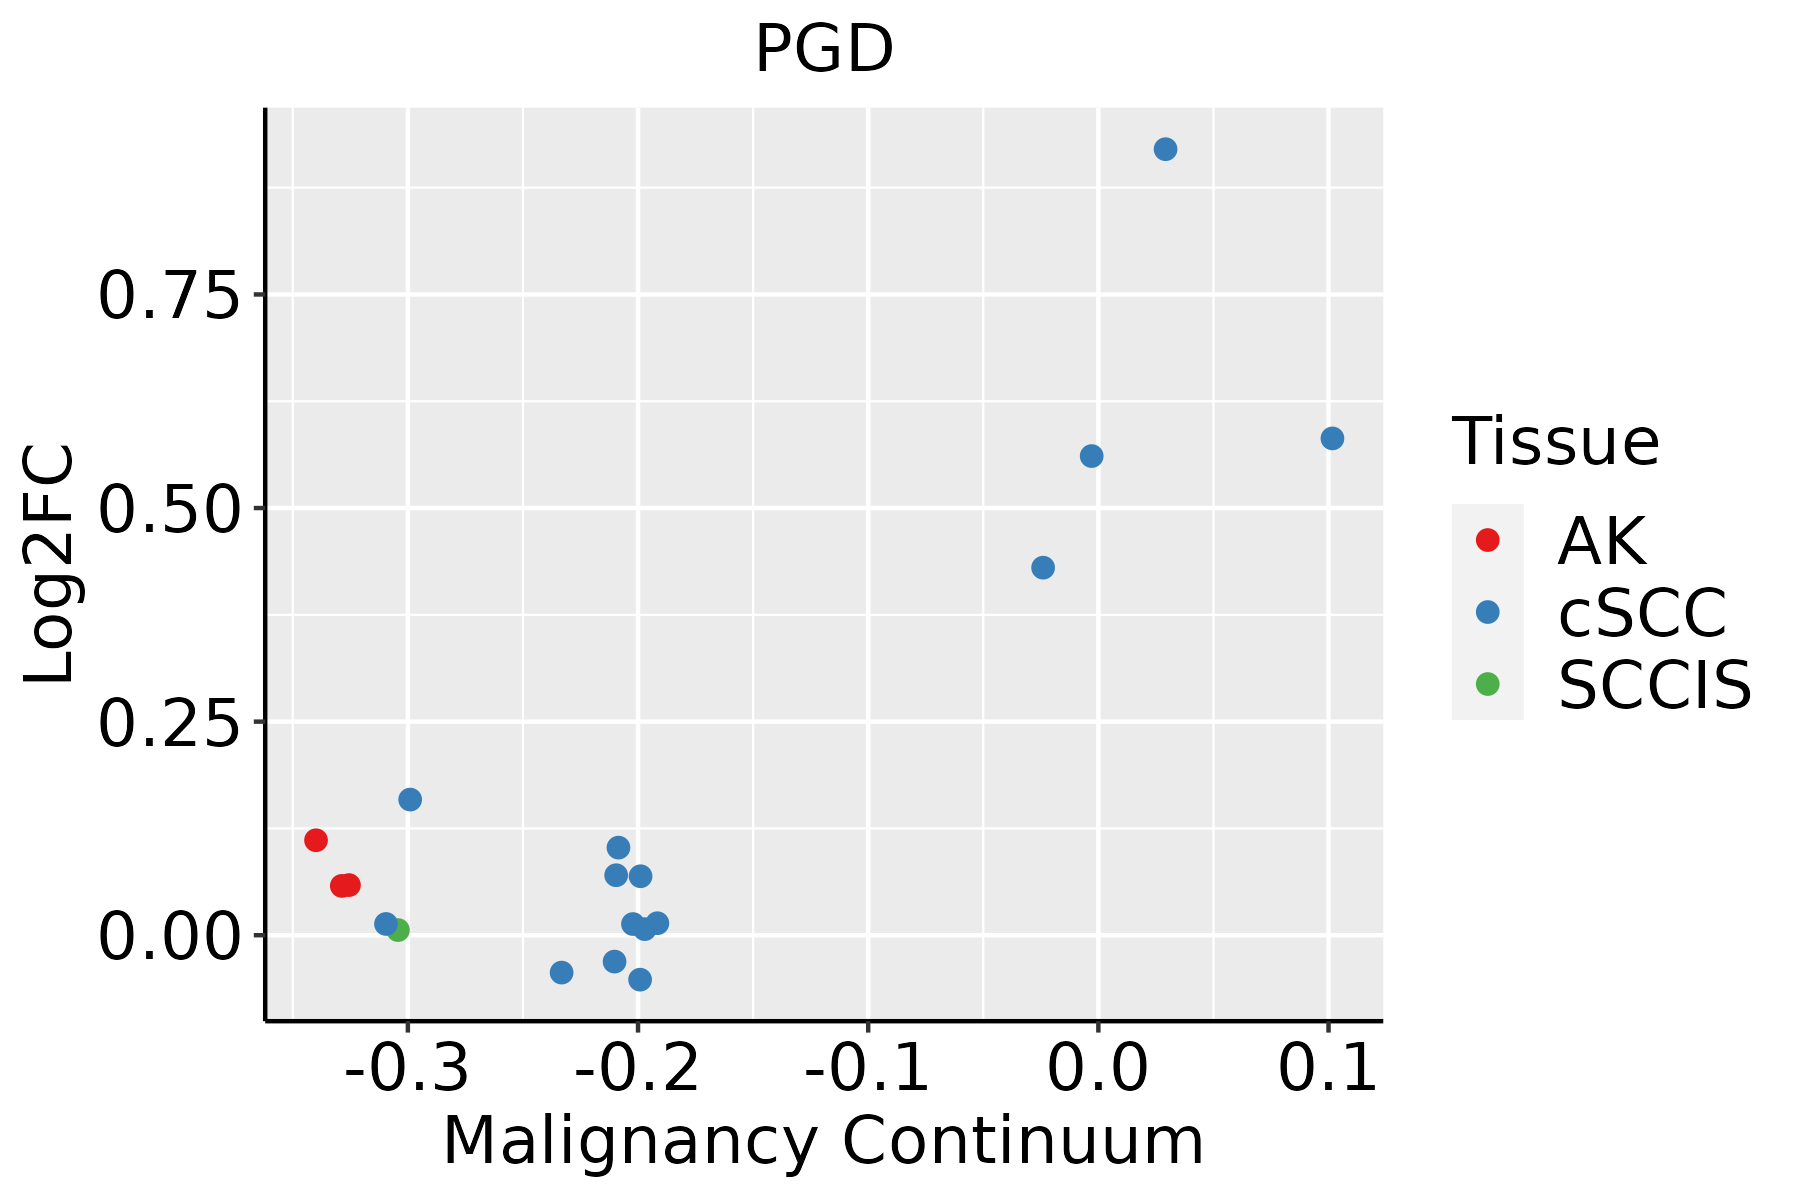 | AK: Actinic keratosis |
| cSCC: Cutaneous squamous cell carcinoma | ||
| SCCIS:squamous cell carcinoma in situ | ||
| Thyroid |  | ATC: Anaplastic thyroid cancer |
| HT: Hashimoto's thyroiditis | ||
| PTC: Papillary thyroid cancer |
| ∗log2FC in expression of this searched gene in stem-like cells from each diseased tissue sample relative to stem-like cells in normal samples in each tissue plotted against the malignancy continuum. Samples are colored based on if they are from different disease stage. |
Top |
Malignant transformation related pathway analysis |
| Find out the enriched GO biological processes and KEGG pathways involved in transition from healthy to precancer to cancer |
| Tissue | Disease Stage | Enriched GO biological Processes |
| Colorectum | AD |  |
| Colorectum | SER |  |
| Colorectum | MSS |  |
| Colorectum | MSI-H |  |
| Colorectum | FAP |  |
| ∗Top 15 enriched GO BP terms are showed in the bar plot of each disease state in each tissue. Each row represents a significant GO biological process which is colored according to the -log10(p.adjust). |
| Page: 1 2 3 4 5 6 7 8 9 |
| GO ID | Tissue | Disease Stage | Description | Gene Ratio | Bg Ratio | pvalue | p.adjust | Count |
| GO:00022379 | Cervix | CC | response to molecule of bacterial origin | 78/2311 | 363/18723 | 5.55e-07 | 2.06e-05 | 78 |
| GO:00324969 | Cervix | CC | response to lipopolysaccharide | 74/2311 | 343/18723 | 9.15e-07 | 3.25e-05 | 74 |
| GO:00075654 | Cervix | CC | female pregnancy | 43/2311 | 193/18723 | 7.62e-05 | 1.04e-03 | 43 |
| GO:00323556 | Cervix | CC | response to estradiol | 34/2311 | 141/18723 | 8.19e-05 | 1.11e-03 | 34 |
| GO:00071786 | Cervix | CC | transmembrane receptor protein serine/threonine kinase signaling pathway | 67/2311 | 355/18723 | 2.39e-04 | 2.67e-03 | 67 |
| GO:00447064 | Cervix | CC | multi-multicellular organism process | 45/2311 | 220/18723 | 4.14e-04 | 4.21e-03 | 45 |
| GO:0033002 | Cervix | CC | muscle cell proliferation | 49/2311 | 248/18723 | 5.43e-04 | 5.24e-03 | 49 |
| GO:00715595 | Cervix | CC | response to transforming growth factor beta | 50/2311 | 256/18723 | 6.31e-04 | 5.91e-03 | 50 |
| GO:00715605 | Cervix | CC | cellular response to transforming growth factor beta stimulus | 49/2311 | 250/18723 | 6.55e-04 | 6.05e-03 | 49 |
| GO:00457862 | Cervix | CC | negative regulation of cell cycle | 67/2311 | 385/18723 | 2.21e-03 | 1.59e-02 | 67 |
| GO:00464564 | Cervix | CC | icosanoid biosynthetic process | 15/2311 | 56/18723 | 2.60e-03 | 1.80e-02 | 15 |
| GO:00486593 | Cervix | CC | smooth muscle cell proliferation | 36/2311 | 184/18723 | 3.27e-03 | 2.13e-02 | 36 |
| GO:00071795 | Cervix | CC | transforming growth factor beta receptor signaling pathway | 38/2311 | 198/18723 | 3.62e-03 | 2.31e-02 | 38 |
| GO:00486603 | Cervix | CC | regulation of smooth muscle cell proliferation | 35/2311 | 180/18723 | 4.10e-03 | 2.54e-02 | 35 |
| GO:00973059 | Cervix | CC | response to alcohol | 46/2311 | 253/18723 | 4.40e-03 | 2.69e-02 | 46 |
| GO:00486612 | Cervix | CC | positive regulation of smooth muscle cell proliferation | 22/2311 | 104/18723 | 7.59e-03 | 4.04e-02 | 22 |
| GO:00015165 | Cervix | CC | prostaglandin biosynthetic process | 9/2311 | 31/18723 | 1.04e-02 | 4.97e-02 | 9 |
| GO:00464575 | Cervix | CC | prostanoid biosynthetic process | 9/2311 | 31/18723 | 1.04e-02 | 4.97e-02 | 9 |
| GO:000756512 | Cervix | HSIL_HPV | female pregnancy | 26/737 | 193/18723 | 4.32e-08 | 3.41e-06 | 26 |
| GO:004470611 | Cervix | HSIL_HPV | multi-multicellular organism process | 27/737 | 220/18723 | 1.69e-07 | 1.03e-05 | 27 |
| Page: 1 2 3 4 5 6 7 8 9 10 11 12 13 14 15 |
| Pathway ID | Tissue | Disease Stage | Description | Gene Ratio | Bg Ratio | pvalue | p.adjust | qvalue | Count |
| hsa01200 | Colorectum | AD | Carbon metabolism | 55/2092 | 115/8465 | 5.53e-08 | 8.42e-07 | 5.37e-07 | 55 |
| hsa00480 | Colorectum | AD | Glutathione metabolism | 23/2092 | 57/8465 | 6.52e-03 | 2.76e-02 | 1.76e-02 | 23 |
| hsa012001 | Colorectum | AD | Carbon metabolism | 55/2092 | 115/8465 | 5.53e-08 | 8.42e-07 | 5.37e-07 | 55 |
| hsa004801 | Colorectum | AD | Glutathione metabolism | 23/2092 | 57/8465 | 6.52e-03 | 2.76e-02 | 1.76e-02 | 23 |
| hsa012002 | Colorectum | SER | Carbon metabolism | 40/1580 | 115/8465 | 2.77e-05 | 3.41e-04 | 2.47e-04 | 40 |
| hsa012003 | Colorectum | SER | Carbon metabolism | 40/1580 | 115/8465 | 2.77e-05 | 3.41e-04 | 2.47e-04 | 40 |
| hsa012004 | Colorectum | MSS | Carbon metabolism | 43/1875 | 115/8465 | 1.37e-04 | 1.17e-03 | 7.19e-04 | 43 |
| hsa004802 | Colorectum | MSS | Glutathione metabolism | 22/1875 | 57/8465 | 3.58e-03 | 1.64e-02 | 1.01e-02 | 22 |
| hsa012005 | Colorectum | MSS | Carbon metabolism | 43/1875 | 115/8465 | 1.37e-04 | 1.17e-03 | 7.19e-04 | 43 |
| hsa004803 | Colorectum | MSS | Glutathione metabolism | 22/1875 | 57/8465 | 3.58e-03 | 1.64e-02 | 1.01e-02 | 22 |
| hsa0120016 | Esophagus | HGIN | Carbon metabolism | 31/1383 | 115/8465 | 2.51e-03 | 2.10e-02 | 1.67e-02 | 31 |
| hsa0120017 | Esophagus | HGIN | Carbon metabolism | 31/1383 | 115/8465 | 2.51e-03 | 2.10e-02 | 1.67e-02 | 31 |
| hsa0048018 | Esophagus | ESCC | Glutathione metabolism | 44/4205 | 57/8465 | 1.81e-05 | 9.03e-05 | 4.63e-05 | 44 |
| hsa0120023 | Esophagus | ESCC | Carbon metabolism | 79/4205 | 115/8465 | 2.50e-05 | 1.21e-04 | 6.22e-05 | 79 |
| hsa0048019 | Esophagus | ESCC | Glutathione metabolism | 44/4205 | 57/8465 | 1.81e-05 | 9.03e-05 | 4.63e-05 | 44 |
| hsa0120033 | Esophagus | ESCC | Carbon metabolism | 79/4205 | 115/8465 | 2.50e-05 | 1.21e-04 | 6.22e-05 | 79 |
| hsa0120021 | Liver | Cirrhotic | Carbon metabolism | 64/2530 | 115/8465 | 6.37e-09 | 1.18e-07 | 7.26e-08 | 64 |
| hsa004809 | Liver | Cirrhotic | Glutathione metabolism | 30/2530 | 57/8465 | 2.63e-04 | 1.72e-03 | 1.06e-03 | 30 |
| hsa0120031 | Liver | Cirrhotic | Carbon metabolism | 64/2530 | 115/8465 | 6.37e-09 | 1.18e-07 | 7.26e-08 | 64 |
| hsa0048012 | Liver | Cirrhotic | Glutathione metabolism | 30/2530 | 57/8465 | 2.63e-04 | 1.72e-03 | 1.06e-03 | 30 |
| Page: 1 2 |
Top |
Cell-cell communication analysis |
| Identification of potential cell-cell interactions between two cell types and their ligand-receptor pairs for different disease states |
| Ligand | Receptor | LRpair | Pathway | Tissue | Disease Stage |
| Page: 1 |
Top |
Single-cell gene regulatory network inference analysis |
| Find out the significant the regulons (TFs) and the target genes of each regulon across cell types for different disease states |
| TF | Cell Type | Tissue | Disease Stage | Target Gene | RSS | Regulon Activity |
| ∗The dot plots of a searched regulon are shown for all cell subpopulations in each disease state of each tissue based on the regulon specific score inferred using pySCENIC and by calculating the average expression. |
| Page: 1 |
Top |
Somatic mutation of malignant transformation related genes |
| Annotation of somatic variants for genes involved in malignant transformation |
| Hugo Symbol | Variant Class | Variant Classification | dbSNP RS | HGVSc | HGVSp | HGVSp Short | SWISSPROT | BIOTYPE | SIFT | PolyPhen | Tumor Sample Barcode | Tissue | Histology | Sex | Age | Stage | Therapy Types | Drugs | Outcome |
| PGD | SNV | Missense_Mutation | c.868N>G | p.Leu290Val | p.L290V | P52209 | protein_coding | tolerated(0.08) | probably_damaging(0.924) | TCGA-AN-A0G0-01 | Breast | breast invasive carcinoma | Female | <65 | I/II | Unknown | Unknown | SD | |
| PGD | SNV | Missense_Mutation | c.862N>T | p.Arg288Trp | p.R288W | P52209 | protein_coding | deleterious(0) | probably_damaging(1) | TCGA-BH-A1EV-01 | Breast | breast invasive carcinoma | Female | <65 | III/IV | Unknown | Unknown | PD | |
| PGD | deletion | Frame_Shift_Del | novel | c.14delA | p.Asp5AlafsTer4 | p.D5Afs*4 | P52209 | protein_coding | TCGA-D8-A27V-01 | Breast | breast invasive carcinoma | Female | <65 | I/II | Hormone Therapy | tamoxiphen | SD | ||
| PGD | SNV | Missense_Mutation | c.442N>C | p.Glu148Gln | p.E148Q | P52209 | protein_coding | tolerated(0.14) | benign(0.013) | TCGA-DR-A0ZM-01 | Cervix | cervical & endocervical cancer | Female | <65 | III/IV | Unspecific | Cisplatin | SD | |
| PGD | SNV | Missense_Mutation | c.863N>A | p.Arg288Gln | p.R288Q | P52209 | protein_coding | deleterious(0.04) | probably_damaging(0.911) | TCGA-DS-A1OD-01 | Cervix | cervical & endocervical cancer | Female | <65 | I/II | Chemotherapy | cisplatin | SD | |
| PGD | SNV | Missense_Mutation | c.126C>A | p.Phe42Leu | p.F42L | P52209 | protein_coding | deleterious(0.03) | probably_damaging(1) | TCGA-FU-A3HZ-01 | Cervix | cervical & endocervical cancer | Female | <65 | I/II | Chemotherapy | cisplatin | CR | |
| PGD | SNV | Missense_Mutation | novel | c.256G>C | p.Glu86Gln | p.E86Q | P52209 | protein_coding | tolerated(0.12) | benign(0.007) | TCGA-VS-A958-01 | Cervix | cervical & endocervical cancer | Female | <65 | I/II | Chemotherapy | cisplatin | CR |
| PGD | SNV | Missense_Mutation | c.759N>T | p.Lys253Asn | p.K253N | P52209 | protein_coding | deleterious(0.04) | possibly_damaging(0.495) | TCGA-AA-A010-01 | Colorectum | colon adenocarcinoma | Female | <65 | I/II | Chemotherapy | folinic | CR | |
| PGD | SNV | Missense_Mutation | c.1222C>T | p.Arg408Trp | p.R408W | P52209 | protein_coding | deleterious(0) | possibly_damaging(0.884) | TCGA-AD-6964-01 | Colorectum | colon adenocarcinoma | Male | <65 | III/IV | Chemotherapy | folfox | PD | |
| PGD | SNV | Missense_Mutation | c.137A>G | p.Glu46Gly | p.E46G | P52209 | protein_coding | deleterious(0.03) | benign(0.305) | TCGA-AZ-6601-01 | Colorectum | colon adenocarcinoma | Male | >=65 | I/II | Unknown | Unknown | PD |
| Page: 1 2 3 4 5 |
Top |
Related drugs of malignant transformation related genes |
| Identification of chemicals and drugs interact with genes involved in malignant transfromation |
| (DGIdb 4.0) |
| Entrez ID | Symbol | Category | Interaction Types | Drug Claim Name | Drug Name | PMIDs |
| 5226 | PGD | ENZYME, DRUGGABLE GENOME | PENICILLAMINE | PENICILLAMINE | 289317 | |
| 5226 | PGD | ENZYME, DRUGGABLE GENOME | GHRP-2 | |||
| 5226 | PGD | ENZYME, DRUGGABLE GENOME | PHENOBARBITAL | PHENOBARBITAL | 7827108 |
| Page: 1 |

Copyright 2023-Present -The University of Texas Health Science Center at Houston |