
|
|||||
|
 | |
| |
| |
| |
| |
| |
|
Gene: PGC |
Gene summary for PGC |
| Gene information | Species | Human | Gene symbol | PGC | Gene ID | 5225 |
| Gene name | progastricsin | |
| Gene Alias | PEPC | |
| Cytomap | 6p21.1 | |
| Gene Type | protein-coding | GO ID | GO:0002225 | UniProtAcc | P20142 |
Top |
Malignant transformation analysis |
| Identification of the aberrant gene expression in precancerous and cancerous lesions by comparing the gene expression of stem-like cells in diseased tissues with normal stem cells |
| Entrez ID | Symbol | Replicates | Species | Organ | Tissue | Adj P-value | Log2FC | Malignancy |
| 5225 | PGC | TD9 | Human | Lung | IAC | 2.93e-04 | 1.04e+00 | 0.088 |
| 5225 | PGC | RNA-P23T2-P23T2-2 | Human | Lung | MIAC | 9.85e-05 | 1.26e+00 | -0.028 |
| 5225 | PGC | Pat02-B | Human | Stomach | GC | 9.78e-74 | 1.23e+00 | 0.0368 |
| 5225 | PGC | Pat03-B | Human | Stomach | GC | 1.15e-05 | 4.04e-01 | 0.3693 |
| 5225 | PGC | Pat04-B | Human | Stomach | GC | 3.08e-28 | 1.13e+00 | -0.1483 |
| 5225 | PGC | Pat05-B | Human | Stomach | GC | 7.04e-32 | 1.21e+00 | -0.0353 |
| 5225 | PGC | Pat06-B | Human | Stomach | GC | 1.53e-77 | 1.31e+00 | -0.1961 |
| 5225 | PGC | Pat10-B | Human | Stomach | GC | 2.97e-08 | 5.73e-01 | 0.084 |
| 5225 | PGC | Pat11-B | Human | Stomach | GC | 2.51e-44 | 1.21e+00 | -0.182 |
| 5225 | PGC | Pat15-B | Human | Stomach | GC | 2.09e-66 | 1.41e+00 | -0.0778 |
| 5225 | PGC | Pat16-B | Human | Stomach | GC | 7.27e-12 | -7.38e-01 | 0.1918 |
| 5225 | PGC | Pat17-B | Human | Stomach | GC | 1.59e-07 | -2.85e-01 | 0.3109 |
| 5225 | PGC | Pat18-B | Human | Stomach | GC | 1.50e-90 | 1.55e+00 | -0.0432 |
| 5225 | PGC | Pat19-B | Human | Stomach | GC | 1.21e-32 | 8.89e-01 | 0.0826 |
| 5225 | PGC | Pat22-B | Human | Stomach | GC | 8.15e-61 | 1.10e+00 | -0.1042 |
| 5225 | PGC | Pat24-B | Human | Stomach | GC | 1.55e-51 | 1.35e+00 | -0.1184 |
| 5225 | PGC | Pat25-A | Human | Stomach | CAG with IM | 2.37e-80 | 1.57e+00 | -0.1648 |
| 5225 | PGC | Pat26-A | Human | Stomach | CSG | 7.64e-99 | 1.57e+00 | -0.2402 |
| 5225 | PGC | Pat28-A | Human | Stomach | CSG | 1.46e-64 | 1.58e+00 | -0.2594 |
| 5225 | PGC | Pat29-A | Human | Stomach | CAG with IM | 1.43e-29 | 1.45e+00 | -0.2769 |
| Page: 1 2 |
| Tissue | Expression Dynamics | Abbreviation |
| GC | 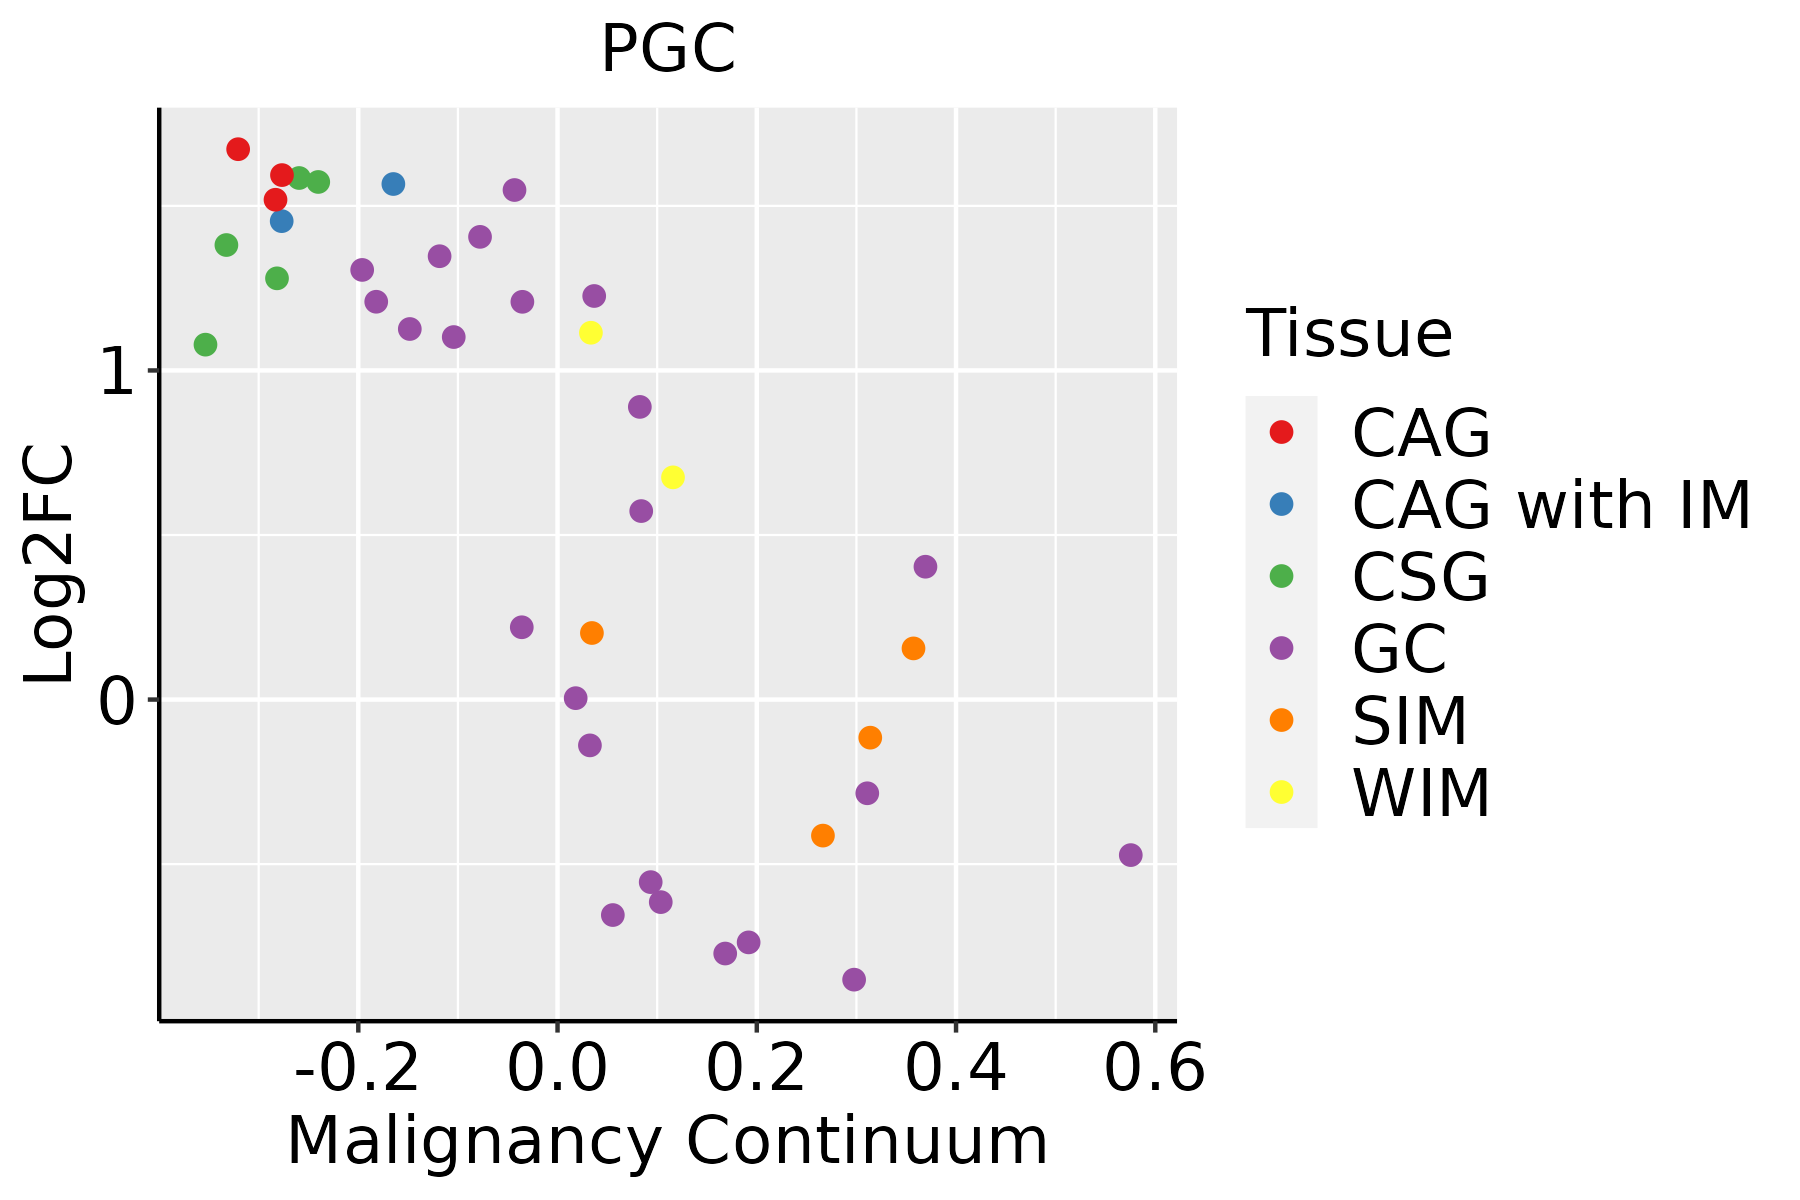 | CAG: Chronic atrophic gastritis |
| CAG with IM: Chronic atrophic gastritis with intestinal metaplasia | ||
| CSG: Chronic superficial gastritis | ||
| GC: Gastric cancer | ||
| SIM: Severe intestinal metaplasia | ||
| WIM: Wild intestinal metaplasia | ||
| Lung |  | AAH: Atypical adenomatous hyperplasia |
| AIS: Adenocarcinoma in situ | ||
| IAC: Invasive lung adenocarcinoma | ||
| MIA: Minimally invasive adenocarcinoma |
| ∗log2FC in expression of this searched gene in stem-like cells from each diseased tissue sample relative to stem-like cells in normal samples in each tissue plotted against the malignancy continuum. Samples are colored based on if they are from different disease stage. |
Top |
Malignant transformation related pathway analysis |
| Find out the enriched GO biological processes and KEGG pathways involved in transition from healthy to precancer to cancer |
| Tissue | Disease Stage | Enriched GO biological Processes |
| Colorectum | AD |  |
| Colorectum | SER |  |
| Colorectum | MSS |  |
| Colorectum | MSI-H |  |
| Colorectum | FAP |  |
| ∗Top 15 enriched GO BP terms are showed in the bar plot of each disease state in each tissue. Each row represents a significant GO biological process which is colored according to the -log10(p.adjust). |
| Page: 1 2 3 4 5 6 7 8 9 |
| GO ID | Tissue | Disease Stage | Description | Gene Ratio | Bg Ratio | pvalue | p.adjust | Count |
| GO:00321033 | Lung | IAC | positive regulation of response to external stimulus | 65/2061 | 427/18723 | 4.28e-03 | 3.41e-02 | 65 |
| GO:0007586 | Stomach | GC | digestion | 38/1159 | 137/18723 | 1.80e-15 | 1.22e-12 | 38 |
| GO:0019730 | Stomach | GC | antimicrobial humoral response | 25/1159 | 122/18723 | 9.62e-08 | 6.08e-06 | 25 |
| GO:0006959 | Stomach | GC | humoral immune response | 42/1159 | 317/18723 | 2.59e-06 | 1.10e-04 | 42 |
| GO:0019731 | Stomach | GC | antibacterial humoral response | 13/1159 | 60/18723 | 6.18e-05 | 1.40e-03 | 13 |
| GO:0042742 | Stomach | GC | defense response to bacterium | 37/1159 | 350/18723 | 1.05e-03 | 1.23e-02 | 37 |
| GO:0061844 | Stomach | GC | antimicrobial humoral immune response mediated by antimicrobial peptide | 12/1159 | 79/18723 | 3.26e-03 | 2.87e-02 | 12 |
| GO:1900426 | Stomach | GC | positive regulation of defense response to bacterium | 4/1159 | 11/18723 | 3.39e-03 | 2.94e-02 | 4 |
| GO:1900424 | Stomach | GC | regulation of defense response to bacterium | 5/1159 | 18/18723 | 3.92e-03 | 3.30e-02 | 5 |
| GO:00075861 | Stomach | CAG with IM | digestion | 29/1050 | 137/18723 | 4.42e-10 | 6.93e-08 | 29 |
| GO:00197301 | Stomach | CAG with IM | antimicrobial humoral response | 23/1050 | 122/18723 | 2.62e-07 | 1.61e-05 | 23 |
| GO:00069591 | Stomach | CAG with IM | humoral immune response | 39/1050 | 317/18723 | 3.43e-06 | 1.36e-04 | 39 |
| GO:00197311 | Stomach | CAG with IM | antibacterial humoral response | 12/1050 | 60/18723 | 1.04e-04 | 2.28e-03 | 12 |
| GO:00427421 | Stomach | CAG with IM | defense response to bacterium | 34/1050 | 350/18723 | 1.32e-03 | 1.56e-02 | 34 |
| GO:00618441 | Stomach | CAG with IM | antimicrobial humoral immune response mediated by antimicrobial peptide | 12/1050 | 79/18723 | 1.43e-03 | 1.64e-02 | 12 |
| GO:19004261 | Stomach | CAG with IM | positive regulation of defense response to bacterium | 4/1050 | 11/18723 | 2.36e-03 | 2.35e-02 | 4 |
| GO:19004241 | Stomach | CAG with IM | regulation of defense response to bacterium | 5/1050 | 18/18723 | 2.55e-03 | 2.49e-02 | 5 |
| GO:00075862 | Stomach | CSG | digestion | 25/1034 | 137/18723 | 1.15e-07 | 8.25e-06 | 25 |
| GO:00197302 | Stomach | CSG | antimicrobial humoral response | 23/1034 | 122/18723 | 1.99e-07 | 1.30e-05 | 23 |
| GO:00069592 | Stomach | CSG | humoral immune response | 40/1034 | 317/18723 | 9.26e-07 | 4.76e-05 | 40 |
| Page: 1 2 3 |
| Pathway ID | Tissue | Disease Stage | Description | Gene Ratio | Bg Ratio | pvalue | p.adjust | qvalue | Count |
| Page: 1 |
Top |
Cell-cell communication analysis |
| Identification of potential cell-cell interactions between two cell types and their ligand-receptor pairs for different disease states |
| Ligand | Receptor | LRpair | Pathway | Tissue | Disease Stage |
| Page: 1 |
Top |
Single-cell gene regulatory network inference analysis |
| Find out the significant the regulons (TFs) and the target genes of each regulon across cell types for different disease states |
| TF | Cell Type | Tissue | Disease Stage | Target Gene | RSS | Regulon Activity |
| ∗The dot plots of a searched regulon are shown for all cell subpopulations in each disease state of each tissue based on the regulon specific score inferred using pySCENIC and by calculating the average expression. |
| Page: 1 |
Top |
Somatic mutation of malignant transformation related genes |
| Annotation of somatic variants for genes involved in malignant transformation |
| Hugo Symbol | Variant Class | Variant Classification | dbSNP RS | HGVSc | HGVSp | HGVSp Short | SWISSPROT | BIOTYPE | SIFT | PolyPhen | Tumor Sample Barcode | Tissue | Histology | Sex | Age | Stage | Therapy Types | Drugs | Outcome |
| PGC | SNV | Missense_Mutation | rs151306066 | c.163N>T | p.Arg55Cys | p.R55C | P20142 | protein_coding | tolerated(0.15) | benign(0.28) | TCGA-A1-A0SD-01 | Breast | breast invasive carcinoma | Female | <65 | I/II | Unknown | Unknown | SD |
| PGC | insertion | In_Frame_Ins | novel | c.925_926insTGGGGAGAGGAGACCCTGCTGAGGACCACGGCAGCCTGAATGTACCTG | p.Asn309delinsMetGlyArgGlyAspProAlaGluAspHisGlySerLeuAsnValProAsp | p.N309delinsMGRGDPAEDHGSLNVPD | P20142 | protein_coding | TCGA-A2-A0D1-01 | Breast | breast invasive carcinoma | Female | >=65 | I/II | Chemotherapy | taxotere | SD | ||
| PGC | SNV | Missense_Mutation | c.1090G>A | p.Gly364Arg | p.G364R | P20142 | protein_coding | deleterious(0.02) | probably_damaging(1) | TCGA-C5-A7X5-01 | Cervix | cervical & endocervical cancer | Female | >=65 | I/II | Chemotherapy | carboplatin | PD | |
| PGC | SNV | Missense_Mutation | rs745956348 | c.1070G>A | p.Gly357Asp | p.G357D | P20142 | protein_coding | deleterious(0.03) | benign(0.202) | TCGA-EA-A410-01 | Cervix | cervical & endocervical cancer | Female | <65 | I/II | Unknown | Unknown | SD |
| PGC | SNV | Missense_Mutation | c.1162N>A | p.Ala388Thr | p.A388T | P20142 | protein_coding | deleterious(0.01) | possibly_damaging(0.741) | TCGA-AA-A010-01 | Colorectum | colon adenocarcinoma | Female | <65 | I/II | Chemotherapy | folinic | CR | |
| PGC | SNV | Missense_Mutation | c.505N>G | p.Thr169Ala | p.T169A | P20142 | protein_coding | tolerated(0.29) | benign(0) | TCGA-AA-A010-01 | Colorectum | colon adenocarcinoma | Female | <65 | I/II | Chemotherapy | folinic | CR | |
| PGC | SNV | Missense_Mutation | c.275N>T | p.Thr92Ile | p.T92I | P20142 | protein_coding | deleterious(0) | probably_damaging(0.996) | TCGA-D5-6928-01 | Colorectum | colon adenocarcinoma | Male | >=65 | I/II | Unknown | Unknown | SD | |
| PGC | SNV | Missense_Mutation | rs770437031 | c.322N>A | p.Ala108Thr | p.A108T | P20142 | protein_coding | deleterious(0) | probably_damaging(0.995) | TCGA-AG-3726-01 | Colorectum | rectum adenocarcinoma | Female | <65 | I/II | Unknown | Unknown | SD |
| PGC | insertion | Frame_Shift_Ins | novel | c.295_296insG | p.Val99GlyfsTer48 | p.V99Gfs*48 | P20142 | protein_coding | TCGA-AA-3821-01 | Colorectum | colon adenocarcinoma | Female | >=65 | I/II | Unknown | Unknown | SD | ||
| PGC | deletion | Frame_Shift_Del | c.1093delN | p.Asp365MetfsTer18 | p.D365Mfs*18 | P20142 | protein_coding | TCGA-G4-6309-01 | Colorectum | colon adenocarcinoma | Female | <65 | III/IV | Chemotherapy | xeloda | PD |
| Page: 1 2 3 4 5 |
Top |
Related drugs of malignant transformation related genes |
| Identification of chemicals and drugs interact with genes involved in malignant transfromation |
| (DGIdb 4.0) |
| Entrez ID | Symbol | Category | Interaction Types | Drug Claim Name | Drug Name | PMIDs |
| 5225 | PGC | DRUGGABLE GENOME, ENZYME, PROTEASE | ECABET | ECABET | ||
| 5225 | PGC | DRUGGABLE GENOME, ENZYME, PROTEASE | inhibitor | 252166834 |
| Page: 1 |

Copyright 2023-Present -The University of Texas Health Science Center at Houston |