
|
|||||
|
 | |
| |
| |
| |
| |
| |
|
Gene: PGAP2 |
Gene summary for PGAP2 |
| Gene information | Species | Human | Gene symbol | PGAP2 | Gene ID | 27315 |
| Gene name | post-GPI attachment to proteins 2 | |
| Gene Alias | CWH43-N | |
| Cytomap | 11p15.4 | |
| Gene Type | protein-coding | GO ID | GO:0006464 | UniProtAcc | Q9UHJ9 |
Top |
Malignant transformation analysis |
| Identification of the aberrant gene expression in precancerous and cancerous lesions by comparing the gene expression of stem-like cells in diseased tissues with normal stem cells |
| Entrez ID | Symbol | Replicates | Species | Organ | Tissue | Adj P-value | Log2FC | Malignancy |
| 27315 | PGAP2 | LZE4T | Human | Esophagus | ESCC | 6.22e-08 | 1.66e-01 | 0.0811 |
| 27315 | PGAP2 | LZE7T | Human | Esophagus | ESCC | 4.12e-05 | 3.23e-01 | 0.0667 |
| 27315 | PGAP2 | LZE20T | Human | Esophagus | ESCC | 6.97e-03 | 9.94e-02 | 0.0662 |
| 27315 | PGAP2 | LZE24T | Human | Esophagus | ESCC | 5.95e-11 | 4.08e-01 | 0.0596 |
| 27315 | PGAP2 | P1T-E | Human | Esophagus | ESCC | 7.94e-03 | 1.28e-01 | 0.0875 |
| 27315 | PGAP2 | P2T-E | Human | Esophagus | ESCC | 6.43e-24 | 4.72e-01 | 0.1177 |
| 27315 | PGAP2 | P4T-E | Human | Esophagus | ESCC | 9.96e-24 | 5.48e-01 | 0.1323 |
| 27315 | PGAP2 | P5T-E | Human | Esophagus | ESCC | 1.89e-08 | 1.34e-01 | 0.1327 |
| 27315 | PGAP2 | P8T-E | Human | Esophagus | ESCC | 5.56e-06 | 1.48e-01 | 0.0889 |
| 27315 | PGAP2 | P9T-E | Human | Esophagus | ESCC | 3.38e-12 | 3.09e-01 | 0.1131 |
| 27315 | PGAP2 | P10T-E | Human | Esophagus | ESCC | 4.87e-20 | 3.16e-01 | 0.116 |
| 27315 | PGAP2 | P11T-E | Human | Esophagus | ESCC | 2.15e-08 | 4.74e-01 | 0.1426 |
| 27315 | PGAP2 | P12T-E | Human | Esophagus | ESCC | 3.40e-27 | 5.07e-01 | 0.1122 |
| 27315 | PGAP2 | P15T-E | Human | Esophagus | ESCC | 4.39e-20 | 4.59e-01 | 0.1149 |
| 27315 | PGAP2 | P16T-E | Human | Esophagus | ESCC | 6.41e-20 | 3.23e-01 | 0.1153 |
| 27315 | PGAP2 | P17T-E | Human | Esophagus | ESCC | 7.32e-07 | 2.97e-01 | 0.1278 |
| 27315 | PGAP2 | P19T-E | Human | Esophagus | ESCC | 1.49e-03 | 3.29e-01 | 0.1662 |
| 27315 | PGAP2 | P20T-E | Human | Esophagus | ESCC | 8.01e-21 | 5.18e-01 | 0.1124 |
| 27315 | PGAP2 | P21T-E | Human | Esophagus | ESCC | 1.54e-35 | 6.02e-01 | 0.1617 |
| 27315 | PGAP2 | P22T-E | Human | Esophagus | ESCC | 9.54e-24 | 4.09e-01 | 0.1236 |
| Page: 1 2 3 4 5 |
| Tissue | Expression Dynamics | Abbreviation |
| Esophagus |  | ESCC: Esophageal squamous cell carcinoma |
| HGIN: High-grade intraepithelial neoplasias | ||
| LGIN: Low-grade intraepithelial neoplasias | ||
| Liver | 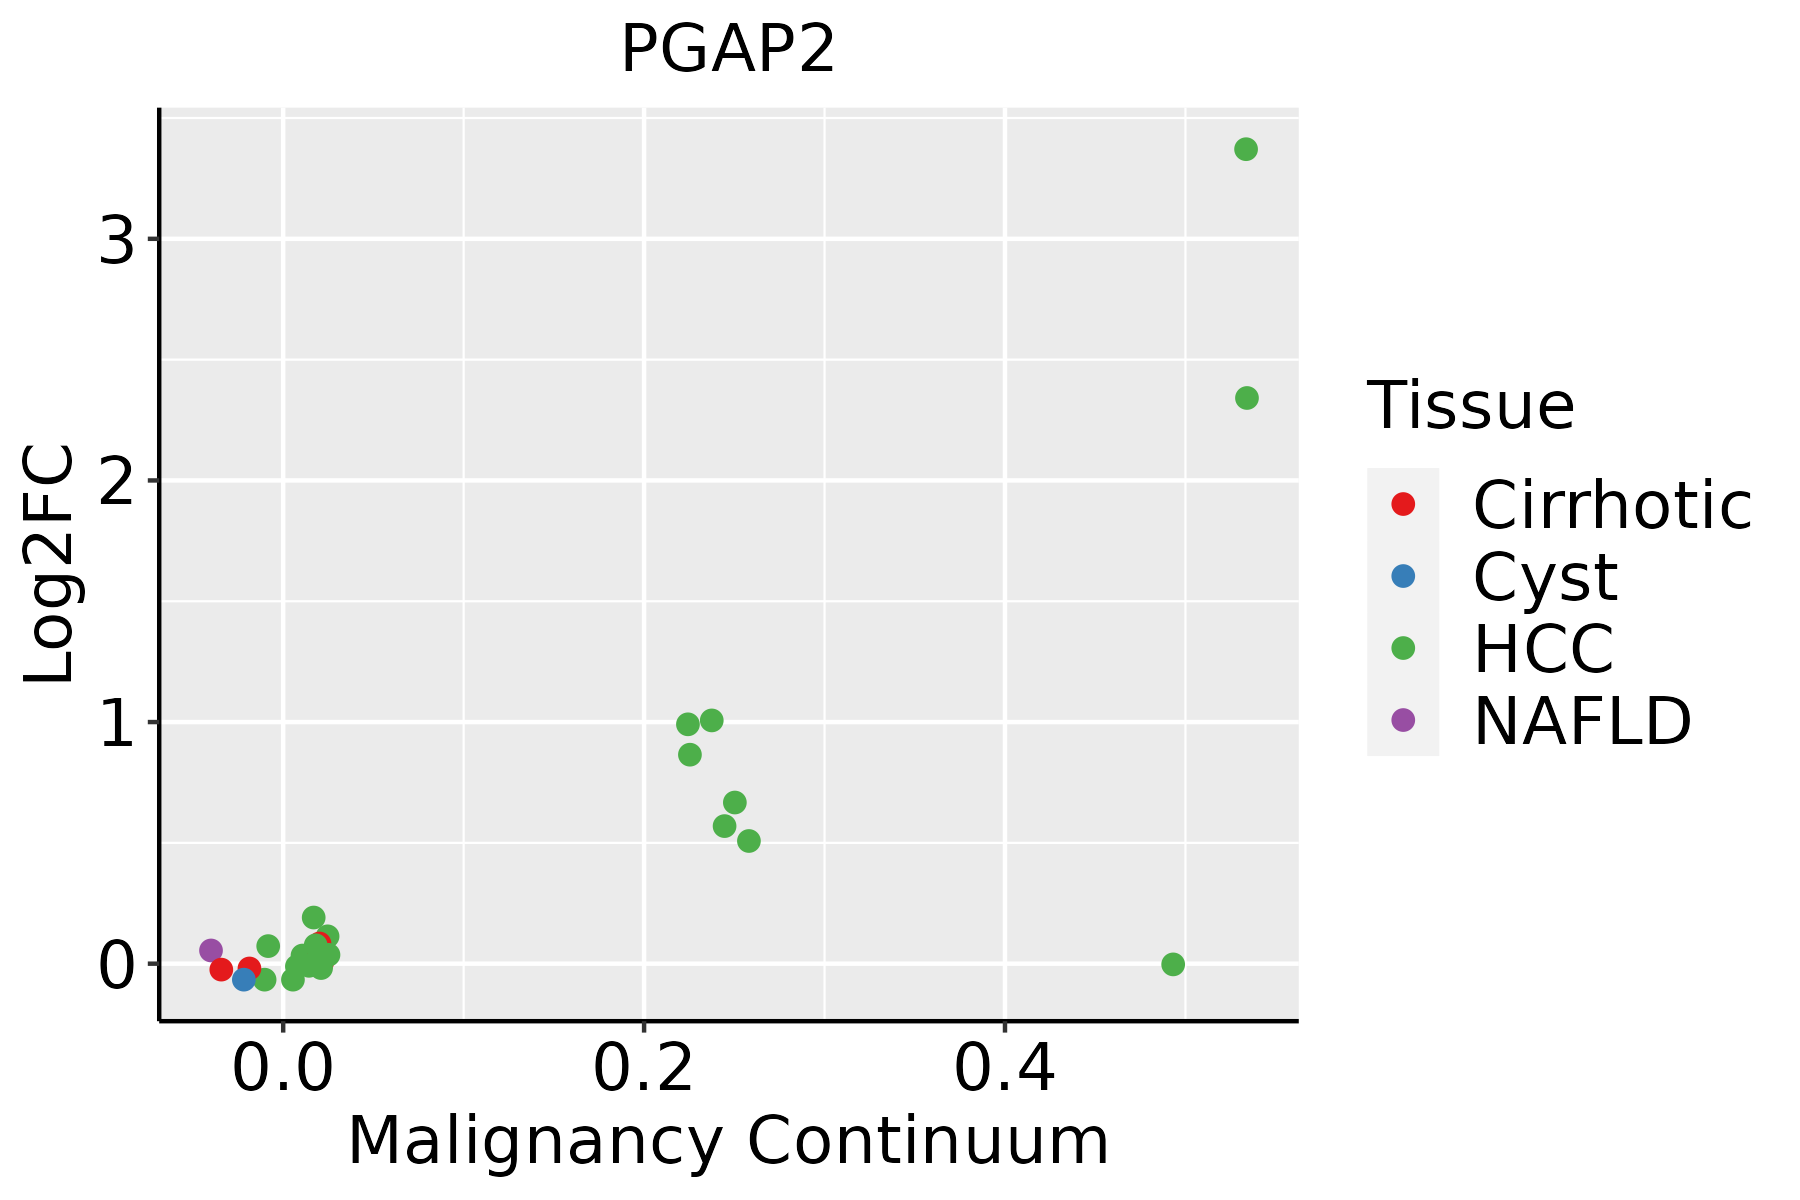 | HCC: Hepatocellular carcinoma |
| NAFLD: Non-alcoholic fatty liver disease | ||
| Oral Cavity | 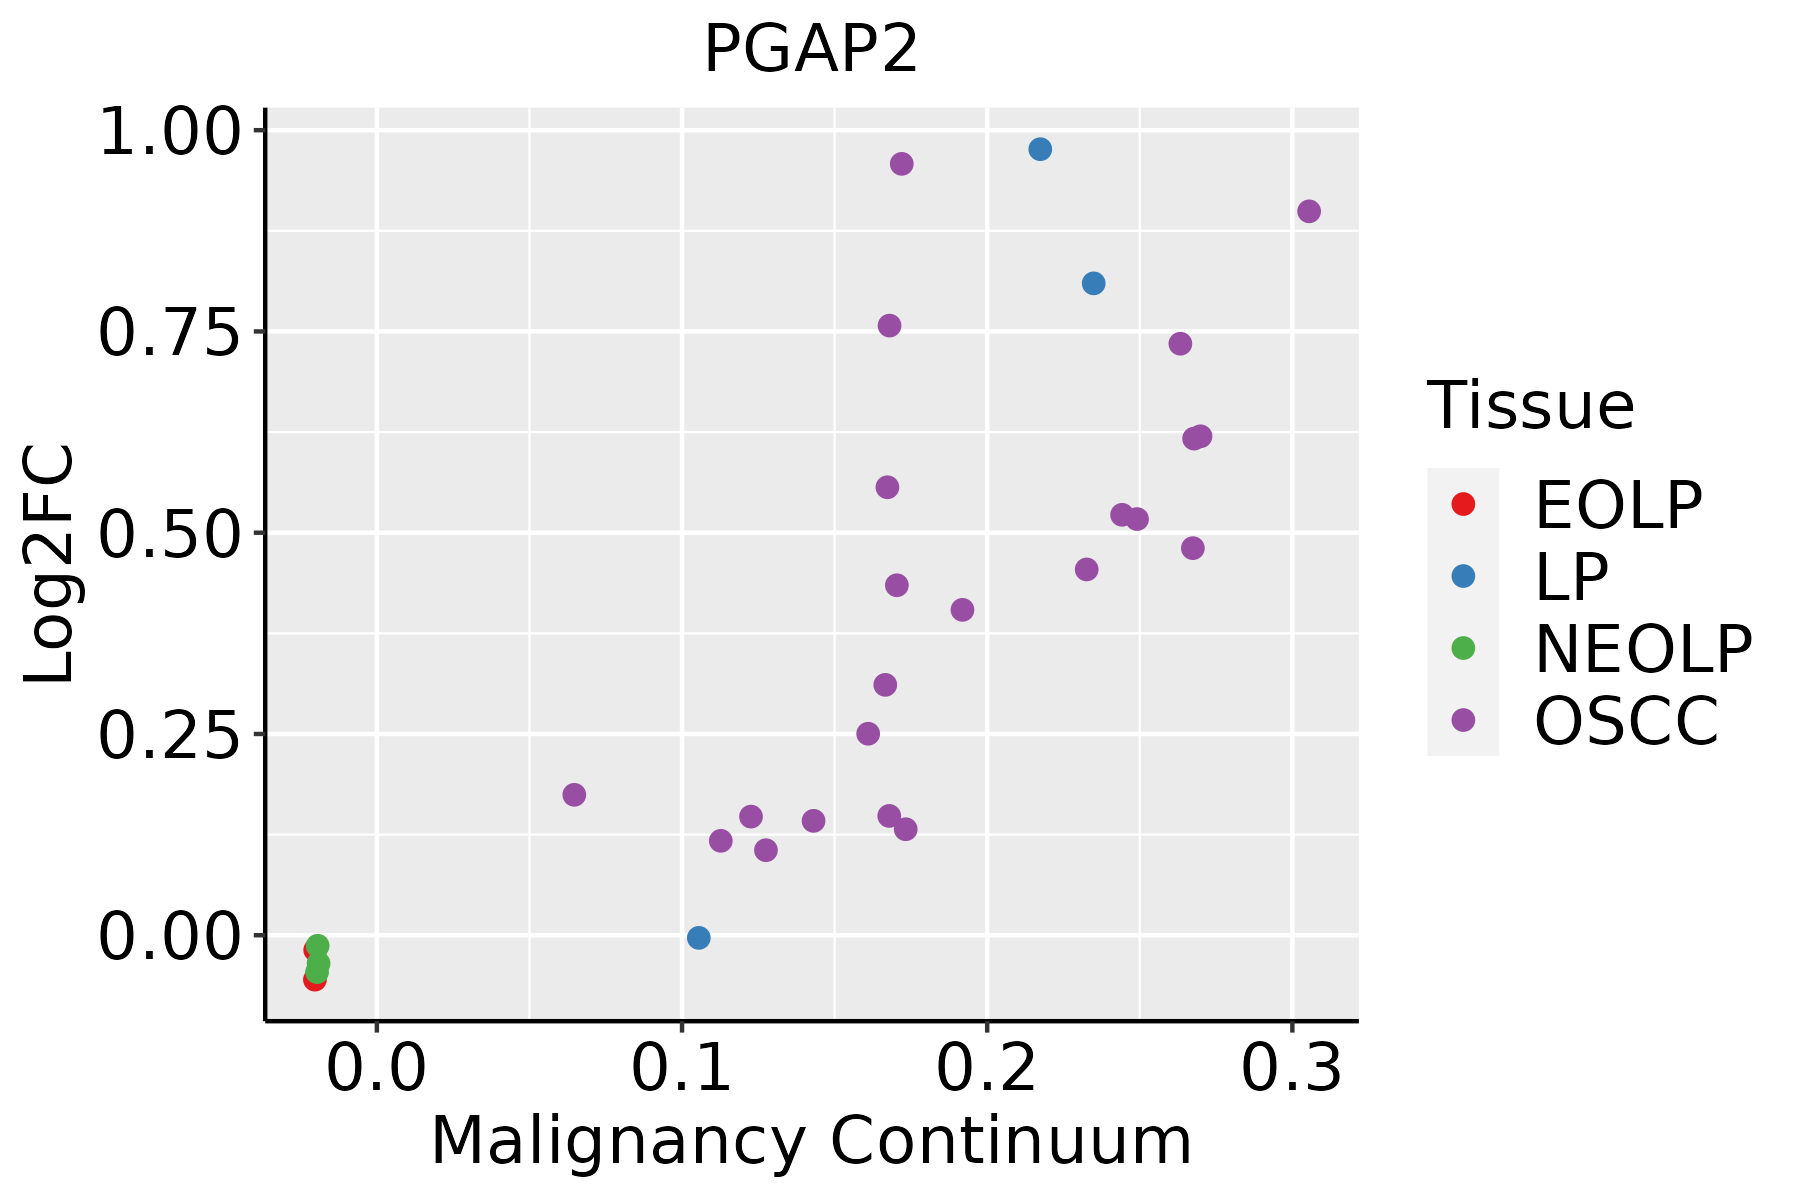 | EOLP: Erosive Oral lichen planus |
| LP: leukoplakia | ||
| NEOLP: Non-erosive oral lichen planus | ||
| OSCC: Oral squamous cell carcinoma | ||
| Skin |  | AK: Actinic keratosis |
| cSCC: Cutaneous squamous cell carcinoma | ||
| SCCIS:squamous cell carcinoma in situ |
| ∗log2FC in expression of this searched gene in stem-like cells from each diseased tissue sample relative to stem-like cells in normal samples in each tissue plotted against the malignancy continuum. Samples are colored based on if they are from different disease stage. |
Top |
Malignant transformation related pathway analysis |
| Find out the enriched GO biological processes and KEGG pathways involved in transition from healthy to precancer to cancer |
| Tissue | Disease Stage | Enriched GO biological Processes |
| Colorectum | AD |  |
| Colorectum | SER |  |
| Colorectum | MSS |  |
| Colorectum | MSI-H |  |
| Colorectum | FAP |  |
| ∗Top 15 enriched GO BP terms are showed in the bar plot of each disease state in each tissue. Each row represents a significant GO biological process which is colored according to the -log10(p.adjust). |
| Page: 1 2 3 4 5 6 7 8 9 |
| GO ID | Tissue | Disease Stage | Description | Gene Ratio | Bg Ratio | pvalue | p.adjust | Count |
| GO:00086544 | Esophagus | ESCC | phospholipid biosynthetic process | 162/8552 | 253/18723 | 2.59e-09 | 5.73e-08 | 162 |
| GO:00464744 | Esophagus | ESCC | glycerophospholipid biosynthetic process | 135/8552 | 211/18723 | 5.75e-08 | 1.02e-06 | 135 |
| GO:00066433 | Esophagus | ESCC | membrane lipid metabolic process | 130/8552 | 203/18723 | 9.29e-08 | 1.54e-06 | 130 |
| GO:00450175 | Esophagus | ESCC | glycerolipid biosynthetic process | 154/8552 | 252/18723 | 5.20e-07 | 6.96e-06 | 154 |
| GO:00066446 | Esophagus | ESCC | phospholipid metabolic process | 218/8552 | 383/18723 | 5.37e-06 | 5.59e-05 | 218 |
| GO:00464673 | Esophagus | ESCC | membrane lipid biosynthetic process | 91/8552 | 142/18723 | 7.19e-06 | 7.19e-05 | 91 |
| GO:00421573 | Esophagus | ESCC | lipoprotein metabolic process | 86/8552 | 135/18723 | 1.78e-05 | 1.57e-04 | 86 |
| GO:00064973 | Esophagus | ESCC | protein lipidation | 62/8552 | 92/18723 | 2.08e-05 | 1.80e-04 | 62 |
| GO:00421583 | Esophagus | ESCC | lipoprotein biosynthetic process | 64/8552 | 96/18723 | 2.61e-05 | 2.20e-04 | 64 |
| GO:00065063 | Esophagus | ESCC | GPI anchor biosynthetic process | 26/8552 | 32/18723 | 3.97e-05 | 3.21e-04 | 26 |
| GO:00066505 | Esophagus | ESCC | glycerophospholipid metabolic process | 174/8552 | 306/18723 | 4.92e-05 | 3.85e-04 | 174 |
| GO:00065053 | Esophagus | ESCC | GPI anchor metabolic process | 26/8552 | 33/18723 | 1.06e-04 | 7.43e-04 | 26 |
| GO:00066642 | Esophagus | ESCC | glycolipid metabolic process | 63/8552 | 100/18723 | 3.55e-04 | 2.06e-03 | 63 |
| GO:19035092 | Esophagus | ESCC | liposaccharide metabolic process | 63/8552 | 101/18723 | 5.25e-04 | 2.90e-03 | 63 |
| GO:00464864 | Esophagus | ESCC | glycerolipid metabolic process | 211/8552 | 392/18723 | 6.51e-04 | 3.46e-03 | 211 |
| GO:0009247 | Esophagus | ESCC | glycolipid biosynthetic process | 42/8552 | 68/18723 | 5.48e-03 | 2.05e-02 | 42 |
| GO:00066611 | Esophagus | ESCC | phosphatidylinositol biosynthetic process | 73/8552 | 131/18723 | 1.31e-02 | 4.28e-02 | 73 |
| GO:00086542 | Liver | HCC | phospholipid biosynthetic process | 150/7958 | 253/18723 | 4.77e-08 | 1.03e-06 | 150 |
| GO:00066444 | Liver | HCC | phospholipid metabolic process | 214/7958 | 383/18723 | 7.25e-08 | 1.48e-06 | 214 |
| GO:004648611 | Liver | HCC | glycerolipid metabolic process | 215/7958 | 392/18723 | 4.54e-07 | 7.49e-06 | 215 |
| Page: 1 2 3 |
| Pathway ID | Tissue | Disease Stage | Description | Gene Ratio | Bg Ratio | pvalue | p.adjust | qvalue | Count |
| Page: 1 |
Top |
Cell-cell communication analysis |
| Identification of potential cell-cell interactions between two cell types and their ligand-receptor pairs for different disease states |
| Ligand | Receptor | LRpair | Pathway | Tissue | Disease Stage |
| Page: 1 |
Top |
Single-cell gene regulatory network inference analysis |
| Find out the significant the regulons (TFs) and the target genes of each regulon across cell types for different disease states |
| TF | Cell Type | Tissue | Disease Stage | Target Gene | RSS | Regulon Activity |
| ∗The dot plots of a searched regulon are shown for all cell subpopulations in each disease state of each tissue based on the regulon specific score inferred using pySCENIC and by calculating the average expression. |
| Page: 1 |
Top |
Somatic mutation of malignant transformation related genes |
| Annotation of somatic variants for genes involved in malignant transformation |
| Hugo Symbol | Variant Class | Variant Classification | dbSNP RS | HGVSc | HGVSp | HGVSp Short | SWISSPROT | BIOTYPE | SIFT | PolyPhen | Tumor Sample Barcode | Tissue | Histology | Sex | Age | Stage | Therapy Types | Drugs | Outcome |
| PGAP2 | SNV | Missense_Mutation | rs753497329 | c.869N>T | p.Ala290Val | p.A290V | Q9UHJ9 | protein_coding | deleterious(0) | probably_damaging(0.97) | TCGA-AO-A128-01 | Breast | breast invasive carcinoma | Female | <65 | I/II | Chemotherapy | doxorubicin | SD |
| PGAP2 | SNV | Missense_Mutation | rs771209213 | c.550N>A | p.Glu184Lys | p.E184K | Q9UHJ9 | protein_coding | deleterious(0) | probably_damaging(1) | TCGA-BH-A2L8-01 | Breast | breast invasive carcinoma | Female | <65 | I/II | Chemotherapy | cytoxan | CR |
| PGAP2 | deletion | Frame_Shift_Del | novel | c.213delC | p.Asp72MetfsTer53 | p.D72Mfs*53 | Q9UHJ9 | protein_coding | TCGA-EW-A2FV-01 | Breast | breast invasive carcinoma | Female | <65 | III/IV | Chemotherapy | docetaxel | SD | ||
| PGAP2 | SNV | Missense_Mutation | rs771209213 | c.550N>A | p.Glu184Lys | p.E184K | Q9UHJ9 | protein_coding | deleterious(0) | probably_damaging(1) | TCGA-C5-A1BQ-01 | Cervix | cervical & endocervical cancer | Female | >=65 | III/IV | Chemotherapy | cisplatin | CR |
| PGAP2 | SNV | Missense_Mutation | rs766716423 | c.770N>T | p.Ser257Leu | p.S257L | Q9UHJ9 | protein_coding | tolerated(0.79) | benign(0.003) | TCGA-DG-A2KH-01 | Cervix | cervical & endocervical cancer | Female | <65 | I/II | Unknown | Unknown | SD |
| PGAP2 | SNV | Missense_Mutation | c.676C>T | p.Arg226Trp | p.R226W | Q9UHJ9 | protein_coding | deleterious(0.03) | probably_damaging(0.971) | TCGA-A6-6141-01 | Colorectum | colon adenocarcinoma | Male | <65 | I/II | Chemotherapy | 5-fu | SD | |
| PGAP2 | SNV | Missense_Mutation | c.335C>T | p.Ala112Val | p.A112V | Q9UHJ9 | protein_coding | tolerated(0.35) | possibly_damaging(0.663) | TCGA-AA-3819-01 | Colorectum | colon adenocarcinoma | Female | <65 | I/II | Unknown | Unknown | SD | |
| PGAP2 | SNV | Missense_Mutation | novel | c.718N>G | p.Ser240Ala | p.S240A | Q9UHJ9 | protein_coding | deleterious(0.04) | probably_damaging(0.927) | TCGA-AA-3982-01 | Colorectum | colon adenocarcinoma | Male | >=65 | III/IV | Unknown | Unknown | SD |
| PGAP2 | SNV | Missense_Mutation | novel | c.893N>C | p.Asp298Ala | p.D298A | Q9UHJ9 | protein_coding | deleterious(0) | probably_damaging(1) | TCGA-AA-3982-01 | Colorectum | colon adenocarcinoma | Male | >=65 | III/IV | Unknown | Unknown | SD |
| PGAP2 | SNV | Missense_Mutation | c.186N>A | p.Phe62Leu | p.F62L | Q9UHJ9 | protein_coding | tolerated(0.9) | benign(0) | TCGA-AG-A002-01 | Colorectum | rectum adenocarcinoma | Male | <65 | I/II | Unknown | Unknown | SD |
| Page: 1 2 3 4 |
Top |
Related drugs of malignant transformation related genes |
| Identification of chemicals and drugs interact with genes involved in malignant transfromation |
| (DGIdb 4.0) |
| Entrez ID | Symbol | Category | Interaction Types | Drug Claim Name | Drug Name | PMIDs |
| Page: 1 |

Copyright 2023-Present -The University of Texas Health Science Center at Houston |