
|
|||||
|
 | |
| |
| |
| |
| |
| |
|
Gene: PGAP1 |
Gene summary for PGAP1 |
| Gene information | Species | Human | Gene symbol | PGAP1 | Gene ID | 80055 |
| Gene name | post-GPI attachment to proteins inositol deacylase 1 | |
| Gene Alias | Bst1 | |
| Cytomap | 2q33.1 | |
| Gene Type | protein-coding | GO ID | GO:0003002 | UniProtAcc | Q75T13 |
Top |
Malignant transformation analysis |
| Identification of the aberrant gene expression in precancerous and cancerous lesions by comparing the gene expression of stem-like cells in diseased tissues with normal stem cells |
| Entrez ID | Symbol | Replicates | Species | Organ | Tissue | Adj P-value | Log2FC | Malignancy |
| 80055 | PGAP1 | HTA11_3410_2000001011 | Human | Colorectum | AD | 2.02e-02 | -2.85e-01 | 0.0155 |
| 80055 | PGAP1 | HTA11_2487_2000001011 | Human | Colorectum | SER | 1.41e-06 | -5.37e-01 | -0.1808 |
| 80055 | PGAP1 | HTA11_3361_2000001011 | Human | Colorectum | AD | 3.97e-04 | -5.15e-01 | -0.1207 |
| 80055 | PGAP1 | HTA11_83_2000001011 | Human | Colorectum | SER | 1.33e-05 | -5.97e-01 | -0.1526 |
| 80055 | PGAP1 | HTA11_696_2000001011 | Human | Colorectum | AD | 1.22e-13 | -4.70e-01 | -0.1464 |
| 80055 | PGAP1 | HTA11_866_2000001011 | Human | Colorectum | AD | 1.62e-11 | -4.85e-01 | -0.1001 |
| 80055 | PGAP1 | HTA11_2992_2000001011 | Human | Colorectum | SER | 4.81e-02 | -6.06e-01 | -0.1706 |
| 80055 | PGAP1 | HTA11_5212_2000001011 | Human | Colorectum | AD | 4.39e-04 | -6.66e-01 | -0.2061 |
| 80055 | PGAP1 | HTA11_10711_2000001011 | Human | Colorectum | AD | 1.41e-03 | -4.68e-01 | 0.0338 |
| 80055 | PGAP1 | HTA11_7696_3000711011 | Human | Colorectum | AD | 2.67e-14 | -5.11e-01 | 0.0674 |
| 80055 | PGAP1 | HTA11_6818_2000001011 | Human | Colorectum | AD | 1.08e-03 | -6.13e-01 | 0.0112 |
| 80055 | PGAP1 | HTA11_99999971662_82457 | Human | Colorectum | MSS | 3.56e-04 | -3.21e-01 | 0.3859 |
| 80055 | PGAP1 | HTA11_99999973899_84307 | Human | Colorectum | MSS | 5.45e-03 | -5.04e-01 | 0.2585 |
| 80055 | PGAP1 | HTA11_99999974143_84620 | Human | Colorectum | MSS | 2.19e-20 | -5.55e-01 | 0.3005 |
| 80055 | PGAP1 | F007 | Human | Colorectum | FAP | 5.58e-04 | -4.14e-01 | 0.1176 |
| 80055 | PGAP1 | A015-C-203 | Human | Colorectum | FAP | 1.39e-24 | -4.03e-01 | -0.1294 |
| 80055 | PGAP1 | A015-C-204 | Human | Colorectum | FAP | 9.42e-08 | -3.72e-01 | -0.0228 |
| 80055 | PGAP1 | A014-C-040 | Human | Colorectum | FAP | 5.30e-04 | -4.42e-01 | -0.1184 |
| 80055 | PGAP1 | A002-C-201 | Human | Colorectum | FAP | 8.73e-10 | -2.39e-01 | 0.0324 |
| 80055 | PGAP1 | A001-C-119 | Human | Colorectum | FAP | 4.49e-05 | -3.64e-01 | -0.1557 |
| Page: 1 2 3 4 5 6 7 |
| Tissue | Expression Dynamics | Abbreviation |
| Colorectum (GSE201348) |  | FAP: Familial adenomatous polyposis |
| CRC: Colorectal cancer | ||
| Colorectum (HTA11) |  | AD: Adenomas |
| SER: Sessile serrated lesions | ||
| MSI-H: Microsatellite-high colorectal cancer | ||
| MSS: Microsatellite stable colorectal cancer | ||
| Esophagus | 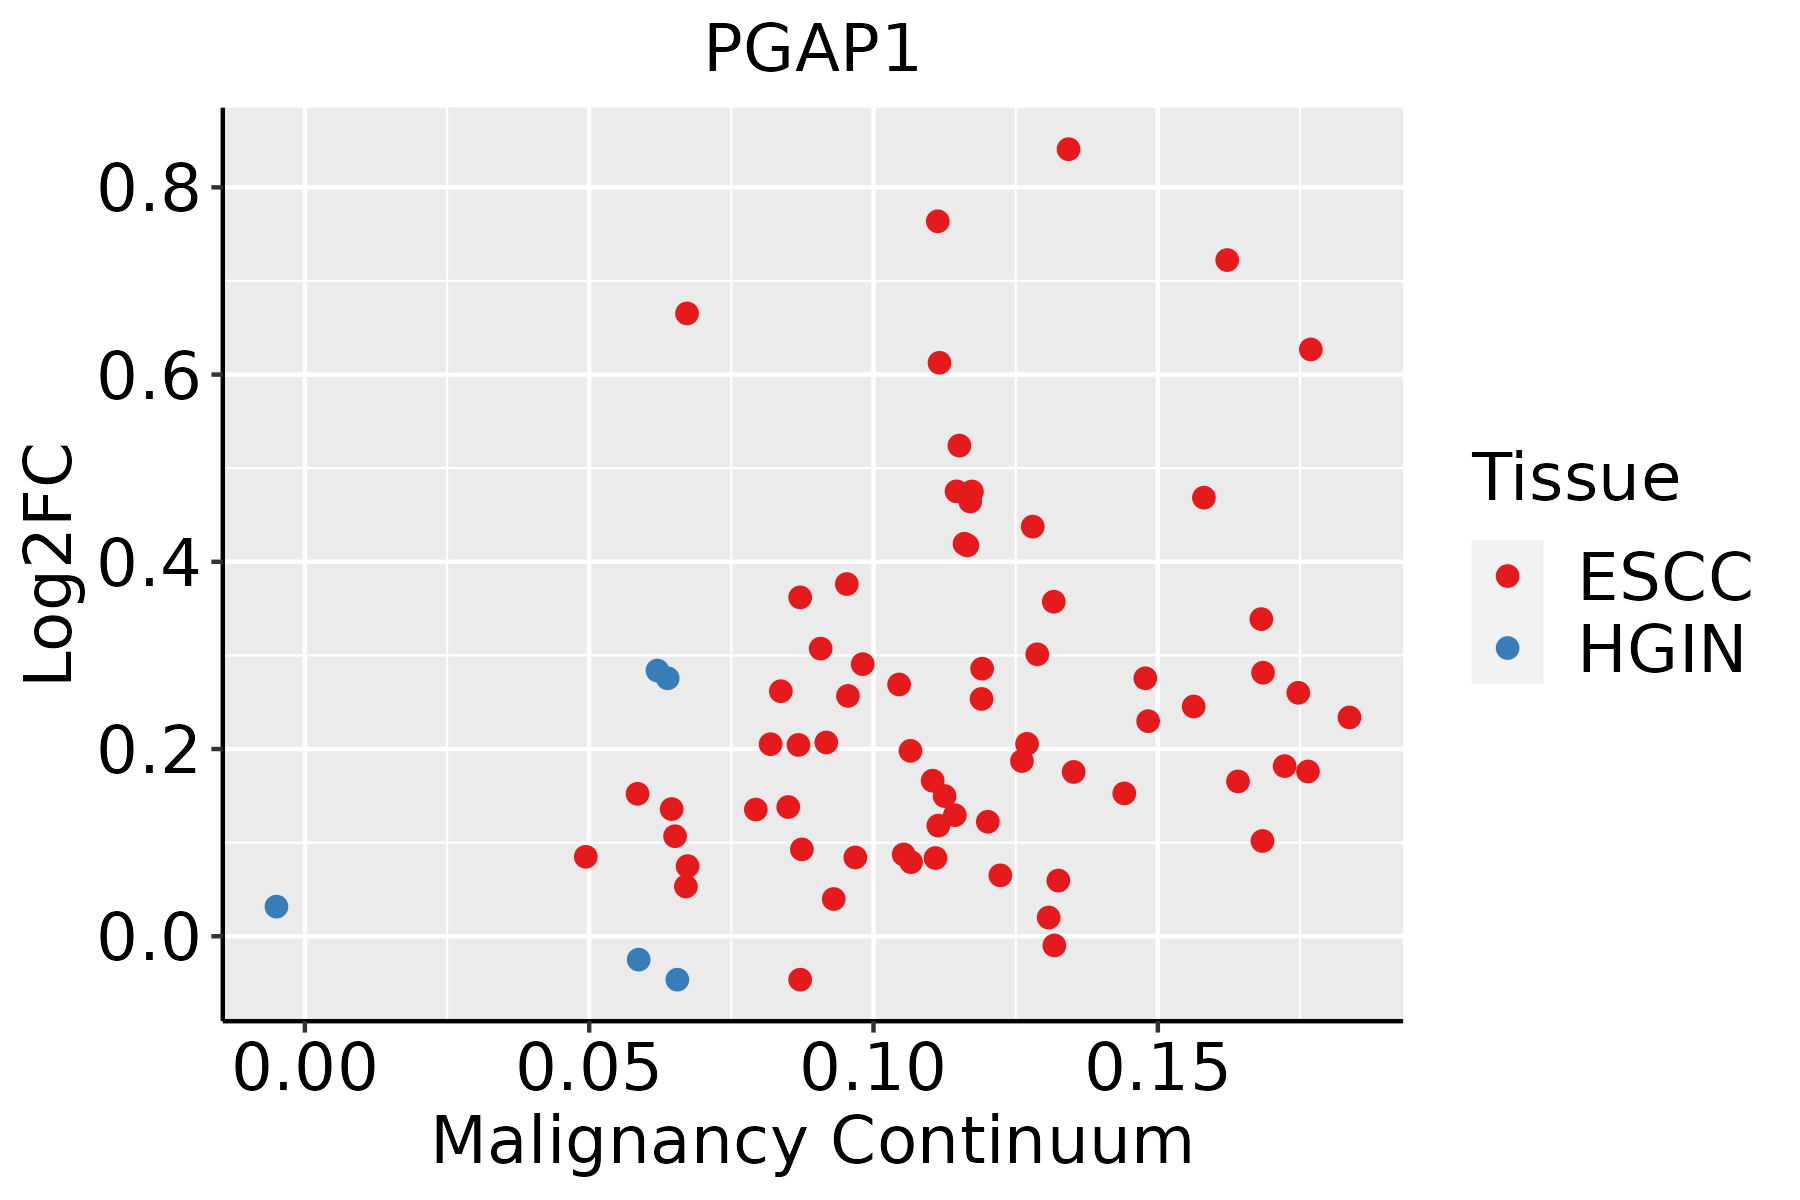 | ESCC: Esophageal squamous cell carcinoma |
| HGIN: High-grade intraepithelial neoplasias | ||
| LGIN: Low-grade intraepithelial neoplasias | ||
| Oral Cavity | 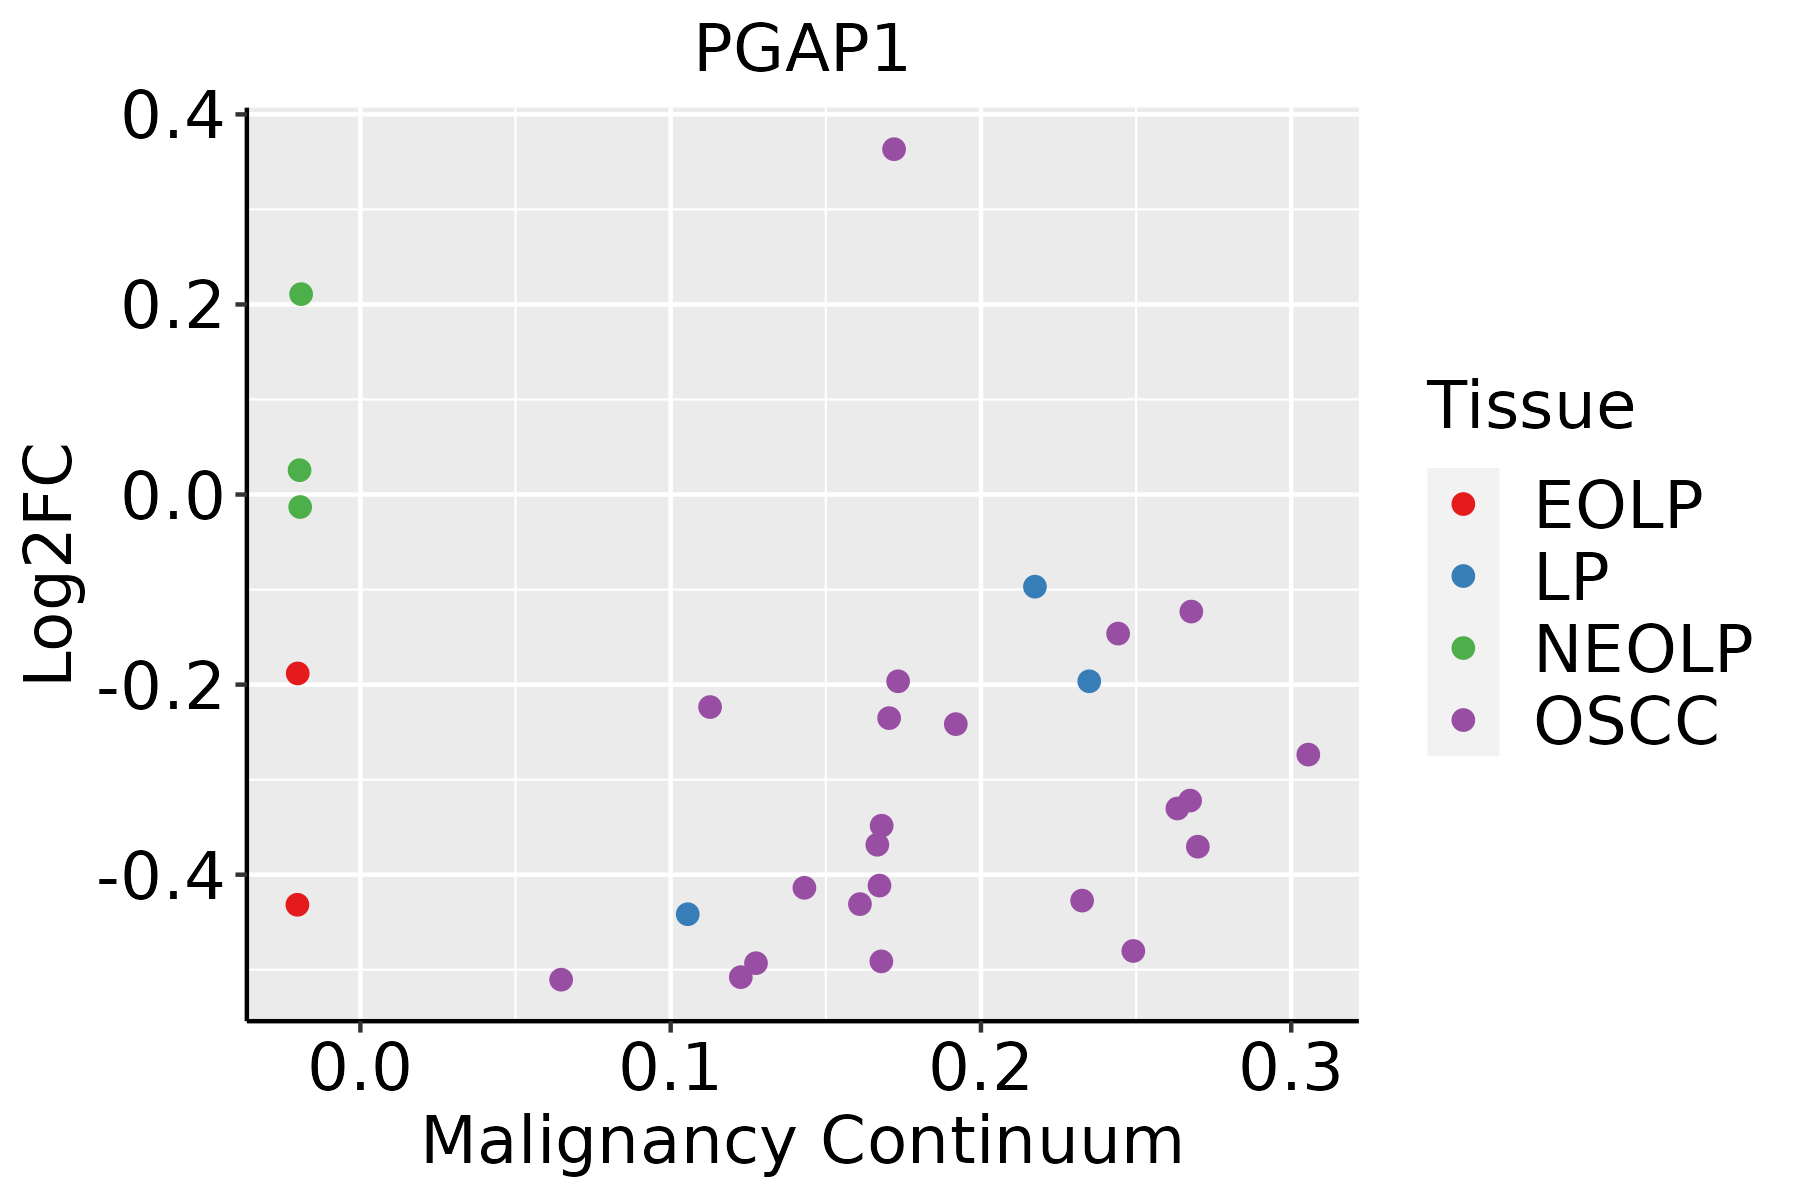 | EOLP: Erosive Oral lichen planus |
| LP: leukoplakia | ||
| NEOLP: Non-erosive oral lichen planus | ||
| OSCC: Oral squamous cell carcinoma | ||
| Prostate | 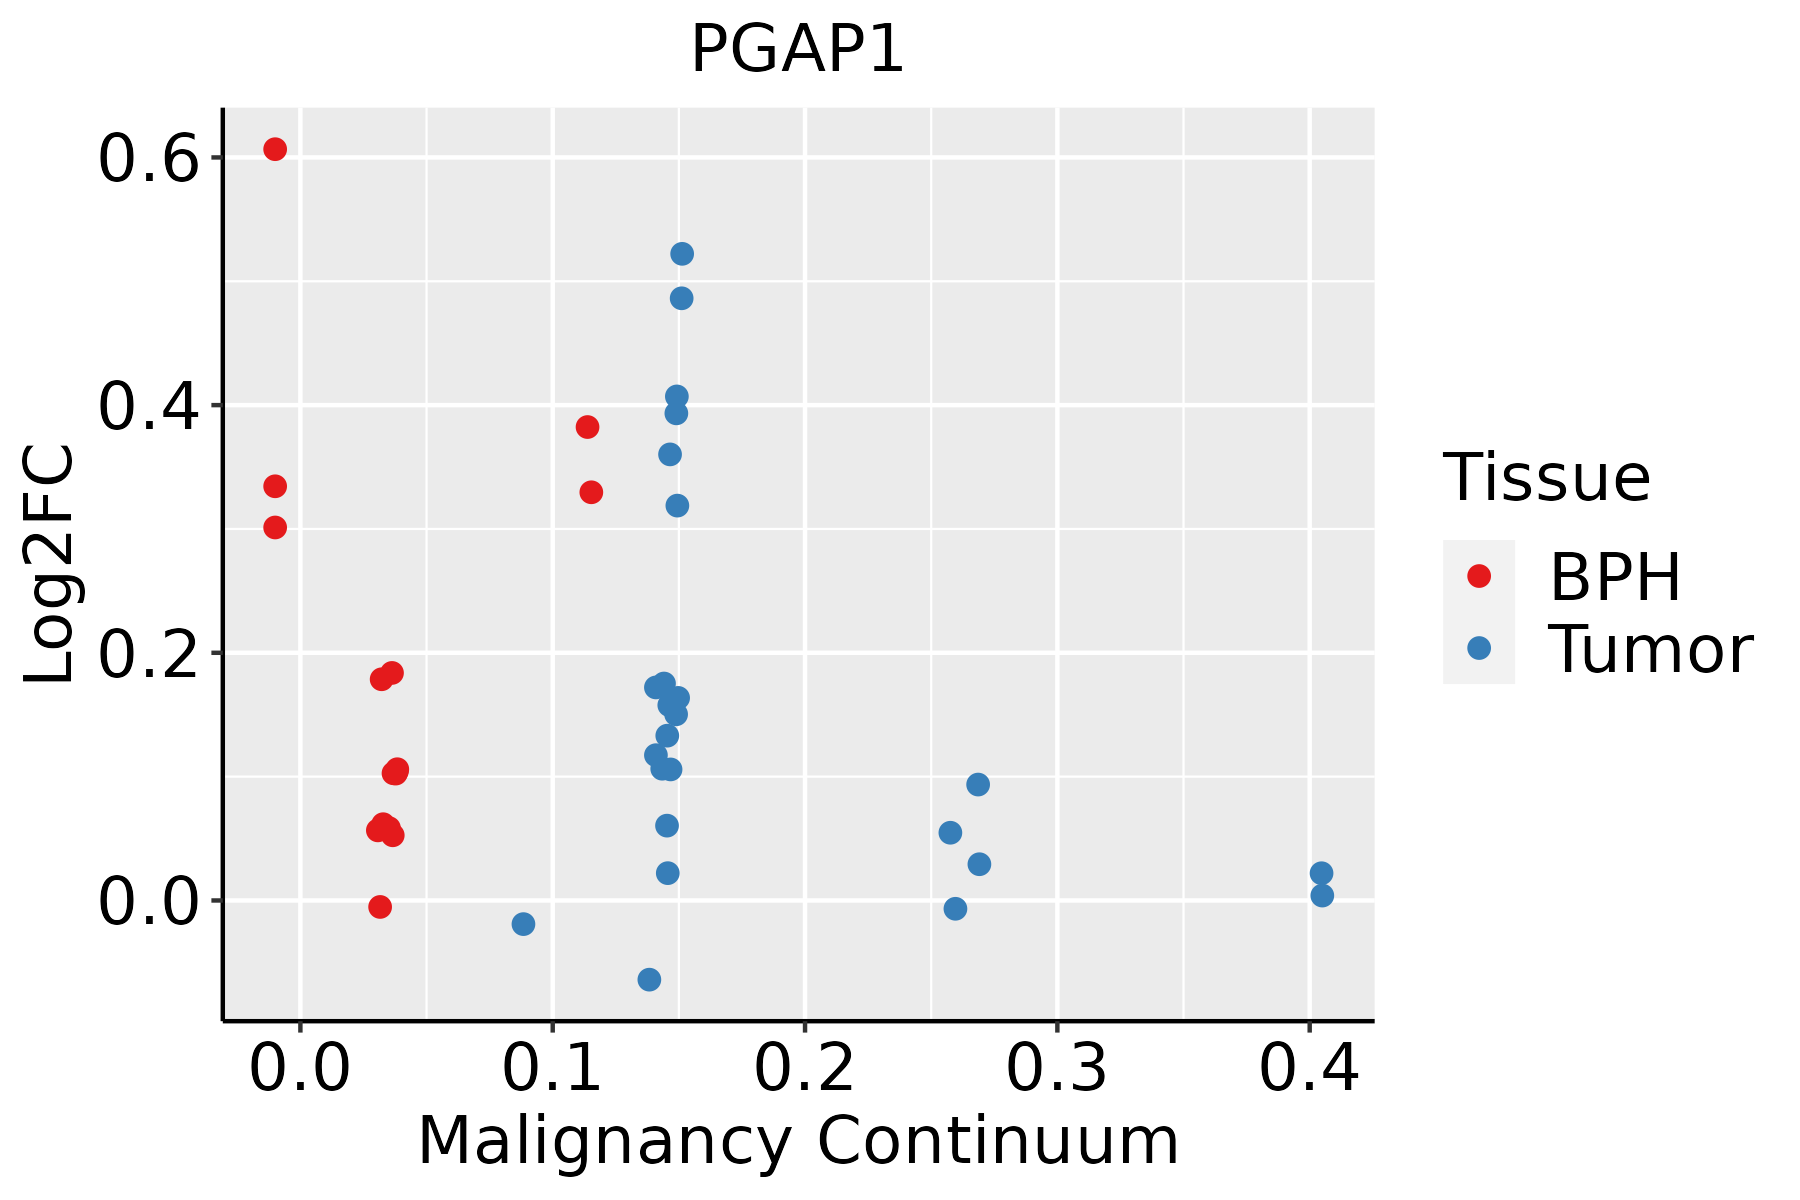 | BPH: Benign Prostatic Hyperplasia |
| Thyroid |  | ATC: Anaplastic thyroid cancer |
| HT: Hashimoto's thyroiditis | ||
| PTC: Papillary thyroid cancer |
| ∗log2FC in expression of this searched gene in stem-like cells from each diseased tissue sample relative to stem-like cells in normal samples in each tissue plotted against the malignancy continuum. Samples are colored based on if they are from different disease stage. |
Top |
Malignant transformation related pathway analysis |
| Find out the enriched GO biological processes and KEGG pathways involved in transition from healthy to precancer to cancer |
| Tissue | Disease Stage | Enriched GO biological Processes |
| Colorectum | AD |  |
| Colorectum | SER |  |
| Colorectum | MSS |  |
| Colorectum | MSI-H |  |
| Colorectum | FAP |  |
| ∗Top 15 enriched GO BP terms are showed in the bar plot of each disease state in each tissue. Each row represents a significant GO biological process which is colored according to the -log10(p.adjust). |
| Page: 1 2 3 4 5 6 7 8 9 |
| GO ID | Tissue | Disease Stage | Description | Gene Ratio | Bg Ratio | pvalue | p.adjust | Count |
| GO:0048193 | Colorectum | AD | Golgi vesicle transport | 109/3918 | 296/18723 | 1.80e-10 | 1.68e-08 | 109 |
| GO:0032388 | Colorectum | AD | positive regulation of intracellular transport | 74/3918 | 202/18723 | 1.83e-07 | 7.80e-06 | 74 |
| GO:0032386 | Colorectum | AD | regulation of intracellular transport | 109/3918 | 337/18723 | 5.33e-07 | 1.95e-05 | 109 |
| GO:0006888 | Colorectum | AD | endoplasmic reticulum to Golgi vesicle-mediated transport | 44/3918 | 130/18723 | 4.13e-04 | 4.68e-03 | 44 |
| GO:0006650 | Colorectum | AD | glycerophospholipid metabolic process | 83/3918 | 306/18723 | 5.40e-03 | 3.55e-02 | 83 |
| GO:0006644 | Colorectum | AD | phospholipid metabolic process | 101/3918 | 383/18723 | 5.80e-03 | 3.67e-02 | 101 |
| GO:0045017 | Colorectum | AD | glycerolipid biosynthetic process | 69/3918 | 252/18723 | 8.33e-03 | 4.88e-02 | 69 |
| GO:00323861 | Colorectum | SER | regulation of intracellular transport | 89/2897 | 337/18723 | 1.34e-07 | 7.96e-06 | 89 |
| GO:00481931 | Colorectum | SER | Golgi vesicle transport | 79/2897 | 296/18723 | 4.20e-07 | 2.15e-05 | 79 |
| GO:00323881 | Colorectum | SER | positive regulation of intracellular transport | 59/2897 | 202/18723 | 4.98e-07 | 2.48e-05 | 59 |
| GO:00068881 | Colorectum | SER | endoplasmic reticulum to Golgi vesicle-mediated transport | 34/2897 | 130/18723 | 1.13e-03 | 1.29e-02 | 34 |
| GO:0046486 | Colorectum | SER | glycerolipid metabolic process | 82/2897 | 392/18723 | 2.26e-03 | 2.17e-02 | 82 |
| GO:00066441 | Colorectum | SER | phospholipid metabolic process | 79/2897 | 383/18723 | 3.94e-03 | 3.24e-02 | 79 |
| GO:00450171 | Colorectum | SER | glycerolipid biosynthetic process | 55/2897 | 252/18723 | 4.47e-03 | 3.56e-02 | 55 |
| GO:00066501 | Colorectum | SER | glycerophospholipid metabolic process | 64/2897 | 306/18723 | 6.41e-03 | 4.60e-02 | 64 |
| GO:00481932 | Colorectum | MSS | Golgi vesicle transport | 101/3467 | 296/18723 | 9.09e-11 | 9.77e-09 | 101 |
| GO:00323882 | Colorectum | MSS | positive regulation of intracellular transport | 70/3467 | 202/18723 | 3.32e-08 | 1.82e-06 | 70 |
| GO:00323862 | Colorectum | MSS | regulation of intracellular transport | 102/3467 | 337/18723 | 9.73e-08 | 4.71e-06 | 102 |
| GO:00068882 | Colorectum | MSS | endoplasmic reticulum to Golgi vesicle-mediated transport | 44/3467 | 130/18723 | 2.17e-05 | 4.60e-04 | 44 |
| GO:00481934 | Colorectum | FAP | Golgi vesicle transport | 77/2622 | 296/18723 | 2.86e-08 | 2.62e-06 | 77 |
| Page: 1 2 3 4 5 6 |
| Pathway ID | Tissue | Disease Stage | Description | Gene Ratio | Bg Ratio | pvalue | p.adjust | qvalue | Count |
| hsa005632 | Esophagus | ESCC | Glycosylphosphatidylinositol (GPI)-anchor biosynthesis | 21/4205 | 26/8465 | 1.10e-03 | 3.42e-03 | 1.75e-03 | 21 |
| hsa0056311 | Esophagus | ESCC | Glycosylphosphatidylinositol (GPI)-anchor biosynthesis | 21/4205 | 26/8465 | 1.10e-03 | 3.42e-03 | 1.75e-03 | 21 |
| Page: 1 |
Top |
Cell-cell communication analysis |
| Identification of potential cell-cell interactions between two cell types and their ligand-receptor pairs for different disease states |
| Ligand | Receptor | LRpair | Pathway | Tissue | Disease Stage |
| Page: 1 |
Top |
Single-cell gene regulatory network inference analysis |
| Find out the significant the regulons (TFs) and the target genes of each regulon across cell types for different disease states |
| TF | Cell Type | Tissue | Disease Stage | Target Gene | RSS | Regulon Activity |
| ∗The dot plots of a searched regulon are shown for all cell subpopulations in each disease state of each tissue based on the regulon specific score inferred using pySCENIC and by calculating the average expression. |
| Page: 1 |
Top |
Somatic mutation of malignant transformation related genes |
| Annotation of somatic variants for genes involved in malignant transformation |
| Hugo Symbol | Variant Class | Variant Classification | dbSNP RS | HGVSc | HGVSp | HGVSp Short | SWISSPROT | BIOTYPE | SIFT | PolyPhen | Tumor Sample Barcode | Tissue | Histology | Sex | Age | Stage | Therapy Types | Drugs | Outcome |
| PGAP1 | SNV | Missense_Mutation | c.2161N>T | p.Leu721Phe | p.L721F | Q75T13 | protein_coding | tolerated(0.09) | benign(0.4) | TCGA-A8-A06X-01 | Breast | breast invasive carcinoma | Female | >=65 | I/II | Unknown | Unknown | SD | |
| PGAP1 | SNV | Missense_Mutation | c.812N>T | p.Ser271Leu | p.S271L | Q75T13 | protein_coding | deleterious(0) | possibly_damaging(0.858) | TCGA-AC-A23H-01 | Breast | breast invasive carcinoma | Female | >=65 | I/II | Unknown | Unknown | PD | |
| PGAP1 | SNV | Missense_Mutation | c.329N>C | p.Arg110Thr | p.R110T | Q75T13 | protein_coding | deleterious(0) | probably_damaging(0.998) | TCGA-AC-A23H-01 | Breast | breast invasive carcinoma | Female | >=65 | I/II | Unknown | Unknown | PD | |
| PGAP1 | SNV | Missense_Mutation | c.1371N>A | p.Phe457Leu | p.F457L | Q75T13 | protein_coding | tolerated(0.21) | probably_damaging(0.931) | TCGA-AN-A046-01 | Breast | breast invasive carcinoma | Female | >=65 | I/II | Unknown | Unknown | SD | |
| PGAP1 | SNV | Missense_Mutation | c.945N>T | p.Lys315Asn | p.K315N | Q75T13 | protein_coding | deleterious(0.03) | probably_damaging(0.987) | TCGA-AN-A046-01 | Breast | breast invasive carcinoma | Female | >=65 | I/II | Unknown | Unknown | SD | |
| PGAP1 | SNV | Missense_Mutation | c.1520N>A | p.Ile507Asn | p.I507N | Q75T13 | protein_coding | deleterious(0) | benign(0.394) | TCGA-AN-A0AK-01 | Breast | breast invasive carcinoma | Female | >=65 | I/II | Unknown | Unknown | SD | |
| PGAP1 | SNV | Missense_Mutation | c.2336N>C | p.Val779Ala | p.V779A | Q75T13 | protein_coding | tolerated(0.75) | benign(0) | TCGA-BH-A0DQ-01 | Breast | breast invasive carcinoma | Female | <65 | I/II | Chemotherapy | doxorubicin | SD | |
| PGAP1 | SNV | Missense_Mutation | c.1339C>T | p.Arg447Cys | p.R447C | Q75T13 | protein_coding | deleterious(0.04) | benign(0.083) | TCGA-BH-A1EY-01 | Breast | breast invasive carcinoma | Female | >=65 | I/II | Unknown | Unknown | PD | |
| PGAP1 | SNV | Missense_Mutation | c.2621T>C | p.Ile874Thr | p.I874T | Q75T13 | protein_coding | deleterious(0.01) | benign(0.022) | TCGA-E2-A1IG-01 | Breast | breast invasive carcinoma | Female | <65 | I/II | Chemotherapy | cyclophosphamide | SD | |
| PGAP1 | SNV | Missense_Mutation | novel | c.2111C>A | p.Ser704Tyr | p.S704Y | Q75T13 | protein_coding | tolerated(0.23) | benign(0.049) | TCGA-2W-A8YY-01 | Cervix | cervical & endocervical cancer | Female | <65 | I/II | Chemotherapy | cisplatin | CR |
| Page: 1 2 3 4 5 6 7 8 9 10 11 |
Top |
Related drugs of malignant transformation related genes |
| Identification of chemicals and drugs interact with genes involved in malignant transfromation |
| (DGIdb 4.0) |
| Entrez ID | Symbol | Category | Interaction Types | Drug Claim Name | Drug Name | PMIDs |
| Page: 1 |

Copyright 2023-Present -The University of Texas Health Science Center at Houston |