
|
|||||
|
 | |
| |
| |
| |
| |
| |
|
Gene: PGAM1 |
Gene summary for PGAM1 |
| Gene information | Species | Human | Gene symbol | PGAM1 | Gene ID | 5223 |
| Gene name | phosphoglycerate mutase 1 | |
| Gene Alias | HEL-S-35 | |
| Cytomap | 10q24.1 | |
| Gene Type | protein-coding | GO ID | GO:0005975 | UniProtAcc | B7Z9E5 |
Top |
Malignant transformation analysis |
| Identification of the aberrant gene expression in precancerous and cancerous lesions by comparing the gene expression of stem-like cells in diseased tissues with normal stem cells |
| Entrez ID | Symbol | Replicates | Species | Organ | Tissue | Adj P-value | Log2FC | Malignancy |
| 5223 | PGAM1 | GSM4909281 | Human | Breast | IDC | 5.05e-04 | 3.61e-01 | 0.21 |
| 5223 | PGAM1 | GSM4909282 | Human | Breast | IDC | 1.08e-17 | 5.26e-01 | -0.0288 |
| 5223 | PGAM1 | GSM4909285 | Human | Breast | IDC | 1.10e-08 | 4.07e-01 | 0.21 |
| 5223 | PGAM1 | GSM4909286 | Human | Breast | IDC | 7.87e-05 | -1.97e-01 | 0.1081 |
| 5223 | PGAM1 | GSM4909288 | Human | Breast | IDC | 9.18e-03 | -2.11e-01 | 0.0988 |
| 5223 | PGAM1 | GSM4909294 | Human | Breast | IDC | 7.00e-03 | -8.06e-02 | 0.2022 |
| 5223 | PGAM1 | GSM4909296 | Human | Breast | IDC | 2.11e-09 | -1.21e-01 | 0.1524 |
| 5223 | PGAM1 | GSM4909297 | Human | Breast | IDC | 4.49e-10 | -1.74e-01 | 0.1517 |
| 5223 | PGAM1 | GSM4909301 | Human | Breast | IDC | 1.30e-02 | -2.06e-01 | 0.1577 |
| 5223 | PGAM1 | GSM4909309 | Human | Breast | IDC | 2.41e-04 | -2.64e-01 | 0.0483 |
| 5223 | PGAM1 | GSM4909311 | Human | Breast | IDC | 9.23e-33 | -2.47e-01 | 0.1534 |
| 5223 | PGAM1 | GSM4909312 | Human | Breast | IDC | 6.42e-12 | -2.04e-02 | 0.1552 |
| 5223 | PGAM1 | GSM4909313 | Human | Breast | IDC | 3.56e-02 | -1.62e-01 | 0.0391 |
| 5223 | PGAM1 | GSM4909315 | Human | Breast | IDC | 6.31e-08 | 3.89e-01 | 0.21 |
| 5223 | PGAM1 | GSM4909316 | Human | Breast | IDC | 2.65e-08 | 3.20e-01 | 0.21 |
| 5223 | PGAM1 | GSM4909319 | Human | Breast | IDC | 7.42e-42 | -2.56e-01 | 0.1563 |
| 5223 | PGAM1 | GSM4909320 | Human | Breast | IDC | 1.55e-07 | -3.94e-01 | 0.1575 |
| 5223 | PGAM1 | GSM4909321 | Human | Breast | IDC | 1.51e-18 | -2.30e-02 | 0.1559 |
| 5223 | PGAM1 | ctrl6 | Human | Breast | Precancer | 7.94e-14 | 7.06e-01 | -0.0061 |
| 5223 | PGAM1 | brca1 | Human | Breast | Precancer | 1.08e-08 | 3.76e-01 | -0.0338 |
| Page: 1 2 3 4 5 6 7 8 9 10 |
| Tissue | Expression Dynamics | Abbreviation |
| Breast |  | IDC: Invasive ductal carcinoma |
| DCIS: Ductal carcinoma in situ | ||
| Precancer(BRCA1-mut): Precancerous lesion from BRCA1 mutation carriers | ||
| Cervix | 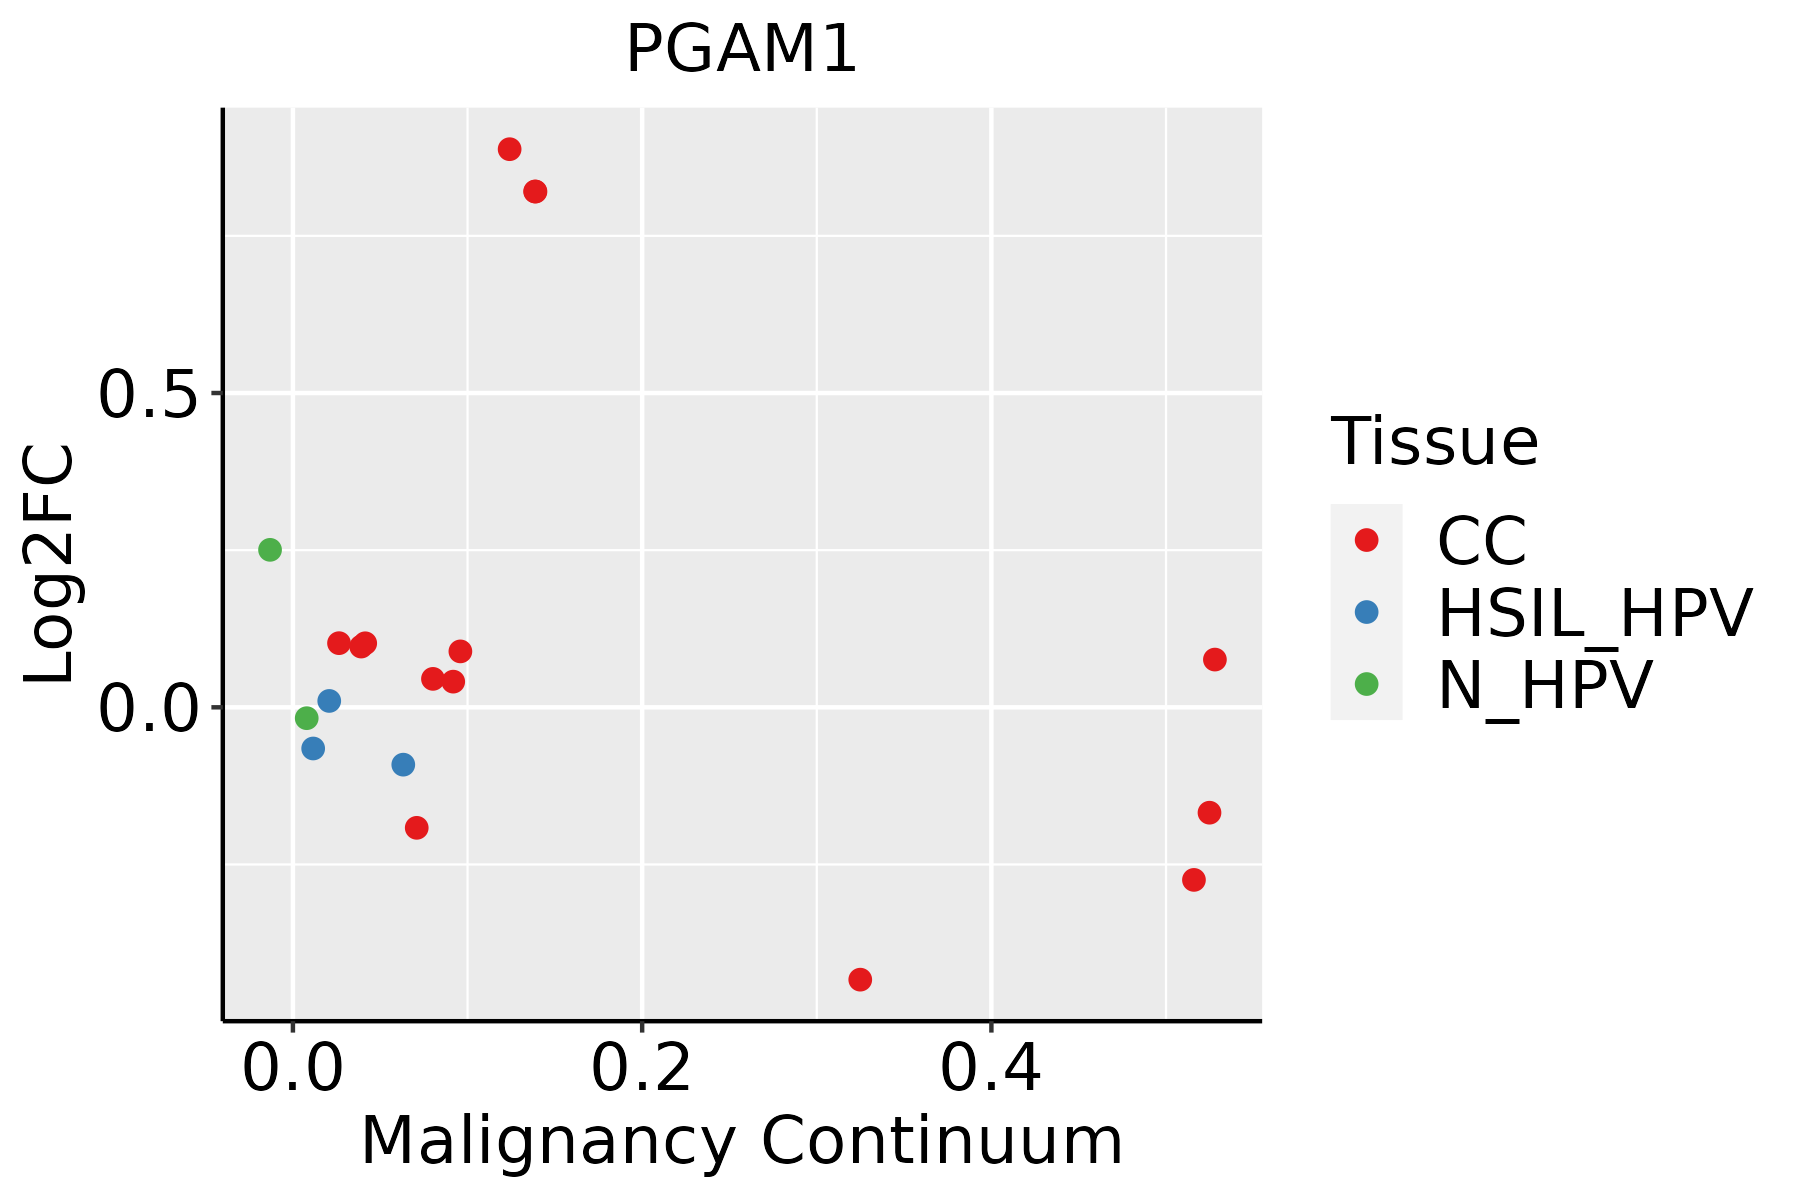 | CC: Cervix cancer |
| HSIL_HPV: HPV-infected high-grade squamous intraepithelial lesions | ||
| N_HPV: HPV-infected normal cervix | ||
| Colorectum (GSE201348) |  | FAP: Familial adenomatous polyposis |
| CRC: Colorectal cancer | ||
| Colorectum (HTA11) |  | AD: Adenomas |
| SER: Sessile serrated lesions | ||
| MSI-H: Microsatellite-high colorectal cancer | ||
| MSS: Microsatellite stable colorectal cancer | ||
| Endometrium | 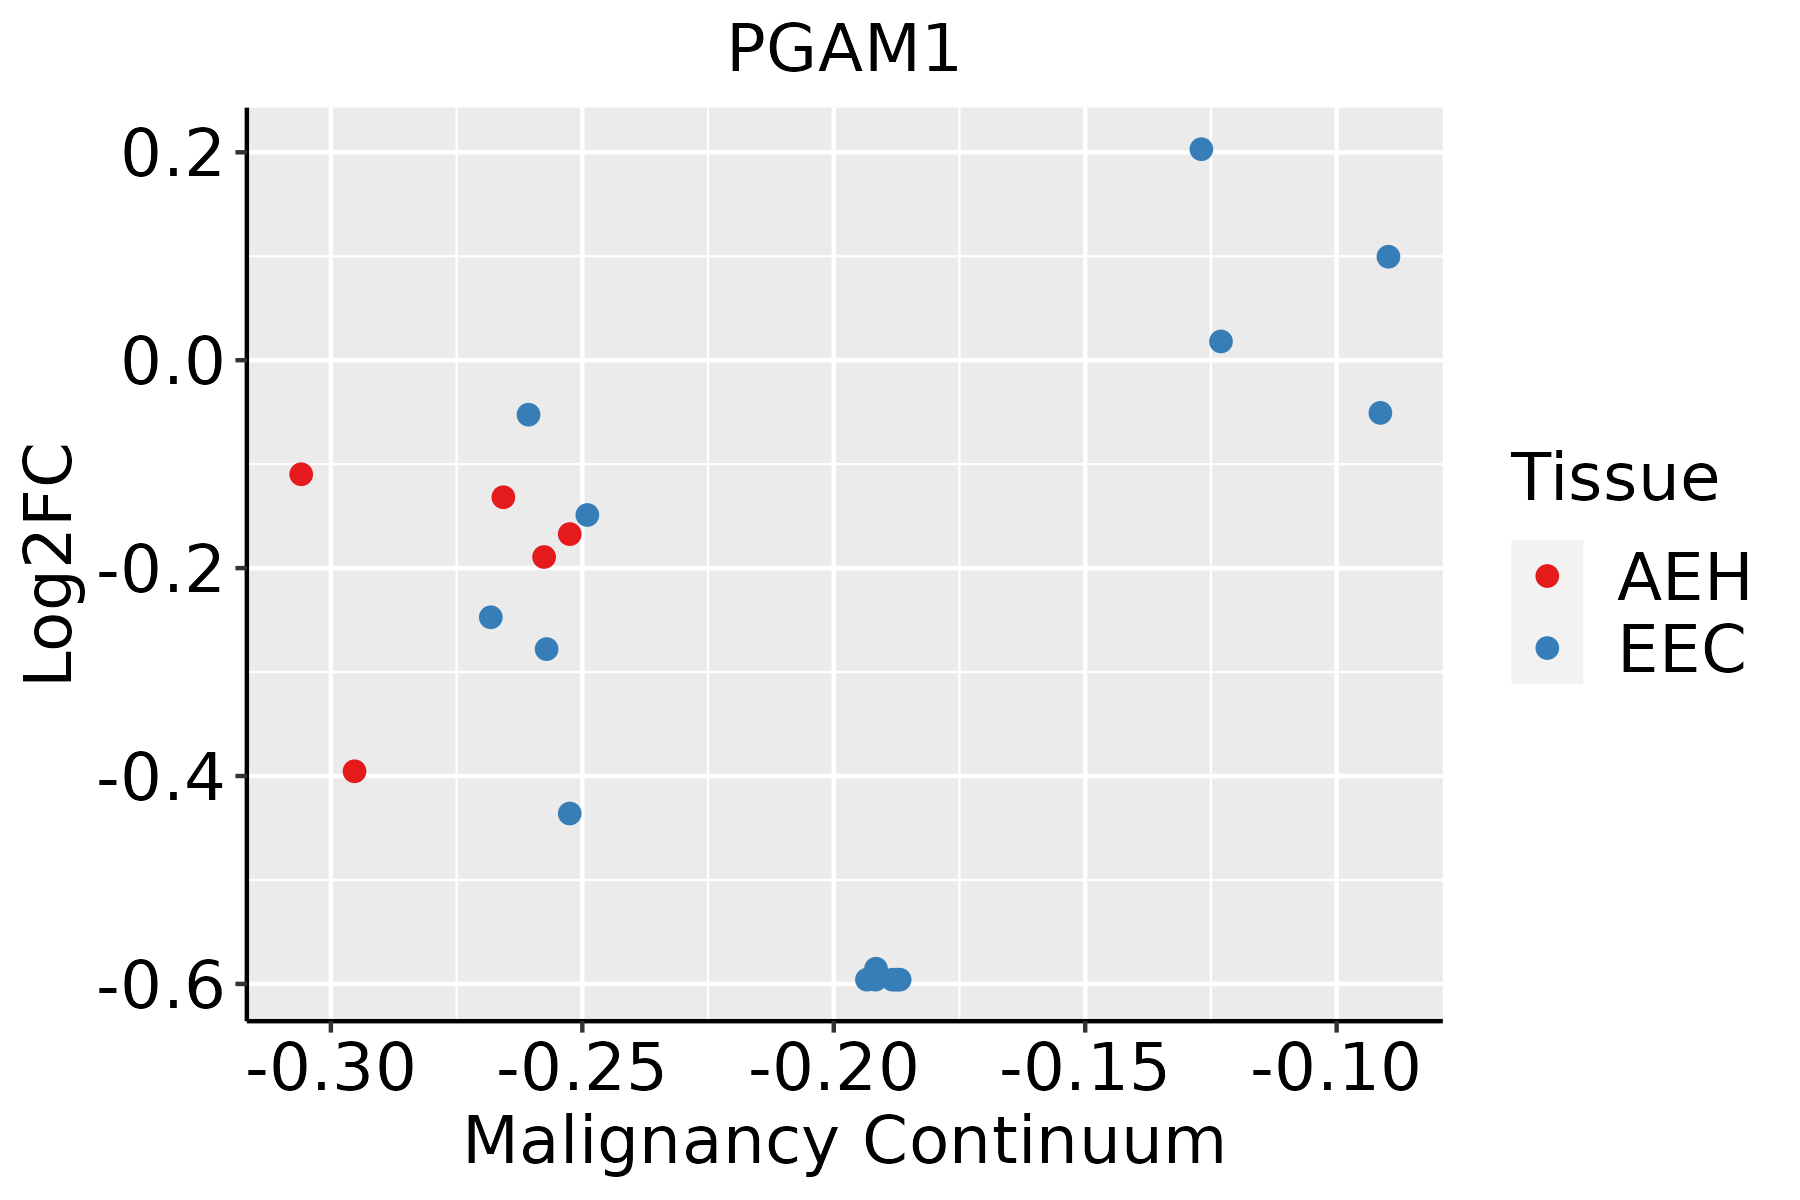 | AEH: Atypical endometrial hyperplasia |
| EEC: Endometrioid Cancer | ||
| Esophagus |  | ESCC: Esophageal squamous cell carcinoma |
| HGIN: High-grade intraepithelial neoplasias | ||
| LGIN: Low-grade intraepithelial neoplasias | ||
| Liver |  | HCC: Hepatocellular carcinoma |
| NAFLD: Non-alcoholic fatty liver disease | ||
| Oral Cavity | 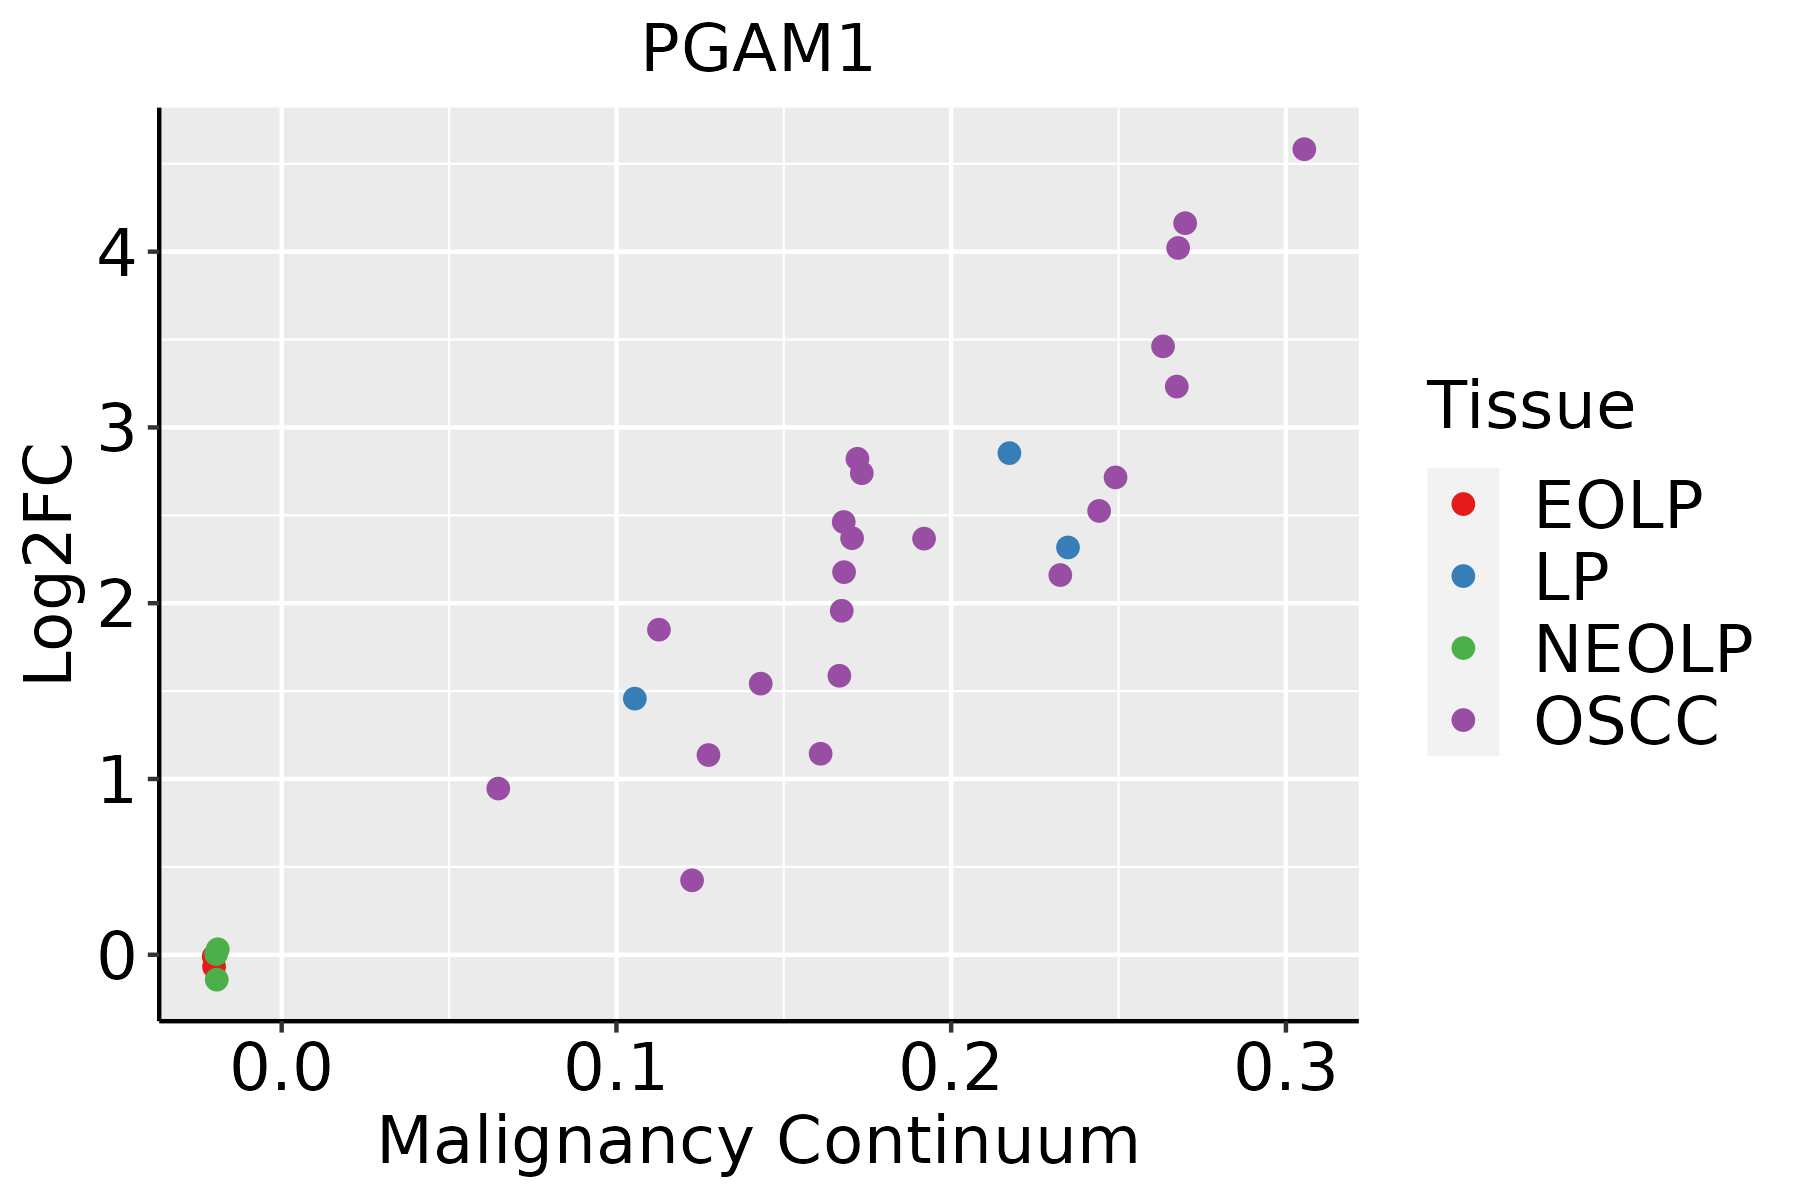 | EOLP: Erosive Oral lichen planus |
| LP: leukoplakia | ||
| NEOLP: Non-erosive oral lichen planus | ||
| OSCC: Oral squamous cell carcinoma | ||
| Prostate | 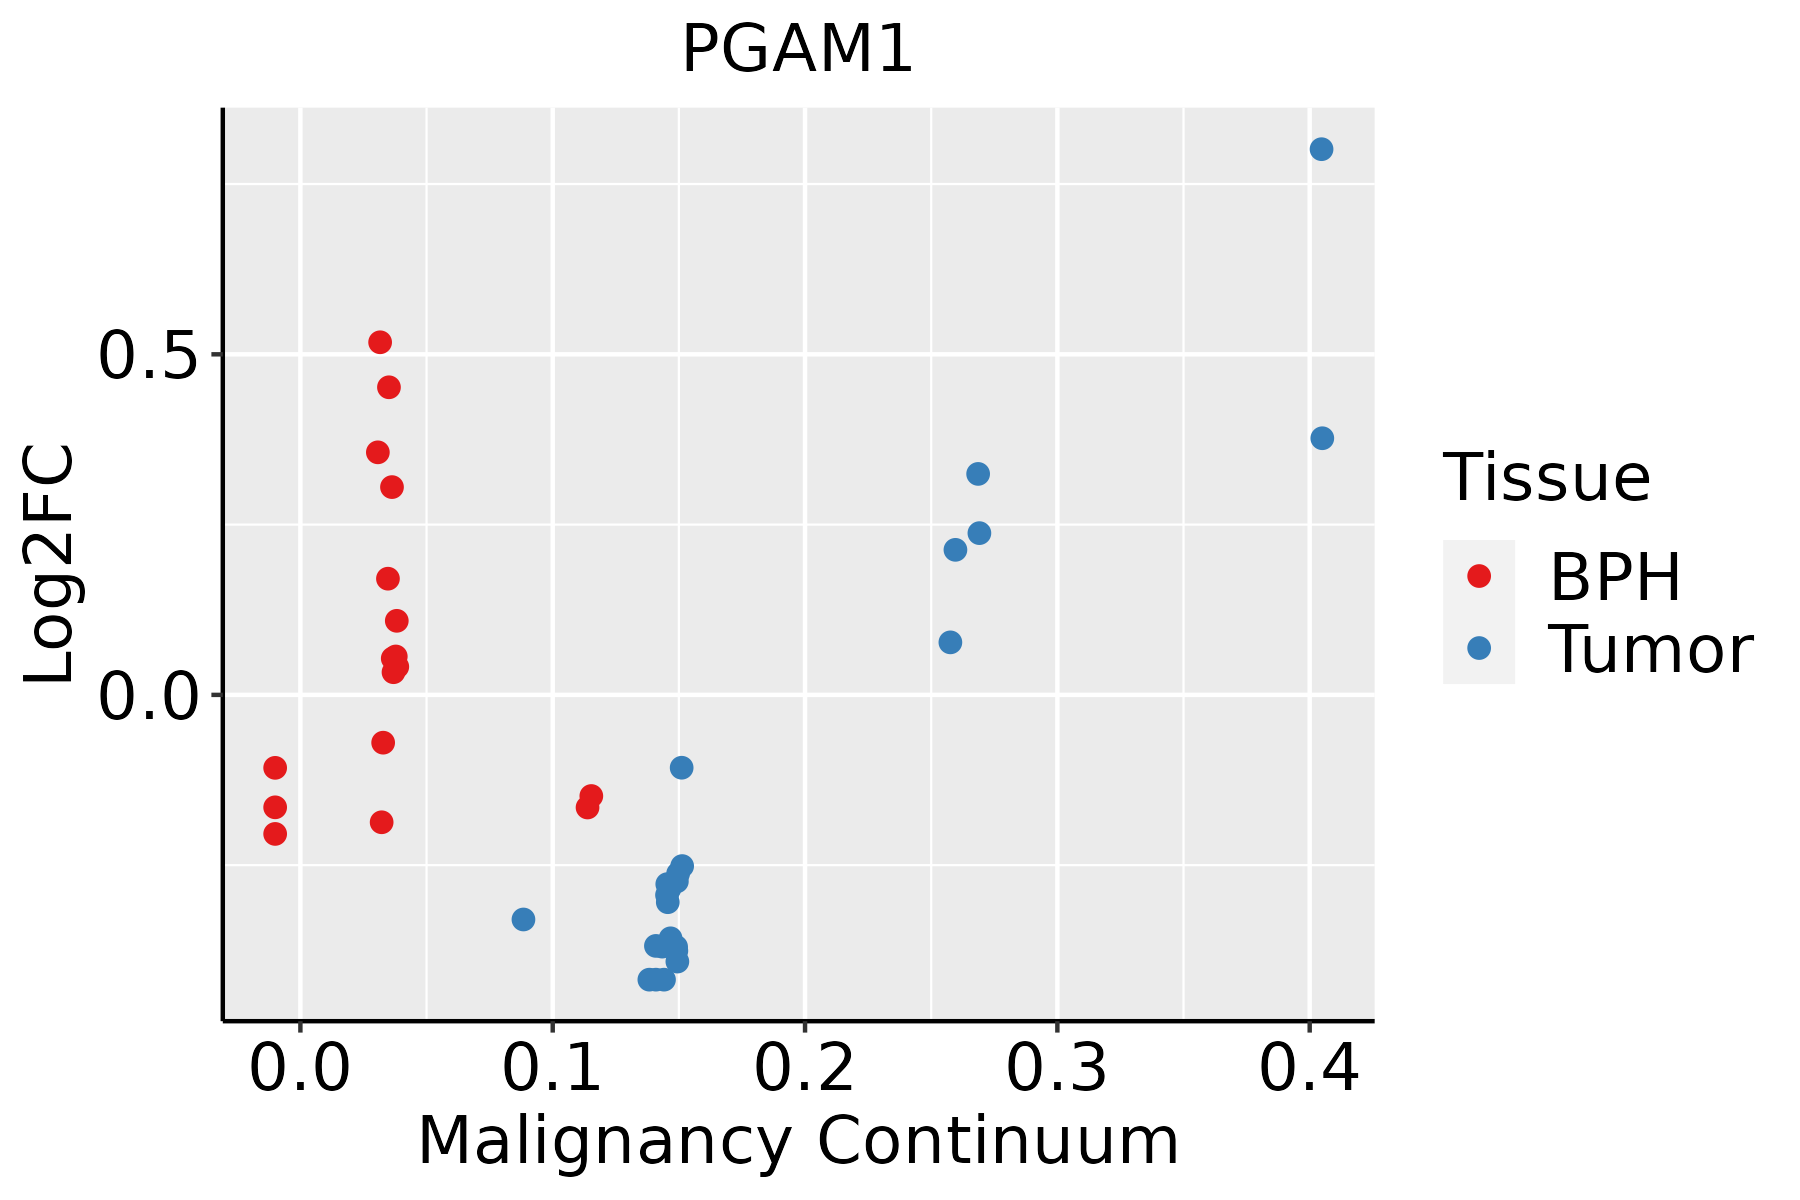 | BPH: Benign Prostatic Hyperplasia |
| Skin | 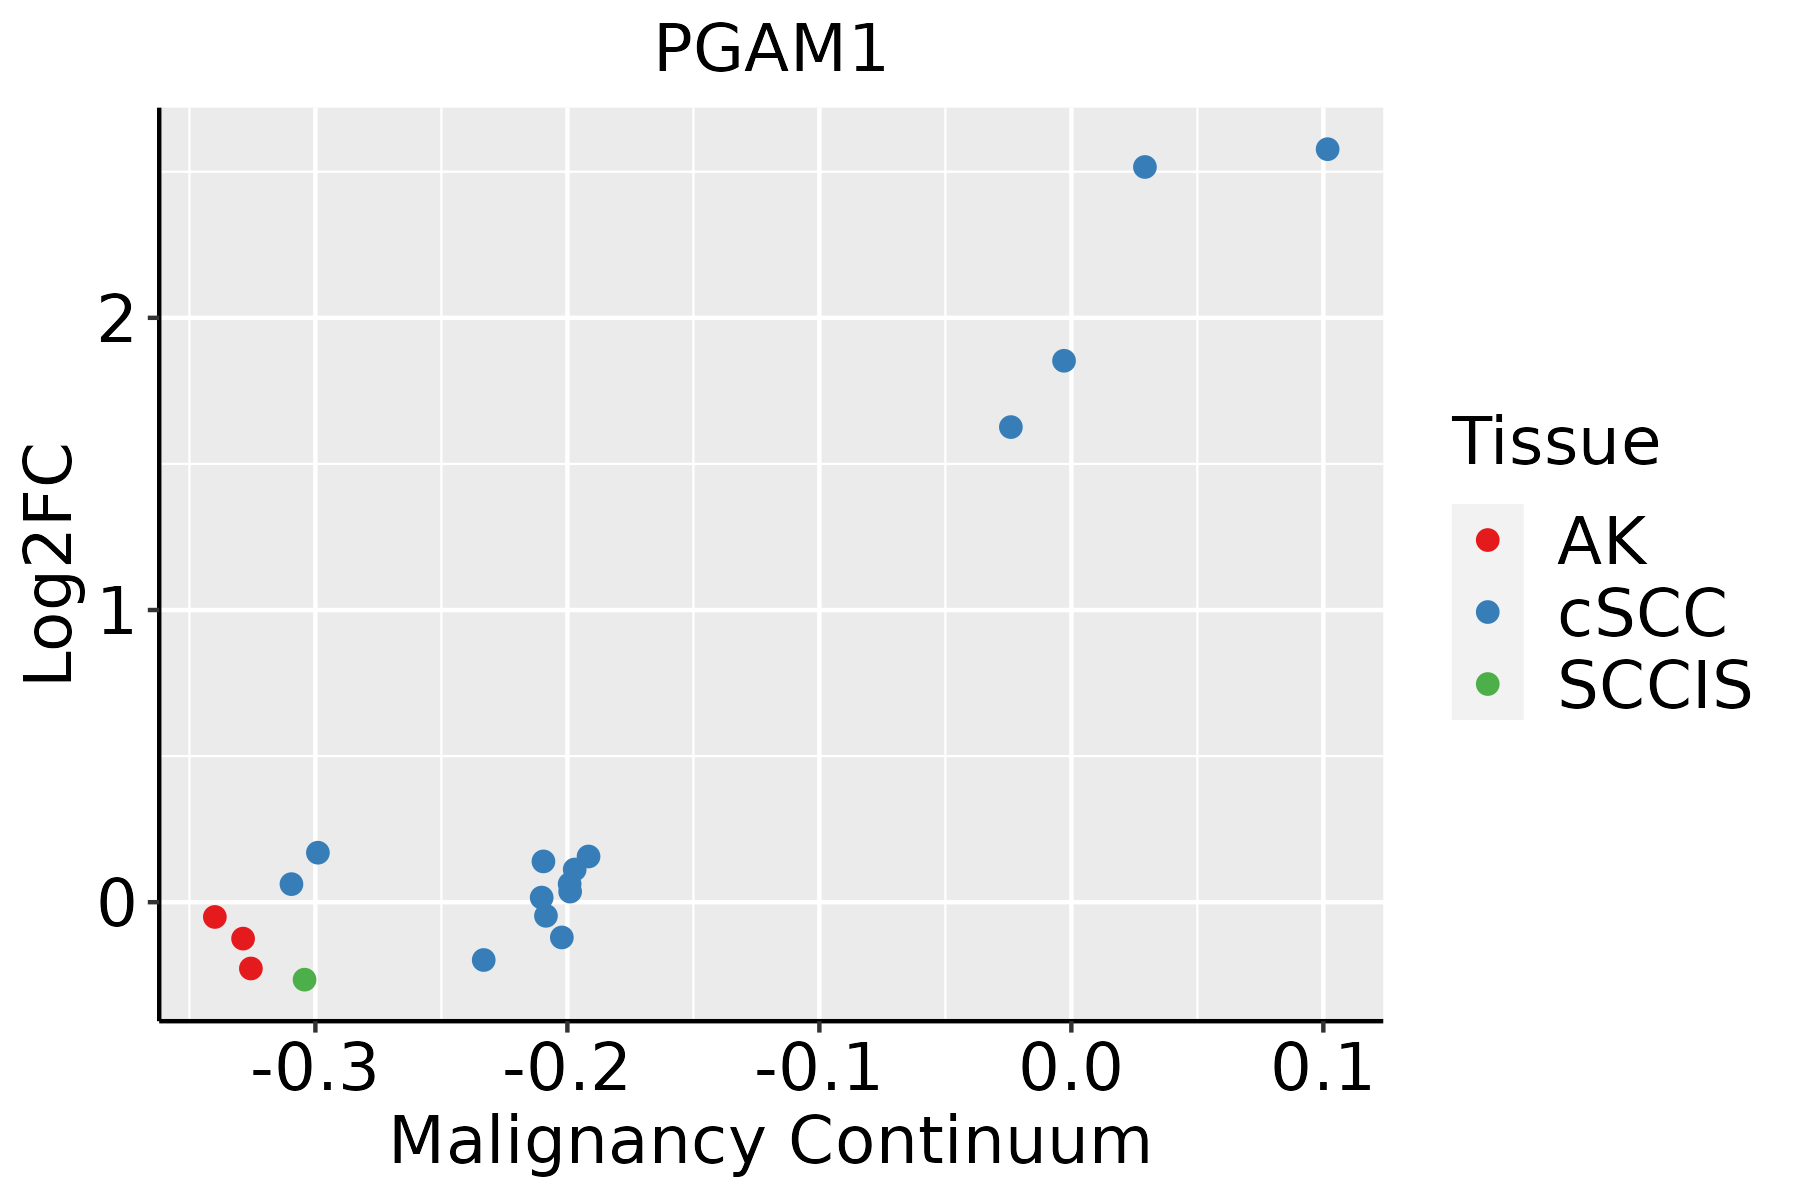 | AK: Actinic keratosis |
| cSCC: Cutaneous squamous cell carcinoma | ||
| SCCIS:squamous cell carcinoma in situ | ||
| Thyroid | 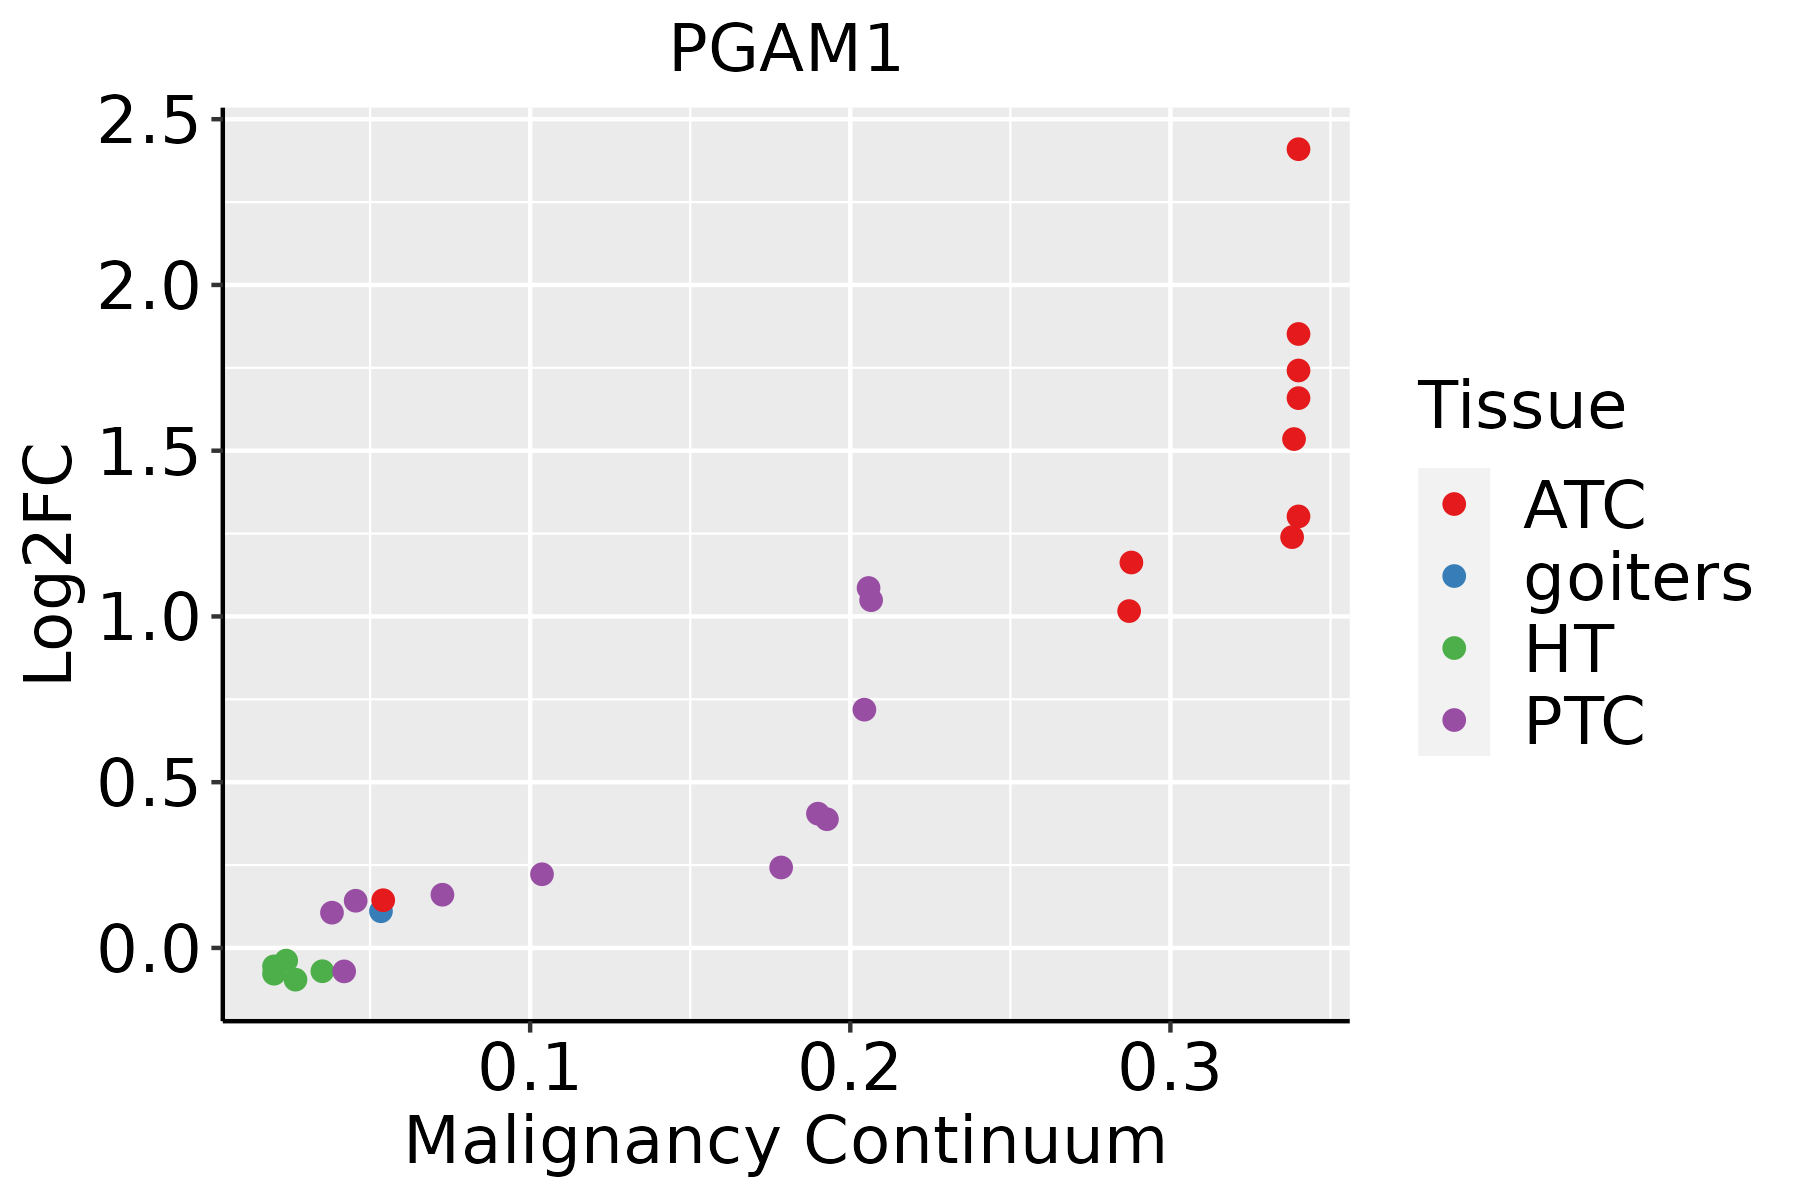 | ATC: Anaplastic thyroid cancer |
| HT: Hashimoto's thyroiditis | ||
| PTC: Papillary thyroid cancer |
| ∗log2FC in expression of this searched gene in stem-like cells from each diseased tissue sample relative to stem-like cells in normal samples in each tissue plotted against the malignancy continuum. Samples are colored based on if they are from different disease stage. |
Top |
Malignant transformation related pathway analysis |
| Find out the enriched GO biological processes and KEGG pathways involved in transition from healthy to precancer to cancer |
| Tissue | Disease Stage | Enriched GO biological Processes |
| Colorectum | AD |  |
| Colorectum | SER |  |
| Colorectum | MSS |  |
| Colorectum | MSI-H |  |
| Colorectum | FAP |  |
| ∗Top 15 enriched GO BP terms are showed in the bar plot of each disease state in each tissue. Each row represents a significant GO biological process which is colored according to the -log10(p.adjust). |
| Page: 1 2 3 4 5 6 7 8 9 |
| GO ID | Tissue | Disease Stage | Description | Gene Ratio | Bg Ratio | pvalue | p.adjust | Count |
| GO:00460349 | Breast | Precancer | ATP metabolic process | 82/1080 | 277/18723 | 1.94e-36 | 5.19e-33 | 82 |
| GO:00060918 | Breast | Precancer | generation of precursor metabolites and energy | 94/1080 | 490/18723 | 1.54e-25 | 1.64e-22 | 94 |
| GO:00196938 | Breast | Precancer | ribose phosphate metabolic process | 49/1080 | 396/18723 | 3.81e-07 | 1.78e-05 | 49 |
| GO:00091509 | Breast | Precancer | purine ribonucleotide metabolic process | 46/1080 | 368/18723 | 6.47e-07 | 2.71e-05 | 46 |
| GO:00091179 | Breast | Precancer | nucleotide metabolic process | 56/1080 | 489/18723 | 7.40e-07 | 3.00e-05 | 56 |
| GO:00092598 | Breast | Precancer | ribonucleotide metabolic process | 47/1080 | 385/18723 | 9.69e-07 | 3.84e-05 | 47 |
| GO:00469398 | Breast | Precancer | nucleotide phosphorylation | 20/1080 | 101/18723 | 1.07e-06 | 4.18e-05 | 20 |
| GO:00067539 | Breast | Precancer | nucleoside phosphate metabolic process | 56/1080 | 497/18723 | 1.24e-06 | 4.70e-05 | 56 |
| GO:00061639 | Breast | Precancer | purine nucleotide metabolic process | 47/1080 | 396/18723 | 2.14e-06 | 7.50e-05 | 47 |
| GO:00091858 | Breast | Precancer | ribonucleoside diphosphate metabolic process | 20/1080 | 106/18723 | 2.37e-06 | 8.17e-05 | 20 |
| GO:00060968 | Breast | Precancer | glycolytic process | 17/1080 | 81/18723 | 2.94e-06 | 9.73e-05 | 17 |
| GO:00061658 | Breast | Precancer | nucleoside diphosphate phosphorylation | 19/1080 | 99/18723 | 3.23e-06 | 1.05e-04 | 19 |
| GO:00067578 | Breast | Precancer | ATP generation from ADP | 17/1080 | 82/18723 | 3.52e-06 | 1.13e-04 | 17 |
| GO:00434677 | Breast | Precancer | regulation of generation of precursor metabolites and energy | 22/1080 | 130/18723 | 4.95e-06 | 1.51e-04 | 22 |
| GO:00091328 | Breast | Precancer | nucleoside diphosphate metabolic process | 21/1080 | 124/18723 | 7.98e-06 | 2.17e-04 | 21 |
| GO:00725219 | Breast | Precancer | purine-containing compound metabolic process | 47/1080 | 416/18723 | 8.19e-06 | 2.20e-04 | 47 |
| GO:00460318 | Breast | Precancer | ADP metabolic process | 17/1080 | 90/18723 | 1.31e-05 | 3.30e-04 | 17 |
| GO:00091359 | Breast | Precancer | purine nucleoside diphosphate metabolic process | 18/1080 | 103/18723 | 2.24e-05 | 5.20e-04 | 18 |
| GO:00091799 | Breast | Precancer | purine ribonucleoside diphosphate metabolic process | 18/1080 | 103/18723 | 2.24e-05 | 5.20e-04 | 18 |
| GO:00060908 | Breast | Precancer | pyruvate metabolic process | 18/1080 | 106/18723 | 3.35e-05 | 7.29e-04 | 18 |
| Page: 1 2 3 4 5 6 7 8 9 10 11 12 13 14 15 16 17 18 19 20 21 22 23 24 25 26 27 28 29 |
| Pathway ID | Tissue | Disease Stage | Description | Gene Ratio | Bg Ratio | pvalue | p.adjust | qvalue | Count |
| hsa0001010 | Breast | Precancer | Glycolysis / Gluconeogenesis | 13/684 | 67/8465 | 2.39e-03 | 1.51e-02 | 1.16e-02 | 13 |
| hsa052309 | Breast | Precancer | Central carbon metabolism in cancer | 13/684 | 70/8465 | 3.57e-03 | 2.17e-02 | 1.66e-02 | 13 |
| hsa0120012 | Breast | Precancer | Carbon metabolism | 18/684 | 115/8465 | 4.79e-03 | 2.75e-02 | 2.11e-02 | 18 |
| hsa0001013 | Breast | Precancer | Glycolysis / Gluconeogenesis | 13/684 | 67/8465 | 2.39e-03 | 1.51e-02 | 1.16e-02 | 13 |
| hsa0523012 | Breast | Precancer | Central carbon metabolism in cancer | 13/684 | 70/8465 | 3.57e-03 | 2.17e-02 | 1.66e-02 | 13 |
| hsa0120013 | Breast | Precancer | Carbon metabolism | 18/684 | 115/8465 | 4.79e-03 | 2.75e-02 | 2.11e-02 | 18 |
| hsa0523010 | Cervix | CC | Central carbon metabolism in cancer | 18/1267 | 70/8465 | 1.29e-02 | 3.87e-02 | 2.29e-02 | 18 |
| hsa0523013 | Cervix | CC | Central carbon metabolism in cancer | 18/1267 | 70/8465 | 1.29e-02 | 3.87e-02 | 2.29e-02 | 18 |
| hsa01200 | Colorectum | AD | Carbon metabolism | 55/2092 | 115/8465 | 5.53e-08 | 8.42e-07 | 5.37e-07 | 55 |
| hsa00010 | Colorectum | AD | Glycolysis / Gluconeogenesis | 34/2092 | 67/8465 | 3.63e-06 | 4.34e-05 | 2.77e-05 | 34 |
| hsa05230 | Colorectum | AD | Central carbon metabolism in cancer | 33/2092 | 70/8465 | 3.61e-05 | 3.19e-04 | 2.03e-04 | 33 |
| hsa04922 | Colorectum | AD | Glucagon signaling pathway | 41/2092 | 107/8465 | 1.18e-03 | 7.75e-03 | 4.94e-03 | 41 |
| hsa01230 | Colorectum | AD | Biosynthesis of amino acids | 28/2092 | 75/8465 | 9.99e-03 | 3.89e-02 | 2.48e-02 | 28 |
| hsa012001 | Colorectum | AD | Carbon metabolism | 55/2092 | 115/8465 | 5.53e-08 | 8.42e-07 | 5.37e-07 | 55 |
| hsa000101 | Colorectum | AD | Glycolysis / Gluconeogenesis | 34/2092 | 67/8465 | 3.63e-06 | 4.34e-05 | 2.77e-05 | 34 |
| hsa052301 | Colorectum | AD | Central carbon metabolism in cancer | 33/2092 | 70/8465 | 3.61e-05 | 3.19e-04 | 2.03e-04 | 33 |
| hsa049221 | Colorectum | AD | Glucagon signaling pathway | 41/2092 | 107/8465 | 1.18e-03 | 7.75e-03 | 4.94e-03 | 41 |
| hsa012301 | Colorectum | AD | Biosynthesis of amino acids | 28/2092 | 75/8465 | 9.99e-03 | 3.89e-02 | 2.48e-02 | 28 |
| hsa049222 | Colorectum | SER | Glucagon signaling pathway | 38/1580 | 107/8465 | 2.57e-05 | 3.28e-04 | 2.38e-04 | 38 |
| hsa012002 | Colorectum | SER | Carbon metabolism | 40/1580 | 115/8465 | 2.77e-05 | 3.41e-04 | 2.47e-04 | 40 |
| Page: 1 2 3 4 5 6 |
Top |
Cell-cell communication analysis |
| Identification of potential cell-cell interactions between two cell types and their ligand-receptor pairs for different disease states |
| Ligand | Receptor | LRpair | Pathway | Tissue | Disease Stage |
| Page: 1 |
Top |
Single-cell gene regulatory network inference analysis |
| Find out the significant the regulons (TFs) and the target genes of each regulon across cell types for different disease states |
| TF | Cell Type | Tissue | Disease Stage | Target Gene | RSS | Regulon Activity |
| ∗The dot plots of a searched regulon are shown for all cell subpopulations in each disease state of each tissue based on the regulon specific score inferred using pySCENIC and by calculating the average expression. |
| Page: 1 |
Top |
Somatic mutation of malignant transformation related genes |
| Annotation of somatic variants for genes involved in malignant transformation |
| Hugo Symbol | Variant Class | Variant Classification | dbSNP RS | HGVSc | HGVSp | HGVSp Short | SWISSPROT | BIOTYPE | SIFT | PolyPhen | Tumor Sample Barcode | Tissue | Histology | Sex | Age | Stage | Therapy Types | Drugs | Outcome |
| PGAM1 | SNV | Missense_Mutation | rs765939447 | c.7N>T | p.Ala3Ser | p.A3S | P18669 | protein_coding | tolerated(0.24) | benign(0.05) | TCGA-AC-A3QP-01 | Breast | breast invasive carcinoma | Female | >=65 | I/II | Hormone Therapy | femara | SD |
| PGAM1 | SNV | Missense_Mutation | novel | c.301N>A | p.Ala101Thr | p.A101T | P18669 | protein_coding | deleterious(0.03) | benign(0.061) | TCGA-AN-A046-01 | Breast | breast invasive carcinoma | Female | >=65 | I/II | Unknown | Unknown | SD |
| PGAM1 | SNV | Missense_Mutation | c.517N>T | p.Pro173Ser | p.P173S | P18669 | protein_coding | deleterious(0.01) | probably_damaging(0.926) | TCGA-C5-A1BJ-01 | Cervix | cervical & endocervical cancer | Female | <65 | I/II | Unknown | Unknown | SD | |
| PGAM1 | insertion | Frame_Shift_Ins | novel | c.708_709insG | p.Glu237GlyfsTer130 | p.E237Gfs*130 | P18669 | protein_coding | TCGA-DS-A1OB-01 | Cervix | cervical & endocervical cancer | Female | <65 | I/II | Chemotherapy | carboplatin | PD | ||
| PGAM1 | insertion | Frame_Shift_Ins | novel | c.710_711insCTTT | p.Glu237AspfsTer131 | p.E237Dfs*131 | P18669 | protein_coding | TCGA-DS-A1OB-01 | Cervix | cervical & endocervical cancer | Female | <65 | I/II | Chemotherapy | carboplatin | PD | ||
| PGAM1 | SNV | Missense_Mutation | rs371468578 | c.719N>A | p.Arg240His | p.R240H | P18669 | protein_coding | tolerated(0.09) | benign(0.007) | TCGA-AA-3966-01 | Colorectum | colon adenocarcinoma | Female | >=65 | I/II | Unknown | Unknown | SD |
| PGAM1 | SNV | Missense_Mutation | rs371468578 | c.719N>A | p.Arg240His | p.R240H | P18669 | protein_coding | tolerated(0.09) | benign(0.007) | TCGA-AA-A010-01 | Colorectum | colon adenocarcinoma | Female | <65 | I/II | Chemotherapy | folinic | CR |
| PGAM1 | SNV | Missense_Mutation | novel | c.76T>C | p.Tyr26His | p.Y26H | P18669 | protein_coding | tolerated(0.53) | benign(0.041) | TCGA-AD-6964-01 | Colorectum | colon adenocarcinoma | Male | <65 | III/IV | Chemotherapy | folfox | PD |
| PGAM1 | SNV | Missense_Mutation | c.535N>G | p.Lys179Glu | p.K179E | P18669 | protein_coding | tolerated(0.06) | benign(0.087) | TCGA-AM-5821-01 | Colorectum | colon adenocarcinoma | Female | >=65 | I/II | Unknown | Unknown | SD | |
| PGAM1 | SNV | Missense_Mutation | c.188N>T | p.Ala63Val | p.A63V | P18669 | protein_coding | tolerated(0.05) | benign(0.437) | TCGA-CM-5861-01 | Colorectum | colon adenocarcinoma | Female | <65 | I/II | Unknown | Unknown | PD |
| Page: 1 2 3 |
Top |
Related drugs of malignant transformation related genes |
| Identification of chemicals and drugs interact with genes involved in malignant transfromation |
| (DGIdb 4.0) |
| Entrez ID | Symbol | Category | Interaction Types | Drug Claim Name | Drug Name | PMIDs |
| Page: 1 |

Copyright 2023-Present -The University of Texas Health Science Center at Houston |