
|
|||||
|
 | |
| |
| |
| |
| |
| |
|
Gene: PFKL |
Gene summary for PFKL |
| Gene information | Species | Human | Gene symbol | PFKL | Gene ID | 5211 |
| Gene name | phosphofructokinase, liver type | |
| Gene Alias | ATP-PFK | |
| Cytomap | 21q22.3 | |
| Gene Type | protein-coding | GO ID | GO:0002790 | UniProtAcc | P17858 |
Top |
Malignant transformation analysis |
| Identification of the aberrant gene expression in precancerous and cancerous lesions by comparing the gene expression of stem-like cells in diseased tissues with normal stem cells |
| Entrez ID | Symbol | Replicates | Species | Organ | Tissue | Adj P-value | Log2FC | Malignancy |
| 5211 | PFKL | HTA11_2487_2000001011 | Human | Colorectum | SER | 4.90e-14 | 7.35e-01 | -0.1808 |
| 5211 | PFKL | HTA11_1938_2000001011 | Human | Colorectum | AD | 6.48e-22 | 9.08e-01 | -0.0811 |
| 5211 | PFKL | HTA11_78_2000001011 | Human | Colorectum | AD | 1.73e-06 | 5.01e-01 | -0.1088 |
| 5211 | PFKL | HTA11_347_2000001011 | Human | Colorectum | AD | 3.28e-14 | 5.31e-01 | -0.1954 |
| 5211 | PFKL | HTA11_2112_2000001011 | Human | Colorectum | SER | 2.06e-04 | 8.20e-01 | -0.2196 |
| 5211 | PFKL | HTA11_3361_2000001011 | Human | Colorectum | AD | 5.69e-08 | 6.38e-01 | -0.1207 |
| 5211 | PFKL | HTA11_83_2000001011 | Human | Colorectum | SER | 9.50e-06 | 5.53e-01 | -0.1526 |
| 5211 | PFKL | HTA11_696_2000001011 | Human | Colorectum | AD | 9.32e-12 | 5.02e-01 | -0.1464 |
| 5211 | PFKL | HTA11_866_2000001011 | Human | Colorectum | AD | 1.12e-08 | 3.63e-01 | -0.1001 |
| 5211 | PFKL | HTA11_1391_2000001011 | Human | Colorectum | AD | 6.17e-20 | 7.94e-01 | -0.059 |
| 5211 | PFKL | HTA11_2992_2000001011 | Human | Colorectum | SER | 1.65e-02 | 6.36e-01 | -0.1706 |
| 5211 | PFKL | HTA11_5216_2000001011 | Human | Colorectum | SER | 6.08e-04 | 7.44e-01 | -0.1462 |
| 5211 | PFKL | HTA11_866_3004761011 | Human | Colorectum | AD | 3.02e-04 | 3.84e-01 | 0.096 |
| 5211 | PFKL | HTA11_4255_2000001011 | Human | Colorectum | SER | 2.45e-02 | 4.68e-01 | 0.0446 |
| 5211 | PFKL | HTA11_8622_2000001021 | Human | Colorectum | SER | 4.54e-03 | 6.22e-01 | 0.0528 |
| 5211 | PFKL | HTA11_10711_2000001011 | Human | Colorectum | AD | 4.25e-02 | 4.03e-01 | 0.0338 |
| 5211 | PFKL | HTA11_99999970781_79442 | Human | Colorectum | MSS | 2.57e-07 | 3.81e-01 | 0.294 |
| 5211 | PFKL | HTA11_99999971662_82457 | Human | Colorectum | MSS | 2.02e-07 | 5.04e-01 | 0.3859 |
| 5211 | PFKL | HTA11_99999974143_84620 | Human | Colorectum | MSS | 2.00e-11 | 4.89e-01 | 0.3005 |
| 5211 | PFKL | A015-C-203 | Human | Colorectum | FAP | 1.16e-04 | 2.25e-01 | -0.1294 |
| Page: 1 2 3 4 5 6 7 8 |
| Tissue | Expression Dynamics | Abbreviation |
| Colorectum (GSE201348) |  | FAP: Familial adenomatous polyposis |
| CRC: Colorectal cancer | ||
| Colorectum (HTA11) |  | AD: Adenomas |
| SER: Sessile serrated lesions | ||
| MSI-H: Microsatellite-high colorectal cancer | ||
| MSS: Microsatellite stable colorectal cancer | ||
| Esophagus | 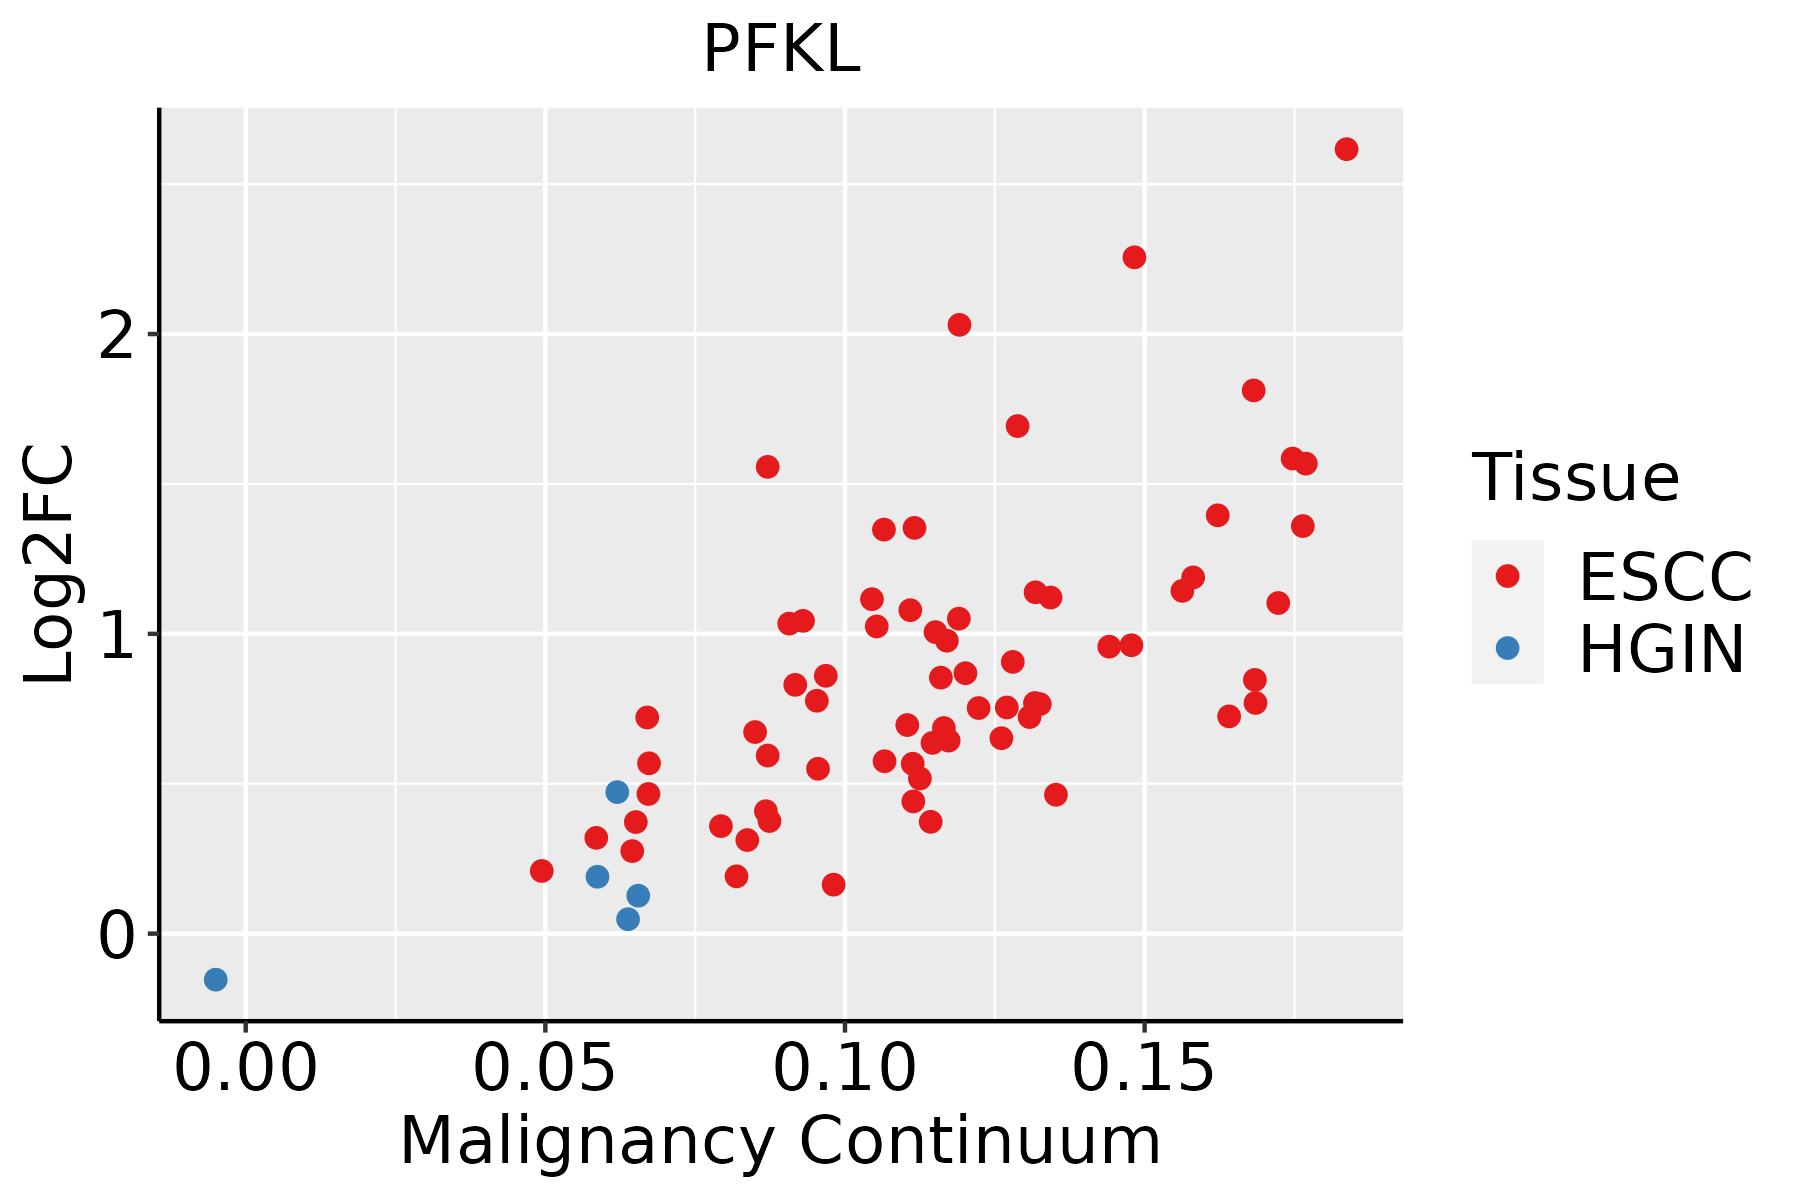 | ESCC: Esophageal squamous cell carcinoma |
| HGIN: High-grade intraepithelial neoplasias | ||
| LGIN: Low-grade intraepithelial neoplasias | ||
| Liver | 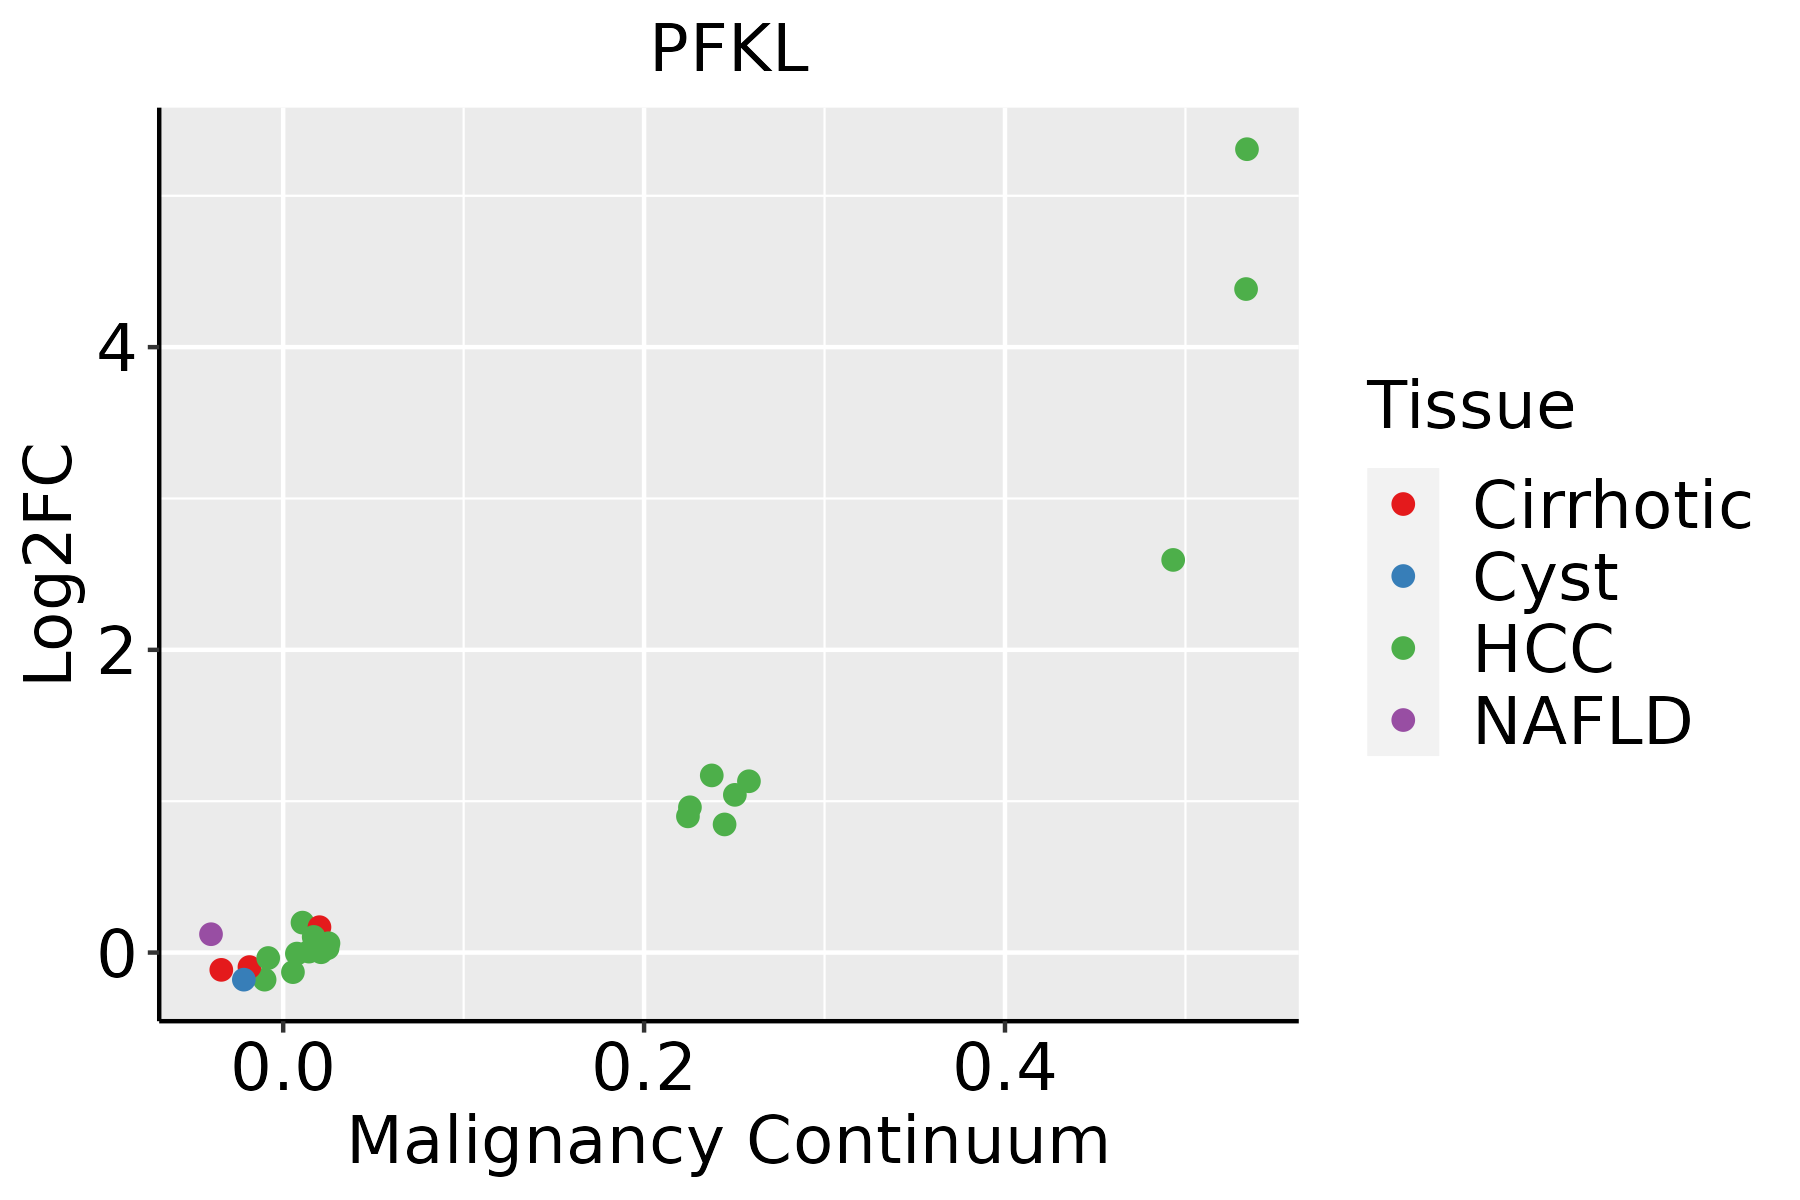 | HCC: Hepatocellular carcinoma |
| NAFLD: Non-alcoholic fatty liver disease | ||
| Oral Cavity | 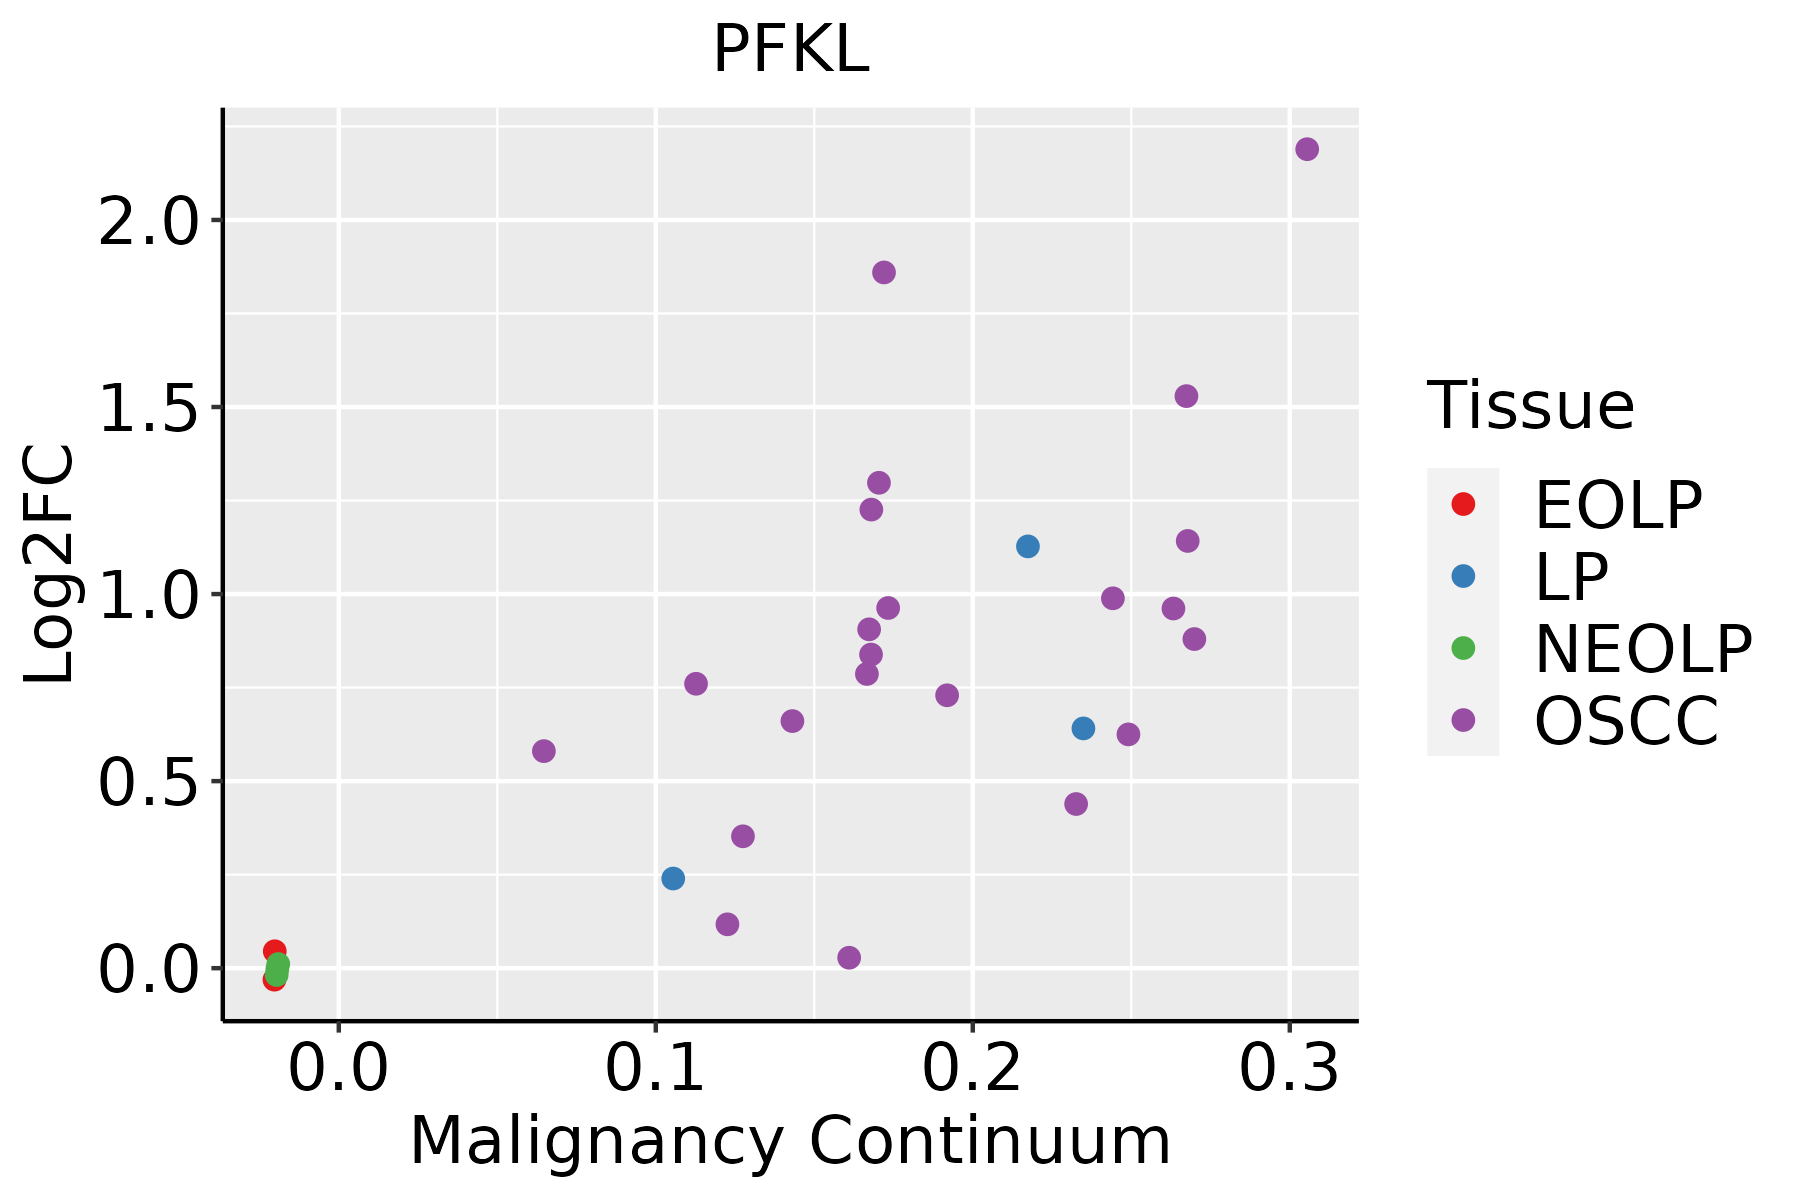 | EOLP: Erosive Oral lichen planus |
| LP: leukoplakia | ||
| NEOLP: Non-erosive oral lichen planus | ||
| OSCC: Oral squamous cell carcinoma | ||
| Skin | 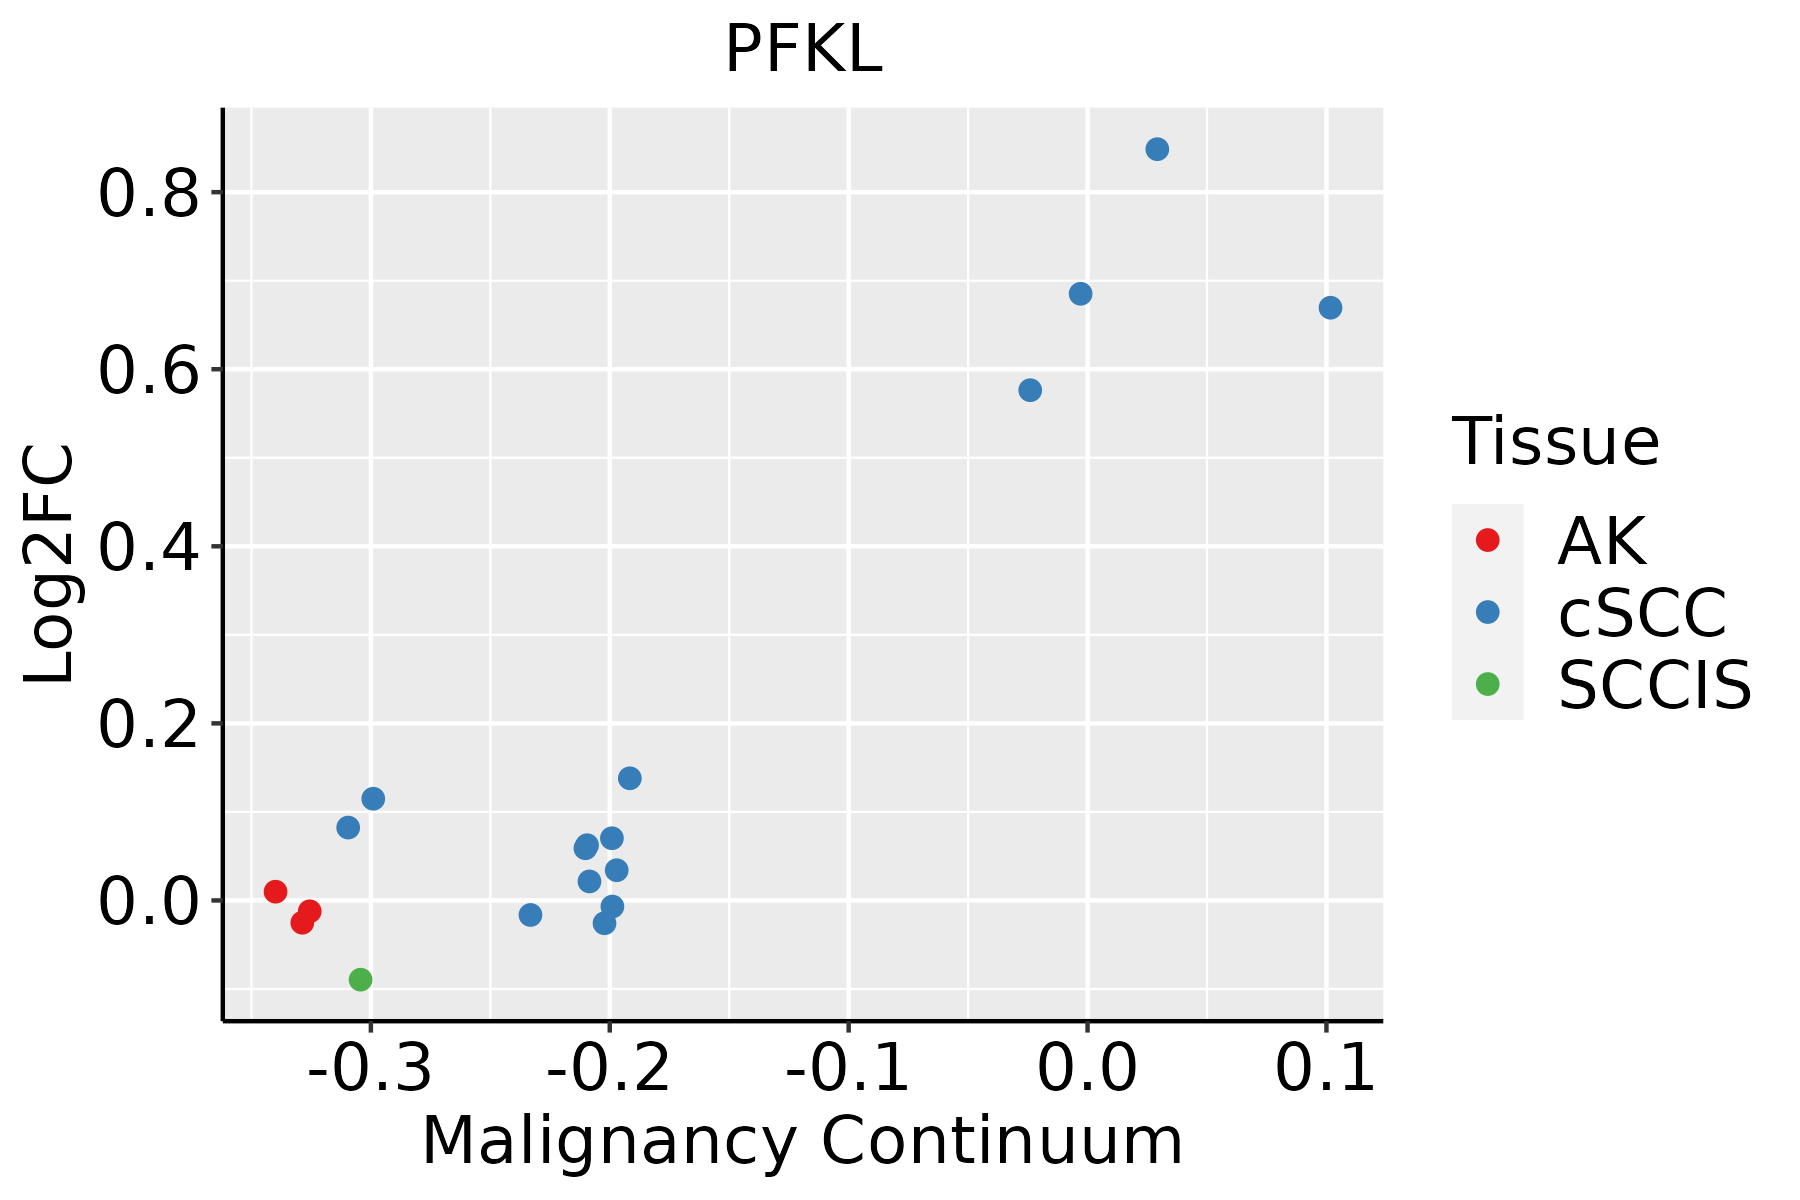 | AK: Actinic keratosis |
| cSCC: Cutaneous squamous cell carcinoma | ||
| SCCIS:squamous cell carcinoma in situ | ||
| Thyroid | 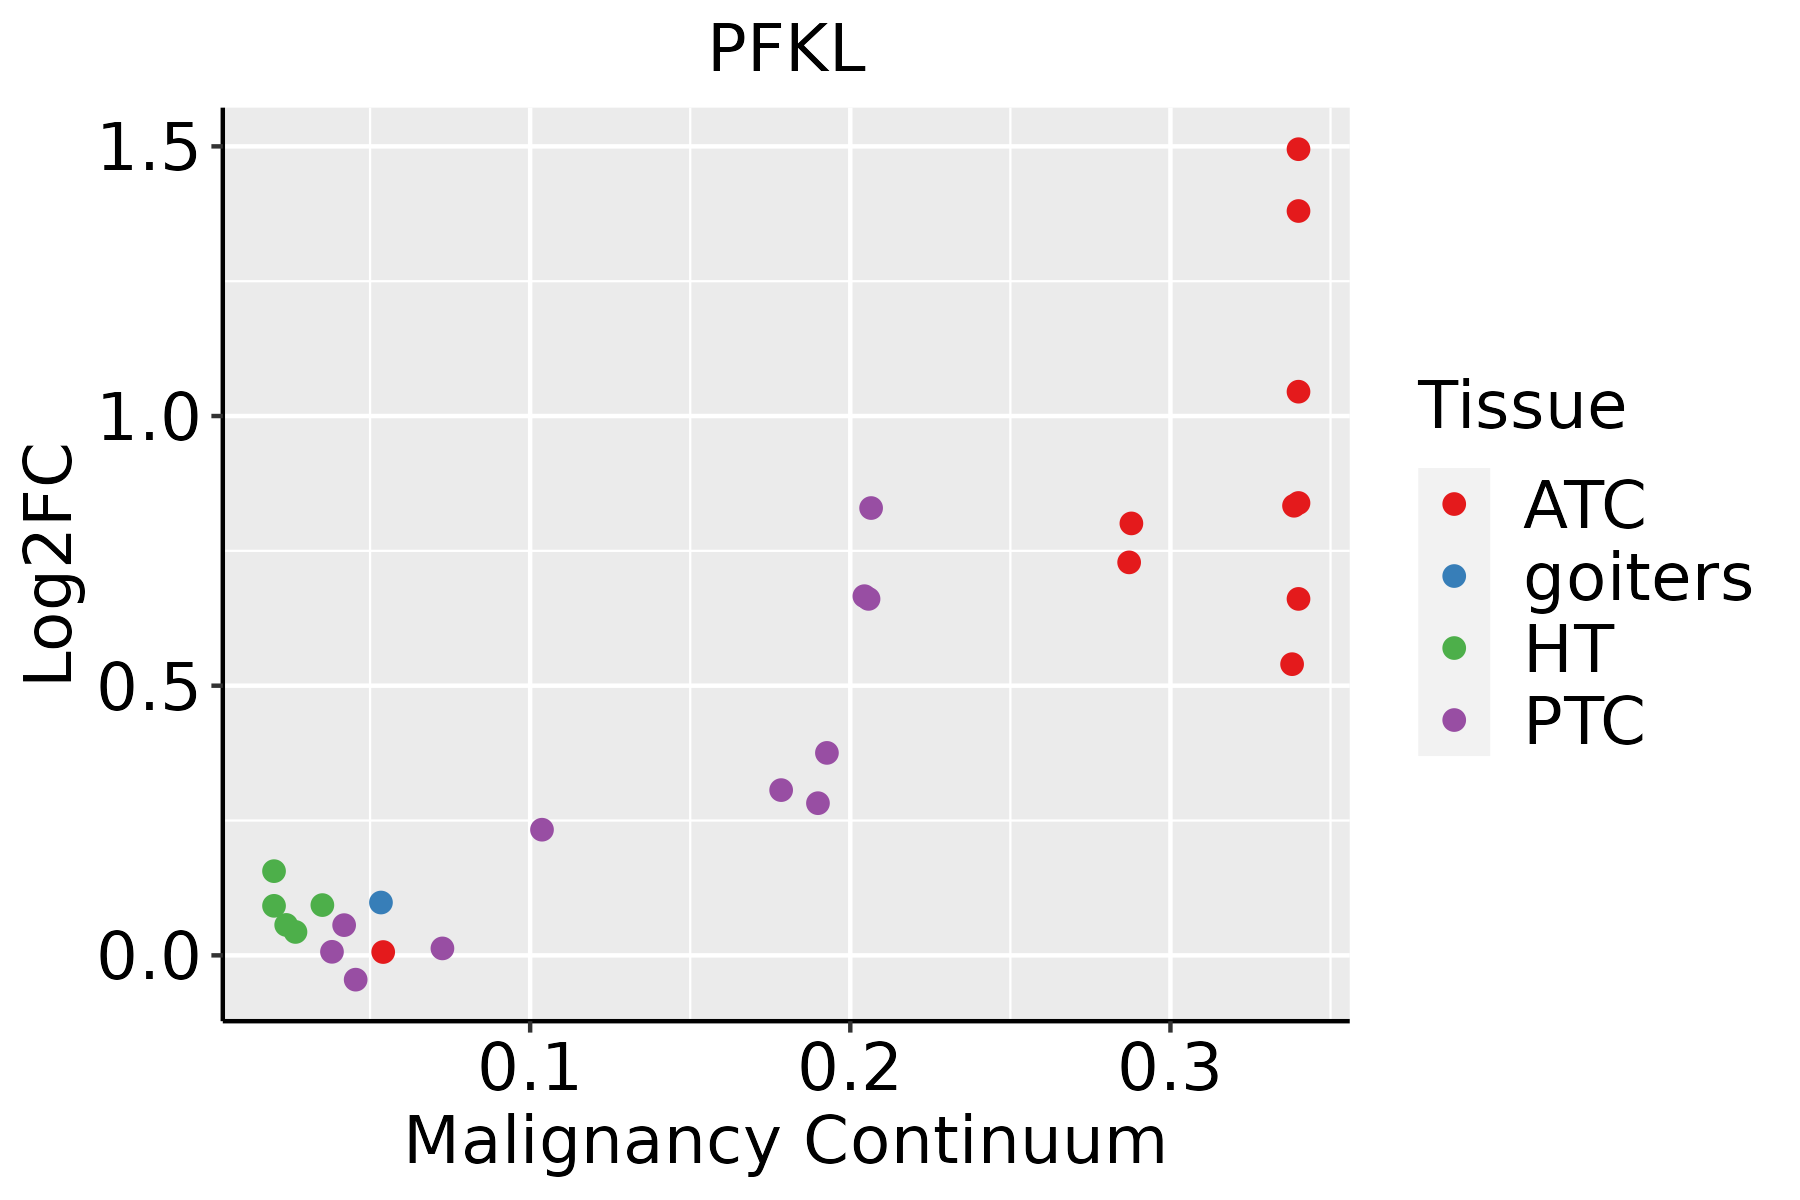 | ATC: Anaplastic thyroid cancer |
| HT: Hashimoto's thyroiditis | ||
| PTC: Papillary thyroid cancer |
| ∗log2FC in expression of this searched gene in stem-like cells from each diseased tissue sample relative to stem-like cells in normal samples in each tissue plotted against the malignancy continuum. Samples are colored based on if they are from different disease stage. |
Top |
Malignant transformation related pathway analysis |
| Find out the enriched GO biological processes and KEGG pathways involved in transition from healthy to precancer to cancer |
| Tissue | Disease Stage | Enriched GO biological Processes |
| Colorectum | AD |  |
| Colorectum | SER |  |
| Colorectum | MSS |  |
| Colorectum | MSI-H |  |
| Colorectum | FAP |  |
| ∗Top 15 enriched GO BP terms are showed in the bar plot of each disease state in each tissue. Each row represents a significant GO biological process which is colored according to the -log10(p.adjust). |
| Page: 1 2 3 4 5 6 7 8 9 |
| GO ID | Tissue | Disease Stage | Description | Gene Ratio | Bg Ratio | pvalue | p.adjust | Count |
| GO:0046034 | Colorectum | AD | ATP metabolic process | 142/3918 | 277/18723 | 2.64e-29 | 8.26e-26 | 142 |
| GO:0006091 | Colorectum | AD | generation of precursor metabolites and energy | 209/3918 | 490/18723 | 3.17e-28 | 6.61e-25 | 209 |
| GO:0009150 | Colorectum | AD | purine ribonucleotide metabolic process | 142/3918 | 368/18723 | 4.29e-15 | 1.17e-12 | 142 |
| GO:0006163 | Colorectum | AD | purine nucleotide metabolic process | 149/3918 | 396/18723 | 1.08e-14 | 2.80e-12 | 149 |
| GO:0072521 | Colorectum | AD | purine-containing compound metabolic process | 153/3918 | 416/18723 | 4.34e-14 | 1.01e-11 | 153 |
| GO:0009259 | Colorectum | AD | ribonucleotide metabolic process | 144/3918 | 385/18723 | 5.25e-14 | 1.13e-11 | 144 |
| GO:0019693 | Colorectum | AD | ribose phosphate metabolic process | 145/3918 | 396/18723 | 3.01e-13 | 5.71e-11 | 145 |
| GO:0009117 | Colorectum | AD | nucleotide metabolic process | 168/3918 | 489/18723 | 2.20e-12 | 3.36e-10 | 168 |
| GO:0006753 | Colorectum | AD | nucleoside phosphate metabolic process | 169/3918 | 497/18723 | 4.99e-12 | 6.98e-10 | 169 |
| GO:0009135 | Colorectum | AD | purine nucleoside diphosphate metabolic process | 47/3918 | 103/18723 | 1.61e-08 | 9.22e-07 | 47 |
| GO:0009179 | Colorectum | AD | purine ribonucleoside diphosphate metabolic process | 47/3918 | 103/18723 | 1.61e-08 | 9.22e-07 | 47 |
| GO:0006090 | Colorectum | AD | pyruvate metabolic process | 47/3918 | 106/18723 | 4.85e-08 | 2.55e-06 | 47 |
| GO:0009185 | Colorectum | AD | ribonucleoside diphosphate metabolic process | 47/3918 | 106/18723 | 4.85e-08 | 2.55e-06 | 47 |
| GO:0046031 | Colorectum | AD | ADP metabolic process | 41/3918 | 90/18723 | 1.37e-07 | 6.42e-06 | 41 |
| GO:0006096 | Colorectum | AD | glycolytic process | 38/3918 | 81/18723 | 1.52e-07 | 6.78e-06 | 38 |
| GO:0006757 | Colorectum | AD | ATP generation from ADP | 38/3918 | 82/18723 | 2.26e-07 | 9.37e-06 | 38 |
| GO:0009743 | Colorectum | AD | response to carbohydrate | 86/3918 | 253/18723 | 8.43e-07 | 2.90e-05 | 86 |
| GO:0044282 | Colorectum | AD | small molecule catabolic process | 118/3918 | 376/18723 | 1.05e-06 | 3.55e-05 | 118 |
| GO:0009132 | Colorectum | AD | nucleoside diphosphate metabolic process | 49/3918 | 124/18723 | 1.75e-06 | 5.31e-05 | 49 |
| GO:0046939 | Colorectum | AD | nucleotide phosphorylation | 42/3918 | 101/18723 | 1.99e-06 | 5.92e-05 | 42 |
| Page: 1 2 3 4 5 6 7 8 9 10 11 12 13 14 15 16 17 18 19 20 21 22 23 24 |
| Pathway ID | Tissue | Disease Stage | Description | Gene Ratio | Bg Ratio | pvalue | p.adjust | qvalue | Count |
| hsa01200 | Colorectum | AD | Carbon metabolism | 55/2092 | 115/8465 | 5.53e-08 | 8.42e-07 | 5.37e-07 | 55 |
| hsa00010 | Colorectum | AD | Glycolysis / Gluconeogenesis | 34/2092 | 67/8465 | 3.63e-06 | 4.34e-05 | 2.77e-05 | 34 |
| hsa04066 | Colorectum | AD | HIF-1 signaling pathway | 48/2092 | 109/8465 | 7.25e-06 | 7.84e-05 | 5.00e-05 | 48 |
| hsa04919 | Colorectum | AD | Thyroid hormone signaling pathway | 51/2092 | 121/8465 | 1.71e-05 | 1.73e-04 | 1.10e-04 | 51 |
| hsa05230 | Colorectum | AD | Central carbon metabolism in cancer | 33/2092 | 70/8465 | 3.61e-05 | 3.19e-04 | 2.03e-04 | 33 |
| hsa04152 | Colorectum | AD | AMPK signaling pathway | 47/2092 | 121/8465 | 3.74e-04 | 2.82e-03 | 1.80e-03 | 47 |
| hsa04922 | Colorectum | AD | Glucagon signaling pathway | 41/2092 | 107/8465 | 1.18e-03 | 7.75e-03 | 4.94e-03 | 41 |
| hsa00051 | Colorectum | AD | Fructose and mannose metabolism | 17/2092 | 34/8465 | 1.25e-03 | 8.02e-03 | 5.12e-03 | 17 |
| hsa01230 | Colorectum | AD | Biosynthesis of amino acids | 28/2092 | 75/8465 | 9.99e-03 | 3.89e-02 | 2.48e-02 | 28 |
| hsa012001 | Colorectum | AD | Carbon metabolism | 55/2092 | 115/8465 | 5.53e-08 | 8.42e-07 | 5.37e-07 | 55 |
| hsa000101 | Colorectum | AD | Glycolysis / Gluconeogenesis | 34/2092 | 67/8465 | 3.63e-06 | 4.34e-05 | 2.77e-05 | 34 |
| hsa040661 | Colorectum | AD | HIF-1 signaling pathway | 48/2092 | 109/8465 | 7.25e-06 | 7.84e-05 | 5.00e-05 | 48 |
| hsa049191 | Colorectum | AD | Thyroid hormone signaling pathway | 51/2092 | 121/8465 | 1.71e-05 | 1.73e-04 | 1.10e-04 | 51 |
| hsa052301 | Colorectum | AD | Central carbon metabolism in cancer | 33/2092 | 70/8465 | 3.61e-05 | 3.19e-04 | 2.03e-04 | 33 |
| hsa041521 | Colorectum | AD | AMPK signaling pathway | 47/2092 | 121/8465 | 3.74e-04 | 2.82e-03 | 1.80e-03 | 47 |
| hsa049221 | Colorectum | AD | Glucagon signaling pathway | 41/2092 | 107/8465 | 1.18e-03 | 7.75e-03 | 4.94e-03 | 41 |
| hsa000511 | Colorectum | AD | Fructose and mannose metabolism | 17/2092 | 34/8465 | 1.25e-03 | 8.02e-03 | 5.12e-03 | 17 |
| hsa012301 | Colorectum | AD | Biosynthesis of amino acids | 28/2092 | 75/8465 | 9.99e-03 | 3.89e-02 | 2.48e-02 | 28 |
| hsa049222 | Colorectum | SER | Glucagon signaling pathway | 38/1580 | 107/8465 | 2.57e-05 | 3.28e-04 | 2.38e-04 | 38 |
| hsa012002 | Colorectum | SER | Carbon metabolism | 40/1580 | 115/8465 | 2.77e-05 | 3.41e-04 | 2.47e-04 | 40 |
| Page: 1 2 3 4 5 6 7 8 |
Top |
Cell-cell communication analysis |
| Identification of potential cell-cell interactions between two cell types and their ligand-receptor pairs for different disease states |
| Ligand | Receptor | LRpair | Pathway | Tissue | Disease Stage |
| Page: 1 |
Top |
Single-cell gene regulatory network inference analysis |
| Find out the significant the regulons (TFs) and the target genes of each regulon across cell types for different disease states |
| TF | Cell Type | Tissue | Disease Stage | Target Gene | RSS | Regulon Activity |
| ∗The dot plots of a searched regulon are shown for all cell subpopulations in each disease state of each tissue based on the regulon specific score inferred using pySCENIC and by calculating the average expression. |
| Page: 1 |
Top |
Somatic mutation of malignant transformation related genes |
| Annotation of somatic variants for genes involved in malignant transformation |
| Hugo Symbol | Variant Class | Variant Classification | dbSNP RS | HGVSc | HGVSp | HGVSp Short | SWISSPROT | BIOTYPE | SIFT | PolyPhen | Tumor Sample Barcode | Tissue | Histology | Sex | Age | Stage | Therapy Types | Drugs | Outcome |
| PFKL | SNV | Missense_Mutation | rs532660507 | c.2093N>A | p.Arg698Gln | p.R698Q | P17858 | protein_coding | tolerated(0.12) | benign(0.058) | TCGA-OL-A5S0-01 | Breast | breast invasive carcinoma | Female | >=65 | I/II | Chemotherapy | taxol | CR |
| PFKL | SNV | Missense_Mutation | rs372280224 | c.868N>A | p.Asp290Asn | p.D290N | P17858 | protein_coding | deleterious(0) | probably_damaging(0.992) | TCGA-2W-A8YY-01 | Cervix | cervical & endocervical cancer | Female | <65 | I/II | Chemotherapy | cisplatin | CR |
| PFKL | SNV | Missense_Mutation | c.1048N>A | p.Glu350Lys | p.E350K | P17858 | protein_coding | tolerated(0.19) | benign(0.014) | TCGA-2W-A8YY-01 | Cervix | cervical & endocervical cancer | Female | <65 | I/II | Chemotherapy | cisplatin | CR | |
| PFKL | SNV | Missense_Mutation | novel | c.2131N>A | p.Gly711Ser | p.G711S | P17858 | protein_coding | deleterious(0) | possibly_damaging(0.839) | TCGA-2W-A8YY-01 | Cervix | cervical & endocervical cancer | Female | <65 | I/II | Chemotherapy | cisplatin | CR |
| PFKL | SNV | Missense_Mutation | novel | c.95N>T | p.Ala32Val | p.A32V | P17858 | protein_coding | deleterious(0) | probably_damaging(0.996) | TCGA-VS-A8QA-01 | Cervix | cervical & endocervical cancer | Female | <65 | I/II | Unknown | Unknown | SD |
| PFKL | SNV | Missense_Mutation | c.1765N>A | p.Ala589Thr | p.A589T | P17858 | protein_coding | deleterious(0.01) | probably_damaging(0.999) | TCGA-AA-A01P-01 | Colorectum | colon adenocarcinoma | Female | >=65 | III/IV | Unknown | Unknown | PD | |
| PFKL | SNV | Missense_Mutation | rs746385697 | c.911N>T | p.Thr304Met | p.T304M | P17858 | protein_coding | deleterious(0) | possibly_damaging(0.652) | TCGA-AA-A022-01 | Colorectum | colon adenocarcinoma | Female | >=65 | I/II | Unknown | Unknown | SD |
| PFKL | SNV | Missense_Mutation | novel | c.925N>A | p.Asp309Asn | p.D309N | P17858 | protein_coding | deleterious(0) | probably_damaging(1) | TCGA-AZ-4315-01 | Colorectum | colon adenocarcinoma | Male | <65 | I/II | Unknown | Unknown | SD |
| PFKL | SNV | Missense_Mutation | c.966G>A | p.Met322Ile | p.M322I | P17858 | protein_coding | tolerated(0.3) | benign(0.001) | TCGA-AZ-6601-01 | Colorectum | colon adenocarcinoma | Male | >=65 | I/II | Unknown | Unknown | PD | |
| PFKL | SNV | Missense_Mutation | rs144853438 | c.1876C>T | p.Arg626Trp | p.R626W | P17858 | protein_coding | deleterious(0) | probably_damaging(1) | TCGA-AZ-6601-01 | Colorectum | colon adenocarcinoma | Male | >=65 | I/II | Unknown | Unknown | PD |
| Page: 1 2 3 4 5 6 7 8 9 |
Top |
Related drugs of malignant transformation related genes |
| Identification of chemicals and drugs interact with genes involved in malignant transfromation |
| (DGIdb 4.0) |
| Entrez ID | Symbol | Category | Interaction Types | Drug Claim Name | Drug Name | PMIDs |
| Page: 1 |

Copyright 2023-Present -The University of Texas Health Science Center at Houston |