
|
|||||
|
 | |
| |
| |
| |
| |
| |
|
Gene: PFKFB4 |
Gene summary for PFKFB4 |
| Gene information | Species | Human | Gene symbol | PFKFB4 | Gene ID | 5210 |
| Gene name | 6-phosphofructo-2-kinase/fructose-2,6-biphosphatase 4 | |
| Gene Alias | PFKFB4 | |
| Cytomap | 3p21.31 | |
| Gene Type | protein-coding | GO ID | GO:0005975 | UniProtAcc | Q16877 |
Top |
Malignant transformation analysis |
| Identification of the aberrant gene expression in precancerous and cancerous lesions by comparing the gene expression of stem-like cells in diseased tissues with normal stem cells |
| Entrez ID | Symbol | Replicates | Species | Organ | Tissue | Adj P-value | Log2FC | Malignancy |
| 5210 | PFKFB4 | HTA11_1938_2000001011 | Human | Colorectum | AD | 7.94e-04 | 2.99e-01 | -0.0811 |
| 5210 | PFKFB4 | HTA11_696_2000001011 | Human | Colorectum | AD | 2.56e-03 | 2.71e-01 | -0.1464 |
| 5210 | PFKFB4 | HTA11_866_2000001011 | Human | Colorectum | AD | 1.28e-03 | 2.92e-01 | -0.1001 |
| 5210 | PFKFB4 | LZE4T | Human | Esophagus | ESCC | 6.35e-03 | 1.33e-01 | 0.0811 |
| 5210 | PFKFB4 | P4T-E | Human | Esophagus | ESCC | 6.27e-06 | 1.54e-01 | 0.1323 |
| 5210 | PFKFB4 | P5T-E | Human | Esophagus | ESCC | 3.75e-03 | 1.01e-01 | 0.1327 |
| 5210 | PFKFB4 | P10T-E | Human | Esophagus | ESCC | 9.20e-06 | 1.31e-01 | 0.116 |
| 5210 | PFKFB4 | P12T-E | Human | Esophagus | ESCC | 8.84e-05 | 1.26e-01 | 0.1122 |
| 5210 | PFKFB4 | P15T-E | Human | Esophagus | ESCC | 5.19e-07 | 1.83e-01 | 0.1149 |
| 5210 | PFKFB4 | P21T-E | Human | Esophagus | ESCC | 1.66e-02 | 6.36e-02 | 0.1617 |
| 5210 | PFKFB4 | P26T-E | Human | Esophagus | ESCC | 1.53e-19 | 4.27e-01 | 0.1276 |
| 5210 | PFKFB4 | P28T-E | Human | Esophagus | ESCC | 1.78e-03 | 1.27e-01 | 0.1149 |
| 5210 | PFKFB4 | P32T-E | Human | Esophagus | ESCC | 3.97e-04 | 1.26e-01 | 0.1666 |
| 5210 | PFKFB4 | P37T-E | Human | Esophagus | ESCC | 2.31e-05 | 1.56e-01 | 0.1371 |
| 5210 | PFKFB4 | P38T-E | Human | Esophagus | ESCC | 4.17e-18 | 6.59e-01 | 0.127 |
| 5210 | PFKFB4 | P42T-E | Human | Esophagus | ESCC | 3.05e-02 | 9.14e-02 | 0.1175 |
| 5210 | PFKFB4 | P49T-E | Human | Esophagus | ESCC | 3.28e-15 | 9.32e-01 | 0.1768 |
| 5210 | PFKFB4 | P74T-E | Human | Esophagus | ESCC | 1.42e-04 | 1.61e-01 | 0.1479 |
| 5210 | PFKFB4 | P79T-E | Human | Esophagus | ESCC | 4.31e-06 | 1.73e-01 | 0.1154 |
| 5210 | PFKFB4 | P80T-E | Human | Esophagus | ESCC | 3.16e-03 | 1.22e-01 | 0.155 |
| Page: 1 2 |
| Tissue | Expression Dynamics | Abbreviation |
| Colorectum (GSE201348) |  | FAP: Familial adenomatous polyposis |
| CRC: Colorectal cancer | ||
| Colorectum (HTA11) |  | AD: Adenomas |
| SER: Sessile serrated lesions | ||
| MSI-H: Microsatellite-high colorectal cancer | ||
| MSS: Microsatellite stable colorectal cancer | ||
| Esophagus | 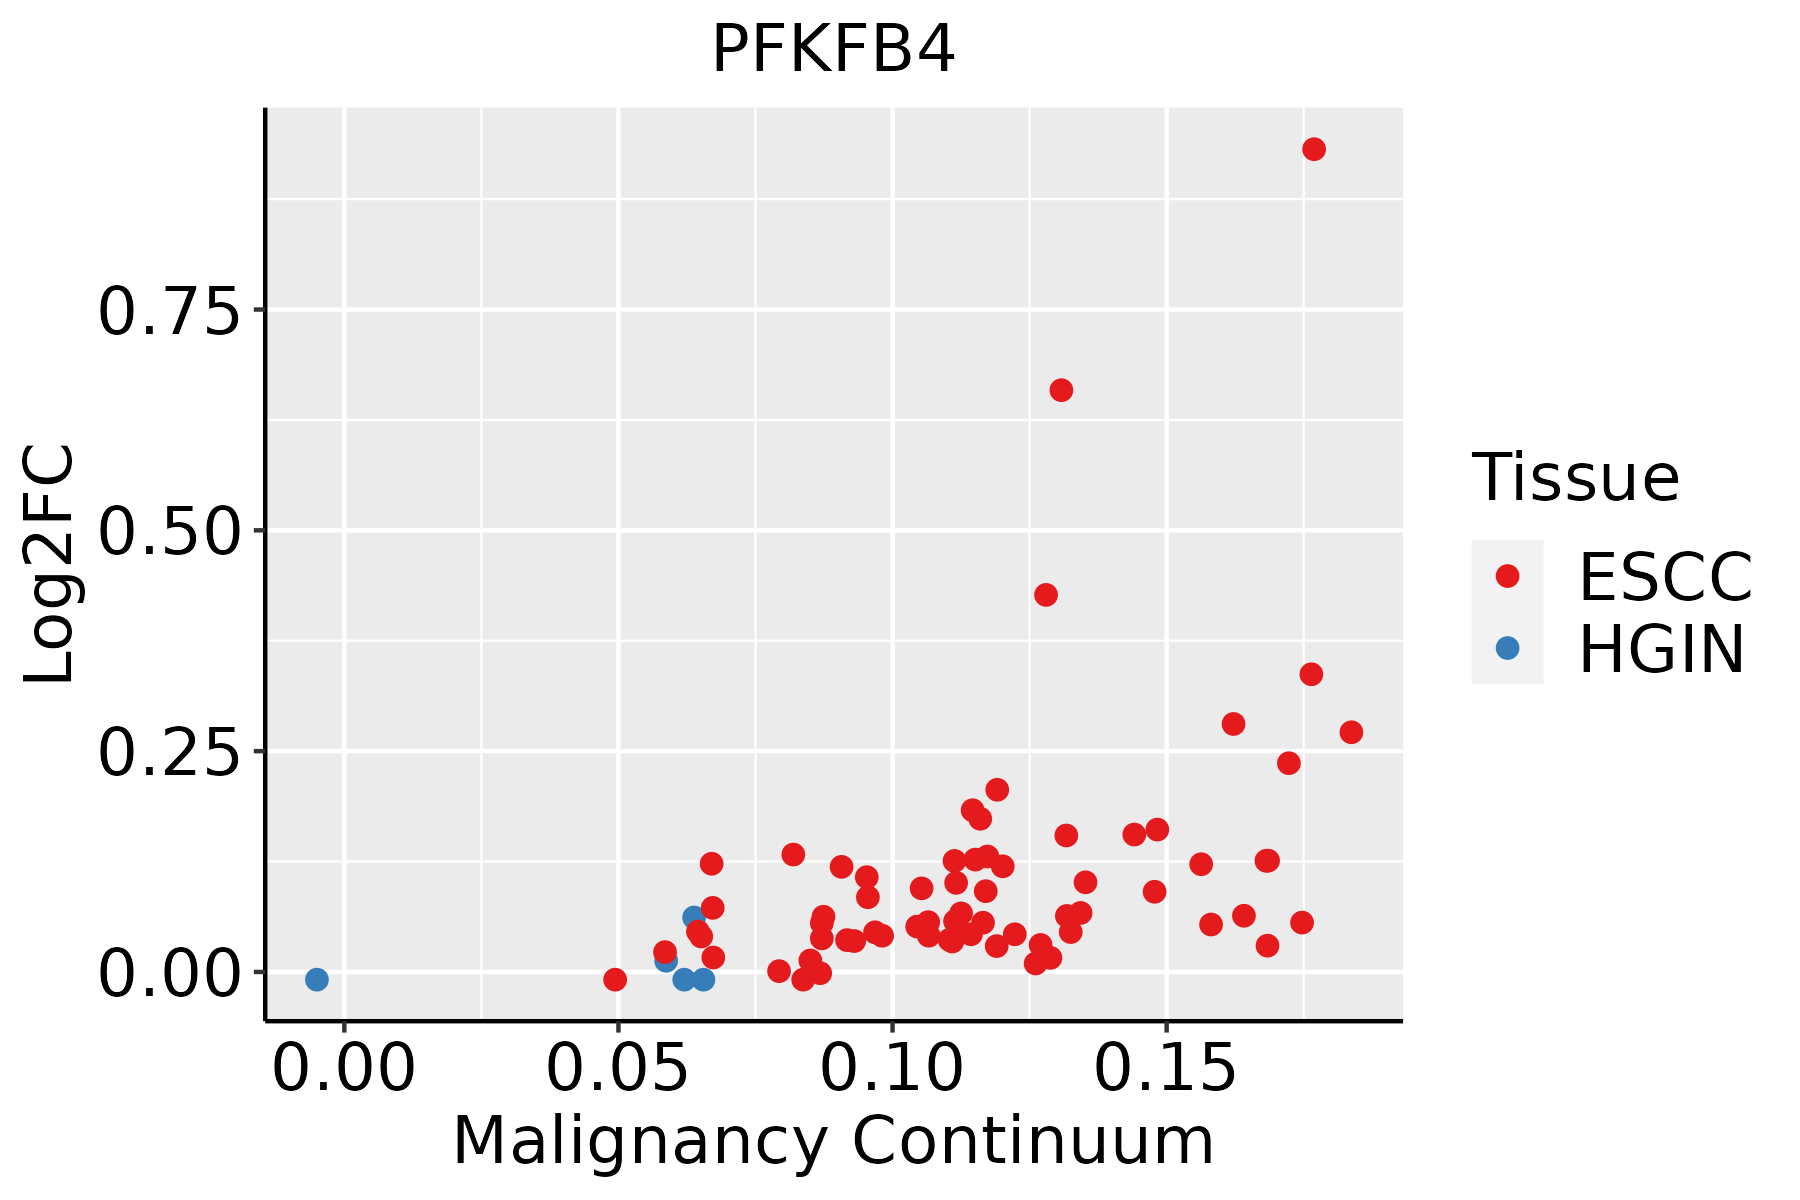 | ESCC: Esophageal squamous cell carcinoma |
| HGIN: High-grade intraepithelial neoplasias | ||
| LGIN: Low-grade intraepithelial neoplasias |
| ∗log2FC in expression of this searched gene in stem-like cells from each diseased tissue sample relative to stem-like cells in normal samples in each tissue plotted against the malignancy continuum. Samples are colored based on if they are from different disease stage. |
Top |
Malignant transformation related pathway analysis |
| Find out the enriched GO biological processes and KEGG pathways involved in transition from healthy to precancer to cancer |
| Tissue | Disease Stage | Enriched GO biological Processes |
| Colorectum | AD |  |
| Colorectum | SER |  |
| Colorectum | MSS |  |
| Colorectum | MSI-H |  |
| Colorectum | FAP |  |
| ∗Top 15 enriched GO BP terms are showed in the bar plot of each disease state in each tissue. Each row represents a significant GO biological process which is colored according to the -log10(p.adjust). |
| Page: 1 2 3 4 5 6 7 8 9 |
| GO ID | Tissue | Disease Stage | Description | Gene Ratio | Bg Ratio | pvalue | p.adjust | Count |
| GO:0016311 | Colorectum | AD | dephosphorylation | 123/3918 | 417/18723 | 1.84e-05 | 3.82e-04 | 123 |
| GO:0019318 | Colorectum | AD | hexose metabolic process | 77/3918 | 237/18723 | 1.96e-05 | 4.01e-04 | 77 |
| GO:0044262 | Colorectum | AD | cellular carbohydrate metabolic process | 87/3918 | 283/18723 | 6.00e-05 | 1.01e-03 | 87 |
| GO:0005996 | Colorectum | AD | monosaccharide metabolic process | 80/3918 | 257/18723 | 7.31e-05 | 1.17e-03 | 80 |
| GO:001631110 | Esophagus | ESCC | dephosphorylation | 251/8552 | 417/18723 | 1.26e-09 | 2.99e-08 | 251 |
| GO:00059969 | Esophagus | ESCC | monosaccharide metabolic process | 159/8552 | 257/18723 | 1.11e-07 | 1.81e-06 | 159 |
| GO:00193189 | Esophagus | ESCC | hexose metabolic process | 147/8552 | 237/18723 | 2.63e-07 | 3.94e-06 | 147 |
| GO:00442626 | Esophagus | ESCC | cellular carbohydrate metabolic process | 160/8552 | 283/18723 | 1.43e-04 | 9.66e-04 | 160 |
| Page: 1 |
| Pathway ID | Tissue | Disease Stage | Description | Gene Ratio | Bg Ratio | pvalue | p.adjust | qvalue | Count |
| hsa04152 | Colorectum | AD | AMPK signaling pathway | 47/2092 | 121/8465 | 3.74e-04 | 2.82e-03 | 1.80e-03 | 47 |
| hsa00051 | Colorectum | AD | Fructose and mannose metabolism | 17/2092 | 34/8465 | 1.25e-03 | 8.02e-03 | 5.12e-03 | 17 |
| hsa041521 | Colorectum | AD | AMPK signaling pathway | 47/2092 | 121/8465 | 3.74e-04 | 2.82e-03 | 1.80e-03 | 47 |
| hsa000511 | Colorectum | AD | Fructose and mannose metabolism | 17/2092 | 34/8465 | 1.25e-03 | 8.02e-03 | 5.12e-03 | 17 |
| hsa0415210 | Esophagus | ESCC | AMPK signaling pathway | 80/4205 | 121/8465 | 1.73e-04 | 6.67e-04 | 3.42e-04 | 80 |
| hsa000512 | Esophagus | ESCC | Fructose and mannose metabolism | 24/4205 | 34/8465 | 1.09e-02 | 2.51e-02 | 1.29e-02 | 24 |
| hsa0415213 | Esophagus | ESCC | AMPK signaling pathway | 80/4205 | 121/8465 | 1.73e-04 | 6.67e-04 | 3.42e-04 | 80 |
| hsa0005111 | Esophagus | ESCC | Fructose and mannose metabolism | 24/4205 | 34/8465 | 1.09e-02 | 2.51e-02 | 1.29e-02 | 24 |
| Page: 1 |
Top |
Cell-cell communication analysis |
| Identification of potential cell-cell interactions between two cell types and their ligand-receptor pairs for different disease states |
| Ligand | Receptor | LRpair | Pathway | Tissue | Disease Stage |
| Page: 1 |
Top |
Single-cell gene regulatory network inference analysis |
| Find out the significant the regulons (TFs) and the target genes of each regulon across cell types for different disease states |
| TF | Cell Type | Tissue | Disease Stage | Target Gene | RSS | Regulon Activity |
| ∗The dot plots of a searched regulon are shown for all cell subpopulations in each disease state of each tissue based on the regulon specific score inferred using pySCENIC and by calculating the average expression. |
| Page: 1 |
Top |
Somatic mutation of malignant transformation related genes |
| Annotation of somatic variants for genes involved in malignant transformation |
| Hugo Symbol | Variant Class | Variant Classification | dbSNP RS | HGVSc | HGVSp | HGVSp Short | SWISSPROT | BIOTYPE | SIFT | PolyPhen | Tumor Sample Barcode | Tissue | Histology | Sex | Age | Stage | Therapy Types | Drugs | Outcome |
| PFKFB4 | SNV | Missense_Mutation | c.1220N>A | p.Ala407Glu | p.A407E | Q16877 | protein_coding | benign(0.086) | TCGA-A2-A0CP-01 | Breast | breast invasive carcinoma | Female | <65 | I/II | Chemotherapy | cytoxan | SD | ||
| PFKFB4 | SNV | Missense_Mutation | c.1367G>A | p.Arg456Lys | p.R456K | Q16877 | protein_coding | benign(0.099) | TCGA-GM-A2D9-01 | Breast | breast invasive carcinoma | Female | >=65 | I/II | Hormone Therapy | arimidex | SD | ||
| PFKFB4 | insertion | Nonsense_Mutation | novel | c.720_721insGGGGCTAGGCTCCCATTCTTTTAATGTGCAGTCGAGG | p.Tyr241GlyfsTer8 | p.Y241Gfs*8 | Q16877 | protein_coding | TCGA-AO-A0J9-01 | Breast | breast invasive carcinoma | Female | <65 | III/IV | Chemotherapy | cyclophosphamide | PD | ||
| PFKFB4 | insertion | Nonsense_Mutation | novel | c.665_666insAGTTTGCTTATGATGTATTTCAGTTTGCCAAGAGTCTAGCC | p.Gln223ValfsTer4 | p.Q223Vfs*4 | Q16877 | protein_coding | TCGA-BH-A0EE-01 | Breast | breast invasive carcinoma | Female | >=65 | I/II | Chemotherapy | docetaxel | SD | ||
| PFKFB4 | SNV | Missense_Mutation | novel | c.1150G>C | p.Glu384Gln | p.E384Q | Q16877 | protein_coding | benign(0.109) | TCGA-DS-A1OB-01 | Cervix | cervical & endocervical cancer | Female | <65 | I/II | Chemotherapy | carboplatin | PD | |
| PFKFB4 | SNV | Missense_Mutation | c.1280N>T | p.Ala427Val | p.A427V | Q16877 | protein_coding | possibly_damaging(0.658) | TCGA-AA-3864-01 | Colorectum | colon adenocarcinoma | Male | >=65 | I/II | Unknown | Unknown | SD | ||
| PFKFB4 | SNV | Missense_Mutation | novel | c.734N>C | p.Ile245Thr | p.I245T | Q16877 | protein_coding | probably_damaging(0.96) | TCGA-AA-3864-01 | Colorectum | colon adenocarcinoma | Male | >=65 | I/II | Unknown | Unknown | SD | |
| PFKFB4 | SNV | Missense_Mutation | novel | c.171N>T | p.Lys57Asn | p.K57N | Q16877 | protein_coding | benign(0.432) | TCGA-AA-3984-01 | Colorectum | colon adenocarcinoma | Female | <65 | I/II | Unknown | Unknown | SD | |
| PFKFB4 | SNV | Missense_Mutation | c.1152N>T | p.Glu384Asp | p.E384D | Q16877 | protein_coding | benign(0.001) | TCGA-AZ-4315-01 | Colorectum | colon adenocarcinoma | Male | <65 | I/II | Unknown | Unknown | SD | ||
| PFKFB4 | SNV | Missense_Mutation | novel | c.416N>G | p.Ala139Gly | p.A139G | Q16877 | protein_coding | benign(0) | TCGA-AZ-5403-01 | Colorectum | colon adenocarcinoma | Male | <65 | I/II | Unknown | Unknown | PD |
| Page: 1 2 3 4 |
Top |
Related drugs of malignant transformation related genes |
| Identification of chemicals and drugs interact with genes involved in malignant transfromation |
| (DGIdb 4.0) |
| Entrez ID | Symbol | Category | Interaction Types | Drug Claim Name | Drug Name | PMIDs |
| Page: 1 |

Copyright 2023-Present -The University of Texas Health Science Center at Houston |