
|
|||||
|
 | |
| |
| |
| |
| |
| |
|
Gene: PFKFB2 |
Gene summary for PFKFB2 |
| Gene information | Species | Human | Gene symbol | PFKFB2 | Gene ID | 5208 |
| Gene name | 6-phosphofructo-2-kinase/fructose-2,6-biphosphatase 2 | |
| Gene Alias | PFK-2/FBPase-2 | |
| Cytomap | 1q32.1 | |
| Gene Type | protein-coding | GO ID | GO:0002790 | UniProtAcc | O60825 |
Top |
Malignant transformation analysis |
| Identification of the aberrant gene expression in precancerous and cancerous lesions by comparing the gene expression of stem-like cells in diseased tissues with normal stem cells |
| Entrez ID | Symbol | Replicates | Species | Organ | Tissue | Adj P-value | Log2FC | Malignancy |
| 5208 | PFKFB2 | HTA11_347_2000001011 | Human | Colorectum | AD | 3.00e-14 | 5.57e-01 | -0.1954 |
| 5208 | PFKFB2 | HTA11_99999974143_84620 | Human | Colorectum | MSS | 1.29e-05 | -3.12e-01 | 0.3005 |
| 5208 | PFKFB2 | A002-C-010 | Human | Colorectum | FAP | 2.91e-07 | -2.30e-01 | 0.242 |
| 5208 | PFKFB2 | A015-C-203 | Human | Colorectum | FAP | 7.12e-17 | -2.87e-01 | -0.1294 |
| 5208 | PFKFB2 | A015-C-204 | Human | Colorectum | FAP | 3.03e-02 | -2.82e-01 | -0.0228 |
| 5208 | PFKFB2 | A002-C-201 | Human | Colorectum | FAP | 5.40e-06 | -2.56e-01 | 0.0324 |
| 5208 | PFKFB2 | A002-C-203 | Human | Colorectum | FAP | 2.15e-04 | -2.08e-01 | 0.2786 |
| 5208 | PFKFB2 | A001-C-119 | Human | Colorectum | FAP | 3.11e-02 | -3.29e-01 | -0.1557 |
| 5208 | PFKFB2 | A001-C-108 | Human | Colorectum | FAP | 1.15e-12 | -3.31e-01 | -0.0272 |
| 5208 | PFKFB2 | A002-C-205 | Human | Colorectum | FAP | 3.23e-10 | -3.55e-01 | -0.1236 |
| 5208 | PFKFB2 | A001-C-104 | Human | Colorectum | FAP | 1.48e-08 | -3.00e-01 | 0.0184 |
| 5208 | PFKFB2 | A015-C-006 | Human | Colorectum | FAP | 7.50e-06 | -3.70e-01 | -0.0994 |
| 5208 | PFKFB2 | A015-C-106 | Human | Colorectum | FAP | 5.70e-10 | -2.44e-01 | -0.0511 |
| 5208 | PFKFB2 | A002-C-114 | Human | Colorectum | FAP | 1.83e-05 | -2.30e-01 | -0.1561 |
| 5208 | PFKFB2 | A015-C-104 | Human | Colorectum | FAP | 8.06e-18 | -3.04e-01 | -0.1899 |
| 5208 | PFKFB2 | A001-C-014 | Human | Colorectum | FAP | 1.01e-12 | -3.23e-01 | 0.0135 |
| 5208 | PFKFB2 | A002-C-016 | Human | Colorectum | FAP | 3.91e-08 | -2.23e-01 | 0.0521 |
| 5208 | PFKFB2 | A015-C-002 | Human | Colorectum | FAP | 9.40e-03 | -2.27e-01 | -0.0763 |
| 5208 | PFKFB2 | A001-C-203 | Human | Colorectum | FAP | 1.35e-08 | -2.48e-01 | -0.0481 |
| 5208 | PFKFB2 | A002-C-116 | Human | Colorectum | FAP | 5.64e-15 | -2.88e-01 | -0.0452 |
| Page: 1 2 |
| Tissue | Expression Dynamics | Abbreviation |
| Colorectum (GSE201348) |  | FAP: Familial adenomatous polyposis |
| CRC: Colorectal cancer | ||
| Colorectum (HTA11) |  | AD: Adenomas |
| SER: Sessile serrated lesions | ||
| MSI-H: Microsatellite-high colorectal cancer | ||
| MSS: Microsatellite stable colorectal cancer | ||
| GC | 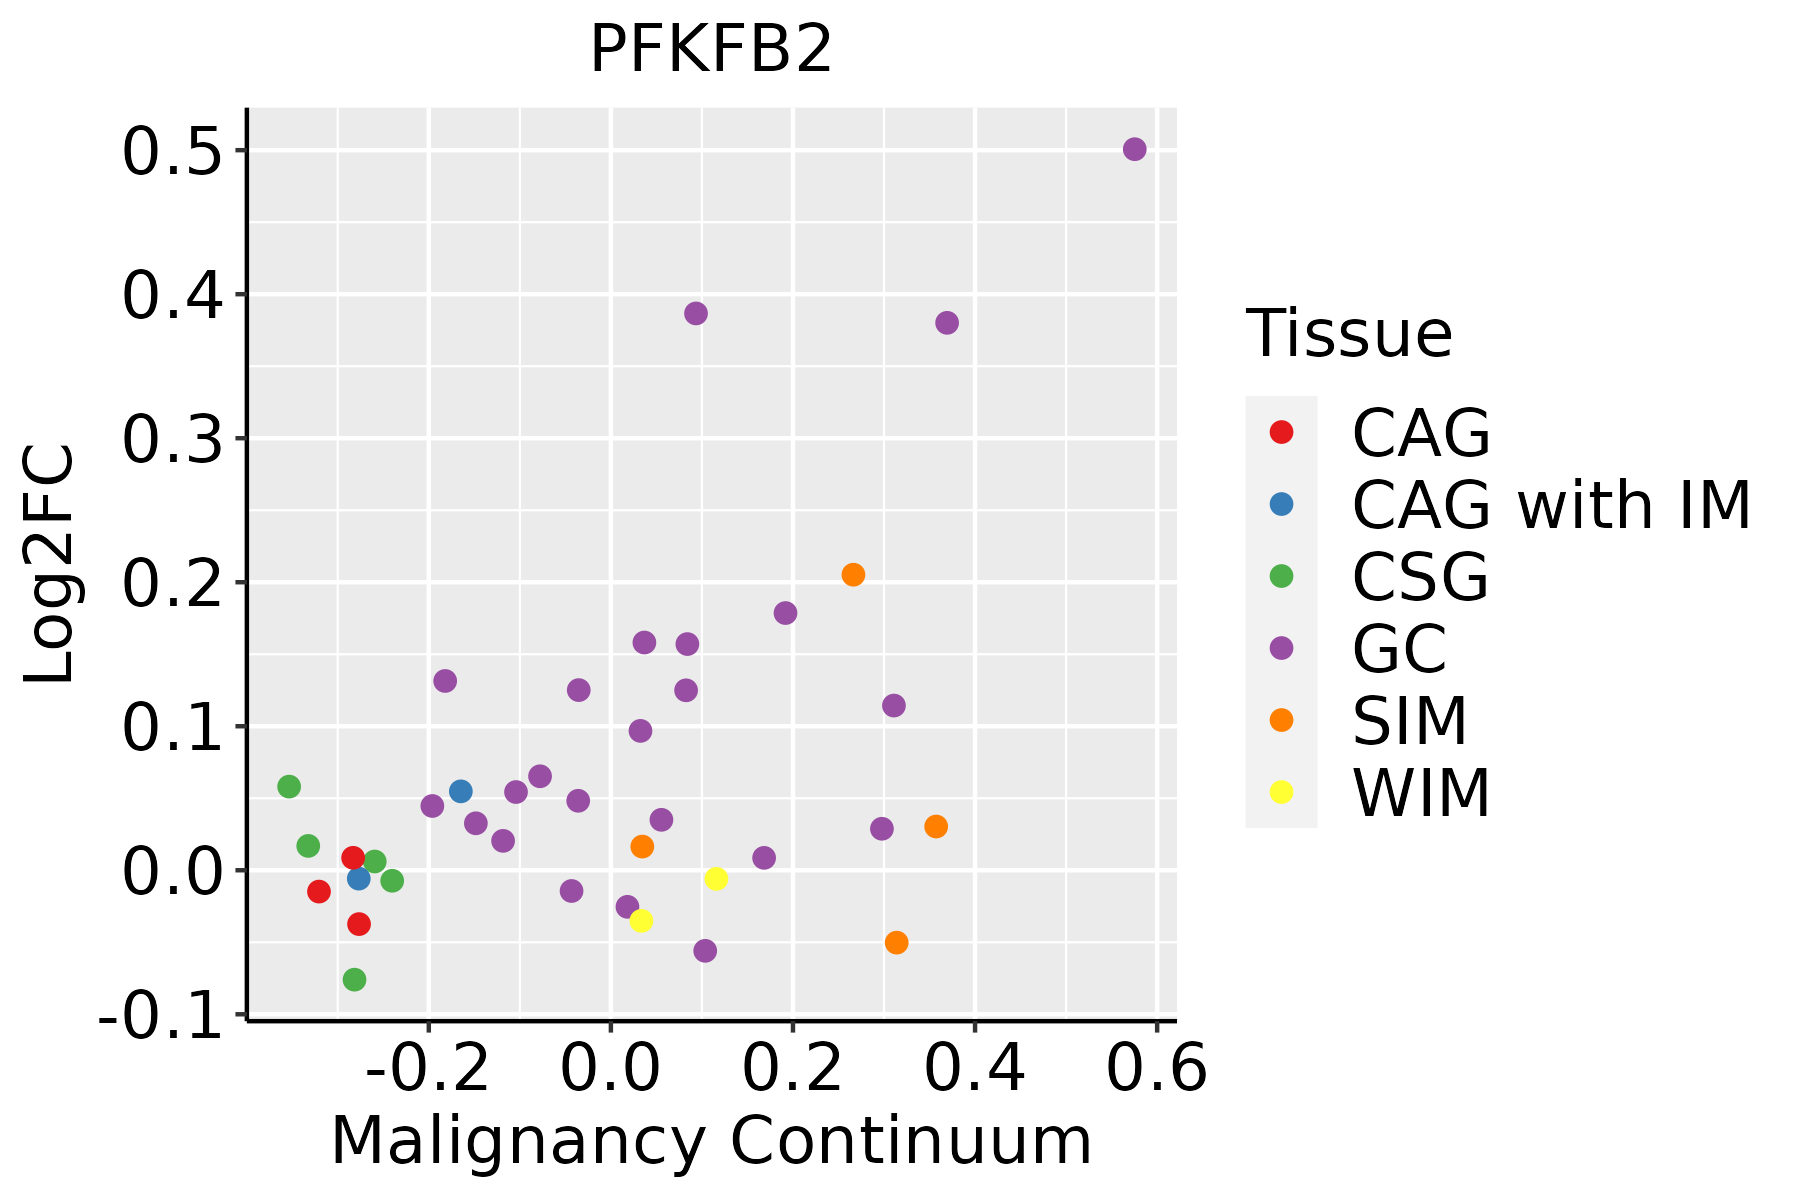 | CAG: Chronic atrophic gastritis |
| CAG with IM: Chronic atrophic gastritis with intestinal metaplasia | ||
| CSG: Chronic superficial gastritis | ||
| GC: Gastric cancer | ||
| SIM: Severe intestinal metaplasia | ||
| WIM: Wild intestinal metaplasia |
| ∗log2FC in expression of this searched gene in stem-like cells from each diseased tissue sample relative to stem-like cells in normal samples in each tissue plotted against the malignancy continuum. Samples are colored based on if they are from different disease stage. |
Top |
Malignant transformation related pathway analysis |
| Find out the enriched GO biological processes and KEGG pathways involved in transition from healthy to precancer to cancer |
| Tissue | Disease Stage | Enriched GO biological Processes |
| Colorectum | AD |  |
| Colorectum | SER |  |
| Colorectum | MSS |  |
| Colorectum | MSI-H |  |
| Colorectum | FAP |  |
| ∗Top 15 enriched GO BP terms are showed in the bar plot of each disease state in each tissue. Each row represents a significant GO biological process which is colored according to the -log10(p.adjust). |
| Page: 1 2 3 4 5 6 7 8 9 |
| GO ID | Tissue | Disease Stage | Description | Gene Ratio | Bg Ratio | pvalue | p.adjust | Count |
| GO:0046034 | Colorectum | AD | ATP metabolic process | 142/3918 | 277/18723 | 2.64e-29 | 8.26e-26 | 142 |
| GO:0006091 | Colorectum | AD | generation of precursor metabolites and energy | 209/3918 | 490/18723 | 3.17e-28 | 6.61e-25 | 209 |
| GO:0009150 | Colorectum | AD | purine ribonucleotide metabolic process | 142/3918 | 368/18723 | 4.29e-15 | 1.17e-12 | 142 |
| GO:0006163 | Colorectum | AD | purine nucleotide metabolic process | 149/3918 | 396/18723 | 1.08e-14 | 2.80e-12 | 149 |
| GO:0072521 | Colorectum | AD | purine-containing compound metabolic process | 153/3918 | 416/18723 | 4.34e-14 | 1.01e-11 | 153 |
| GO:0009259 | Colorectum | AD | ribonucleotide metabolic process | 144/3918 | 385/18723 | 5.25e-14 | 1.13e-11 | 144 |
| GO:0019693 | Colorectum | AD | ribose phosphate metabolic process | 145/3918 | 396/18723 | 3.01e-13 | 5.71e-11 | 145 |
| GO:0009117 | Colorectum | AD | nucleotide metabolic process | 168/3918 | 489/18723 | 2.20e-12 | 3.36e-10 | 168 |
| GO:0006753 | Colorectum | AD | nucleoside phosphate metabolic process | 169/3918 | 497/18723 | 4.99e-12 | 6.98e-10 | 169 |
| GO:1904951 | Colorectum | AD | positive regulation of establishment of protein localization | 112/3918 | 319/18723 | 2.55e-09 | 1.80e-07 | 112 |
| GO:0051222 | Colorectum | AD | positive regulation of protein transport | 106/3918 | 303/18723 | 8.45e-09 | 5.08e-07 | 106 |
| GO:0009135 | Colorectum | AD | purine nucleoside diphosphate metabolic process | 47/3918 | 103/18723 | 1.61e-08 | 9.22e-07 | 47 |
| GO:0009179 | Colorectum | AD | purine ribonucleoside diphosphate metabolic process | 47/3918 | 103/18723 | 1.61e-08 | 9.22e-07 | 47 |
| GO:0006090 | Colorectum | AD | pyruvate metabolic process | 47/3918 | 106/18723 | 4.85e-08 | 2.55e-06 | 47 |
| GO:0009185 | Colorectum | AD | ribonucleoside diphosphate metabolic process | 47/3918 | 106/18723 | 4.85e-08 | 2.55e-06 | 47 |
| GO:0046031 | Colorectum | AD | ADP metabolic process | 41/3918 | 90/18723 | 1.37e-07 | 6.42e-06 | 41 |
| GO:0006096 | Colorectum | AD | glycolytic process | 38/3918 | 81/18723 | 1.52e-07 | 6.78e-06 | 38 |
| GO:0006757 | Colorectum | AD | ATP generation from ADP | 38/3918 | 82/18723 | 2.26e-07 | 9.37e-06 | 38 |
| GO:0009743 | Colorectum | AD | response to carbohydrate | 86/3918 | 253/18723 | 8.43e-07 | 2.90e-05 | 86 |
| GO:0044282 | Colorectum | AD | small molecule catabolic process | 118/3918 | 376/18723 | 1.05e-06 | 3.55e-05 | 118 |
| Page: 1 2 3 4 5 6 7 8 9 10 11 12 13 14 15 |
| Pathway ID | Tissue | Disease Stage | Description | Gene Ratio | Bg Ratio | pvalue | p.adjust | qvalue | Count |
| hsa04919 | Colorectum | AD | Thyroid hormone signaling pathway | 51/2092 | 121/8465 | 1.71e-05 | 1.73e-04 | 1.10e-04 | 51 |
| hsa04152 | Colorectum | AD | AMPK signaling pathway | 47/2092 | 121/8465 | 3.74e-04 | 2.82e-03 | 1.80e-03 | 47 |
| hsa00051 | Colorectum | AD | Fructose and mannose metabolism | 17/2092 | 34/8465 | 1.25e-03 | 8.02e-03 | 5.12e-03 | 17 |
| hsa049191 | Colorectum | AD | Thyroid hormone signaling pathway | 51/2092 | 121/8465 | 1.71e-05 | 1.73e-04 | 1.10e-04 | 51 |
| hsa041521 | Colorectum | AD | AMPK signaling pathway | 47/2092 | 121/8465 | 3.74e-04 | 2.82e-03 | 1.80e-03 | 47 |
| hsa000511 | Colorectum | AD | Fructose and mannose metabolism | 17/2092 | 34/8465 | 1.25e-03 | 8.02e-03 | 5.12e-03 | 17 |
| hsa049198 | Colorectum | FAP | Thyroid hormone signaling pathway | 41/1404 | 121/8465 | 2.28e-06 | 4.28e-05 | 2.60e-05 | 41 |
| hsa041524 | Colorectum | FAP | AMPK signaling pathway | 37/1404 | 121/8465 | 8.97e-05 | 8.56e-04 | 5.21e-04 | 37 |
| hsa049199 | Colorectum | FAP | Thyroid hormone signaling pathway | 41/1404 | 121/8465 | 2.28e-06 | 4.28e-05 | 2.60e-05 | 41 |
| hsa041525 | Colorectum | FAP | AMPK signaling pathway | 37/1404 | 121/8465 | 8.97e-05 | 8.56e-04 | 5.21e-04 | 37 |
| hsa0491910 | Colorectum | CRC | Thyroid hormone signaling pathway | 35/1091 | 121/8465 | 2.05e-06 | 6.85e-05 | 4.64e-05 | 35 |
| hsa041526 | Colorectum | CRC | AMPK signaling pathway | 31/1091 | 121/8465 | 1.04e-04 | 1.57e-03 | 1.07e-03 | 31 |
| hsa0491911 | Colorectum | CRC | Thyroid hormone signaling pathway | 35/1091 | 121/8465 | 2.05e-06 | 6.85e-05 | 4.64e-05 | 35 |
| hsa041527 | Colorectum | CRC | AMPK signaling pathway | 31/1091 | 121/8465 | 1.04e-04 | 1.57e-03 | 1.07e-03 | 31 |
| Page: 1 |
Top |
Cell-cell communication analysis |
| Identification of potential cell-cell interactions between two cell types and their ligand-receptor pairs for different disease states |
| Ligand | Receptor | LRpair | Pathway | Tissue | Disease Stage |
| Page: 1 |
Top |
Single-cell gene regulatory network inference analysis |
| Find out the significant the regulons (TFs) and the target genes of each regulon across cell types for different disease states |
| TF | Cell Type | Tissue | Disease Stage | Target Gene | RSS | Regulon Activity |
| ∗The dot plots of a searched regulon are shown for all cell subpopulations in each disease state of each tissue based on the regulon specific score inferred using pySCENIC and by calculating the average expression. |
| Page: 1 |
Top |
Somatic mutation of malignant transformation related genes |
| Annotation of somatic variants for genes involved in malignant transformation |
| Hugo Symbol | Variant Class | Variant Classification | dbSNP RS | HGVSc | HGVSp | HGVSp Short | SWISSPROT | BIOTYPE | SIFT | PolyPhen | Tumor Sample Barcode | Tissue | Histology | Sex | Age | Stage | Therapy Types | Drugs | Outcome |
| PFKFB2 | SNV | Missense_Mutation | novel | c.830G>T | p.Arg277Leu | p.R277L | O60825 | protein_coding | benign(0.109) | TCGA-A7-A0DB-01 | Breast | breast invasive carcinoma | Female | <65 | I/II | Hormone Therapy | arimidex | SD | |
| PFKFB2 | SNV | Missense_Mutation | novel | c.1383N>C | p.Arg461Ser | p.R461S | O60825 | protein_coding | benign(0.119) | TCGA-A8-A07U-01 | Breast | breast invasive carcinoma | Female | >=65 | III/IV | Chemotherapy | 5-fluorouracil | SD | |
| PFKFB2 | SNV | Missense_Mutation | rs372621164 | c.113N>T | p.Pro38Leu | p.P38L | O60825 | protein_coding | probably_damaging(0.999) | TCGA-AN-A0FJ-01 | Breast | breast invasive carcinoma | Female | <65 | III/IV | Unknown | Unknown | SD | |
| PFKFB2 | SNV | Missense_Mutation | c.543N>T | p.Arg181Ser | p.R181S | O60825 | protein_coding | benign(0.057) | TCGA-AN-A0XN-01 | Breast | breast invasive carcinoma | Female | >=65 | III/IV | Unknown | Unknown | SD | ||
| PFKFB2 | SNV | Missense_Mutation | c.943N>T | p.Gly315Trp | p.G315W | O60825 | protein_coding | probably_damaging(0.973) | TCGA-D8-A1XK-01 | Breast | breast invasive carcinoma | Female | <65 | I/II | Chemotherapy | doxorubicine+cyclophosphamide | SD | ||
| PFKFB2 | insertion | In_Frame_Ins | novel | c.159_160insACA | p.Tyr53_Val54insThr | p.Y53_V54insT | O60825 | protein_coding | TCGA-A8-A08G-01 | Breast | breast invasive carcinoma | Female | <65 | I/II | Chemotherapy | 5-fluorouracil | CR | ||
| PFKFB2 | insertion | In_Frame_Ins | novel | c.188_189insGAAGTT | p.Asn63delinsLysLysPhe | p.N63delinsKKF | O60825 | protein_coding | TCGA-B6-A0IK-01 | Breast | breast invasive carcinoma | Female | <65 | III/IV | Unknown | Unknown | PD | ||
| PFKFB2 | insertion | In_Frame_Ins | novel | c.189_190insGTAGCTCAG | p.Asn63_Trp64insValAlaGln | p.N63_W64insVAQ | O60825 | protein_coding | TCGA-B6-A0IK-01 | Breast | breast invasive carcinoma | Female | <65 | III/IV | Unknown | Unknown | PD | ||
| PFKFB2 | insertion | In_Frame_Ins | novel | c.1218_1219insCAT | p.Gly406_Ala407insHis | p.G406_A407insH | O60825 | protein_coding | TCGA-BH-A0B8-01 | Breast | breast invasive carcinoma | Female | <65 | I/II | Hormone Therapy | arimidex | SD | ||
| PFKFB2 | insertion | Frame_Shift_Ins | novel | c.1221_1222insAAGCCCTCAAGAACATGCCTGACTCAGAGAA | p.Asp408LysfsTer12 | p.D408Kfs*12 | O60825 | protein_coding | TCGA-BH-A0B8-01 | Breast | breast invasive carcinoma | Female | <65 | I/II | Hormone Therapy | arimidex | SD |
| Page: 1 2 3 4 5 6 7 |
Top |
Related drugs of malignant transformation related genes |
| Identification of chemicals and drugs interact with genes involved in malignant transfromation |
| (DGIdb 4.0) |
| Entrez ID | Symbol | Category | Interaction Types | Drug Claim Name | Drug Name | PMIDs |
| Page: 1 |

Copyright 2023-Present -The University of Texas Health Science Center at Houston |