
|
|||||
|
 | |
| |
| |
| |
| |
| |
|
Gene: PFDN6 |
Gene summary for PFDN6 |
| Gene information | Species | Human | Gene symbol | PFDN6 | Gene ID | 10471 |
| Gene name | prefoldin subunit 6 | |
| Gene Alias | H2-KE2 | |
| Cytomap | 6p21.32 | |
| Gene Type | protein-coding | GO ID | GO:0006457 | UniProtAcc | O15212 |
Top |
Malignant transformation analysis |
| Identification of the aberrant gene expression in precancerous and cancerous lesions by comparing the gene expression of stem-like cells in diseased tissues with normal stem cells |
| Entrez ID | Symbol | Replicates | Species | Organ | Tissue | Adj P-value | Log2FC | Malignancy |
| 10471 | PFDN6 | HTA11_2487_2000001011 | Human | Colorectum | SER | 2.01e-02 | 2.29e-01 | -0.1808 |
| 10471 | PFDN6 | HTA11_1938_2000001011 | Human | Colorectum | AD | 3.19e-07 | 3.83e-01 | -0.0811 |
| 10471 | PFDN6 | HTA11_347_2000001011 | Human | Colorectum | AD | 4.45e-02 | 1.62e-01 | -0.1954 |
| 10471 | PFDN6 | HTA11_696_2000001011 | Human | Colorectum | AD | 6.51e-07 | 2.44e-01 | -0.1464 |
| 10471 | PFDN6 | HTA11_1391_2000001011 | Human | Colorectum | AD | 3.33e-10 | 4.18e-01 | -0.059 |
| 10471 | PFDN6 | HTA11_866_3004761011 | Human | Colorectum | AD | 3.09e-07 | 2.80e-01 | 0.096 |
| 10471 | PFDN6 | HTA11_6801_2000001011 | Human | Colorectum | SER | 2.02e-03 | 3.86e-01 | 0.0171 |
| 10471 | PFDN6 | HTA11_99999970781_79442 | Human | Colorectum | MSS | 6.04e-07 | 3.33e-01 | 0.294 |
| 10471 | PFDN6 | HTA11_99999965104_69814 | Human | Colorectum | MSS | 1.95e-07 | 3.80e-01 | 0.281 |
| 10471 | PFDN6 | HTA11_99999971662_82457 | Human | Colorectum | MSS | 1.84e-17 | 5.31e-01 | 0.3859 |
| 10471 | PFDN6 | HTA11_99999973899_84307 | Human | Colorectum | MSS | 6.29e-05 | 3.82e-01 | 0.2585 |
| 10471 | PFDN6 | HTA11_99999974143_84620 | Human | Colorectum | MSS | 2.80e-04 | 2.38e-01 | 0.3005 |
| 10471 | PFDN6 | LZE4T | Human | Esophagus | ESCC | 4.54e-12 | 4.45e-01 | 0.0811 |
| 10471 | PFDN6 | LZE5T | Human | Esophagus | ESCC | 1.52e-06 | 7.78e-01 | 0.0514 |
| 10471 | PFDN6 | LZE7T | Human | Esophagus | ESCC | 3.01e-16 | 8.25e-01 | 0.0667 |
| 10471 | PFDN6 | LZE8T | Human | Esophagus | ESCC | 1.59e-09 | 3.47e-01 | 0.067 |
| 10471 | PFDN6 | LZE20T | Human | Esophagus | ESCC | 2.44e-18 | 7.99e-01 | 0.0662 |
| 10471 | PFDN6 | LZE22D1 | Human | Esophagus | HGIN | 8.91e-08 | 3.48e-01 | 0.0595 |
| 10471 | PFDN6 | LZE22T | Human | Esophagus | ESCC | 2.52e-02 | 5.96e-01 | 0.068 |
| 10471 | PFDN6 | LZE24T | Human | Esophagus | ESCC | 6.30e-34 | 8.21e-01 | 0.0596 |
| Page: 1 2 3 4 5 6 7 8 |
| Tissue | Expression Dynamics | Abbreviation |
| Colorectum (GSE201348) |  | FAP: Familial adenomatous polyposis |
| CRC: Colorectal cancer | ||
| Colorectum (HTA11) |  | AD: Adenomas |
| SER: Sessile serrated lesions | ||
| MSI-H: Microsatellite-high colorectal cancer | ||
| MSS: Microsatellite stable colorectal cancer | ||
| Esophagus | 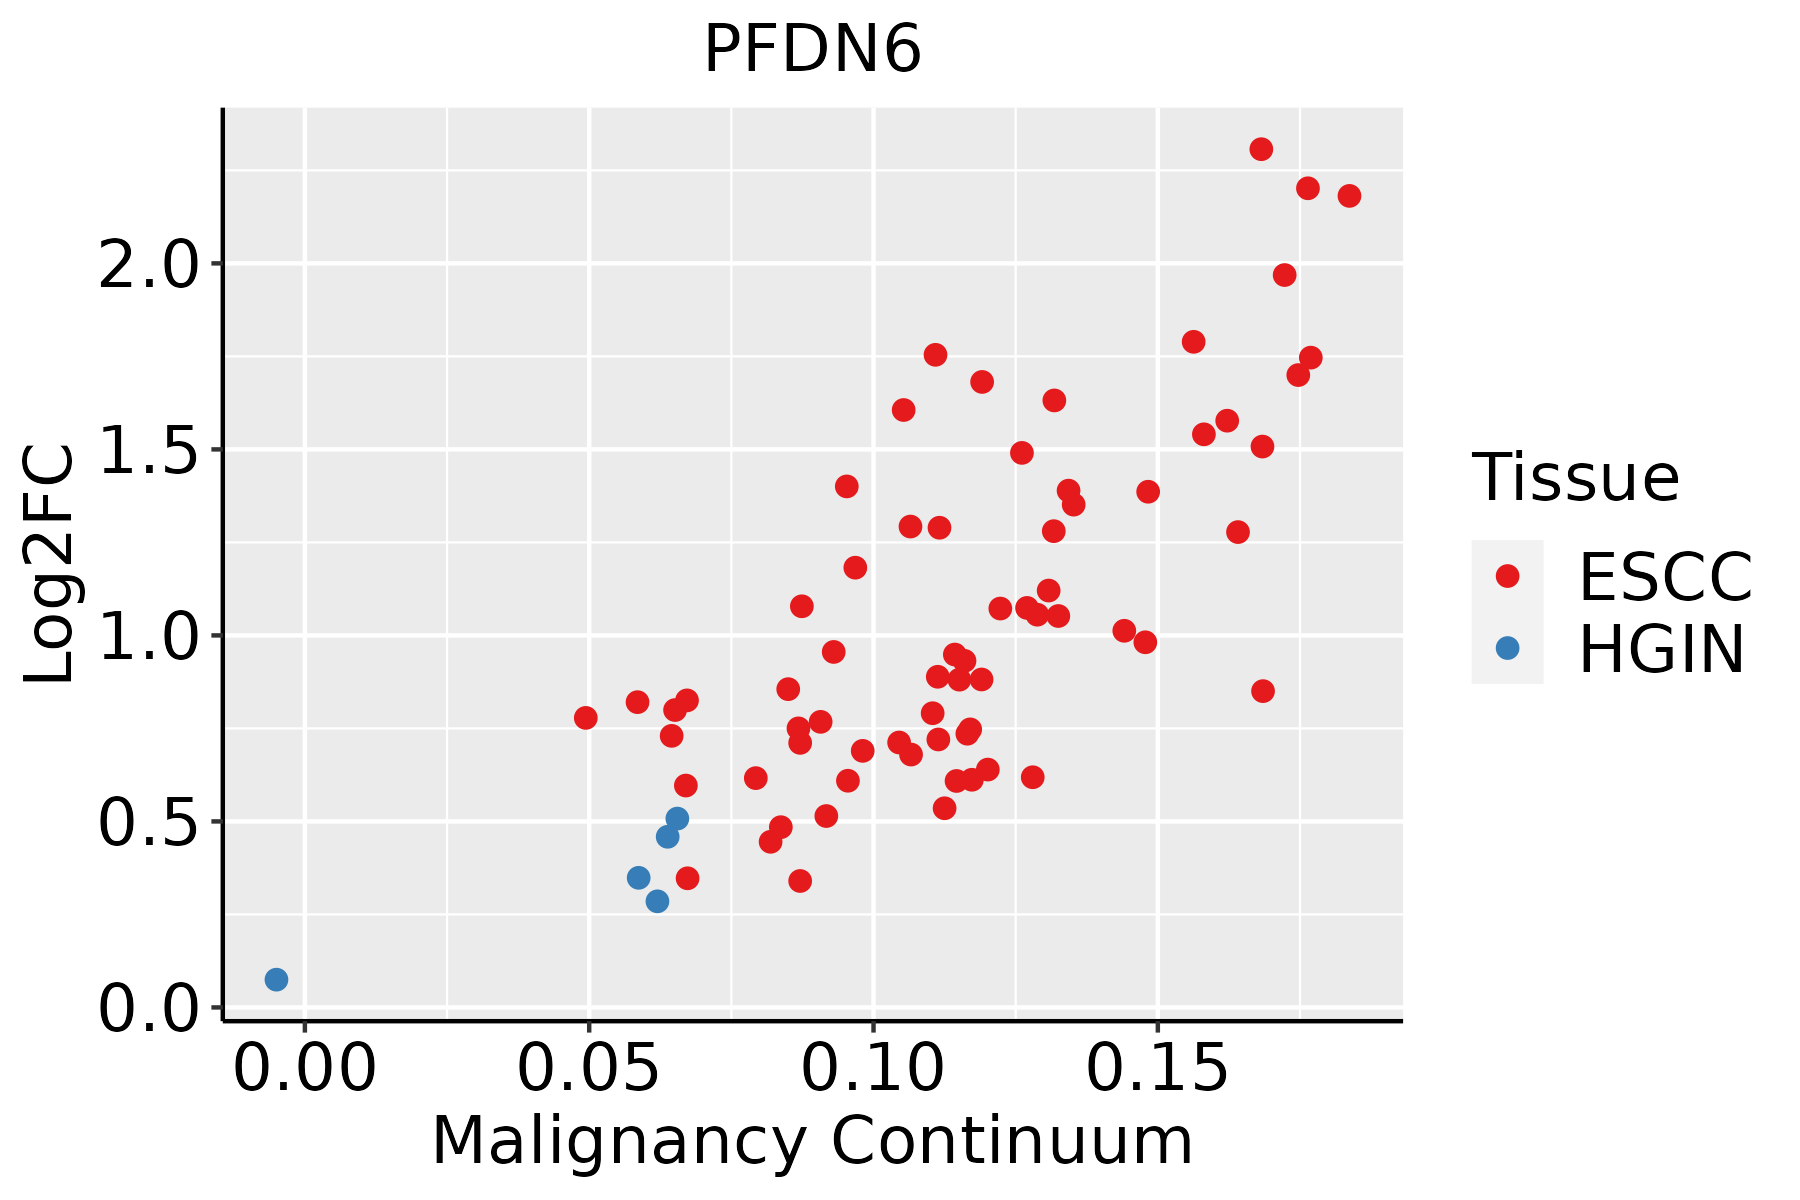 | ESCC: Esophageal squamous cell carcinoma |
| HGIN: High-grade intraepithelial neoplasias | ||
| LGIN: Low-grade intraepithelial neoplasias | ||
| Liver | 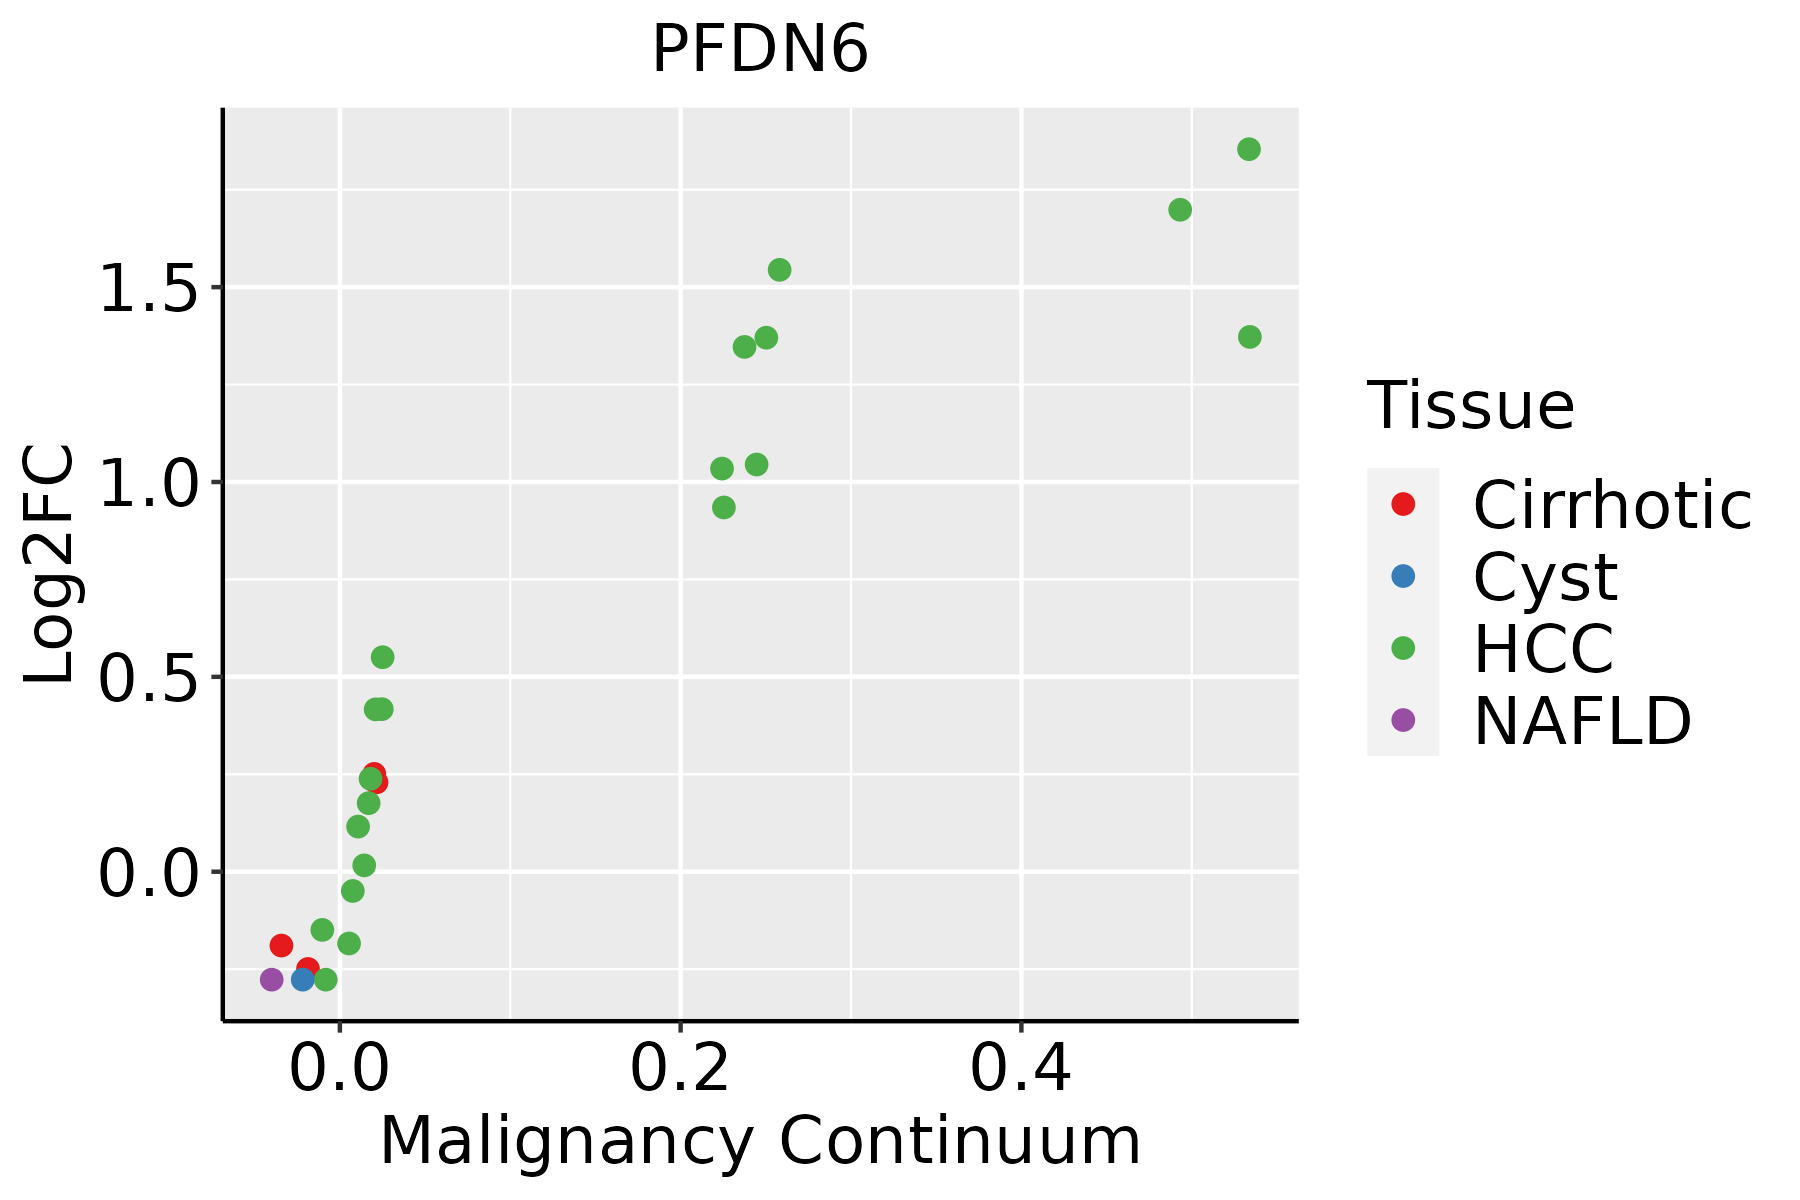 | HCC: Hepatocellular carcinoma |
| NAFLD: Non-alcoholic fatty liver disease | ||
| Oral Cavity | 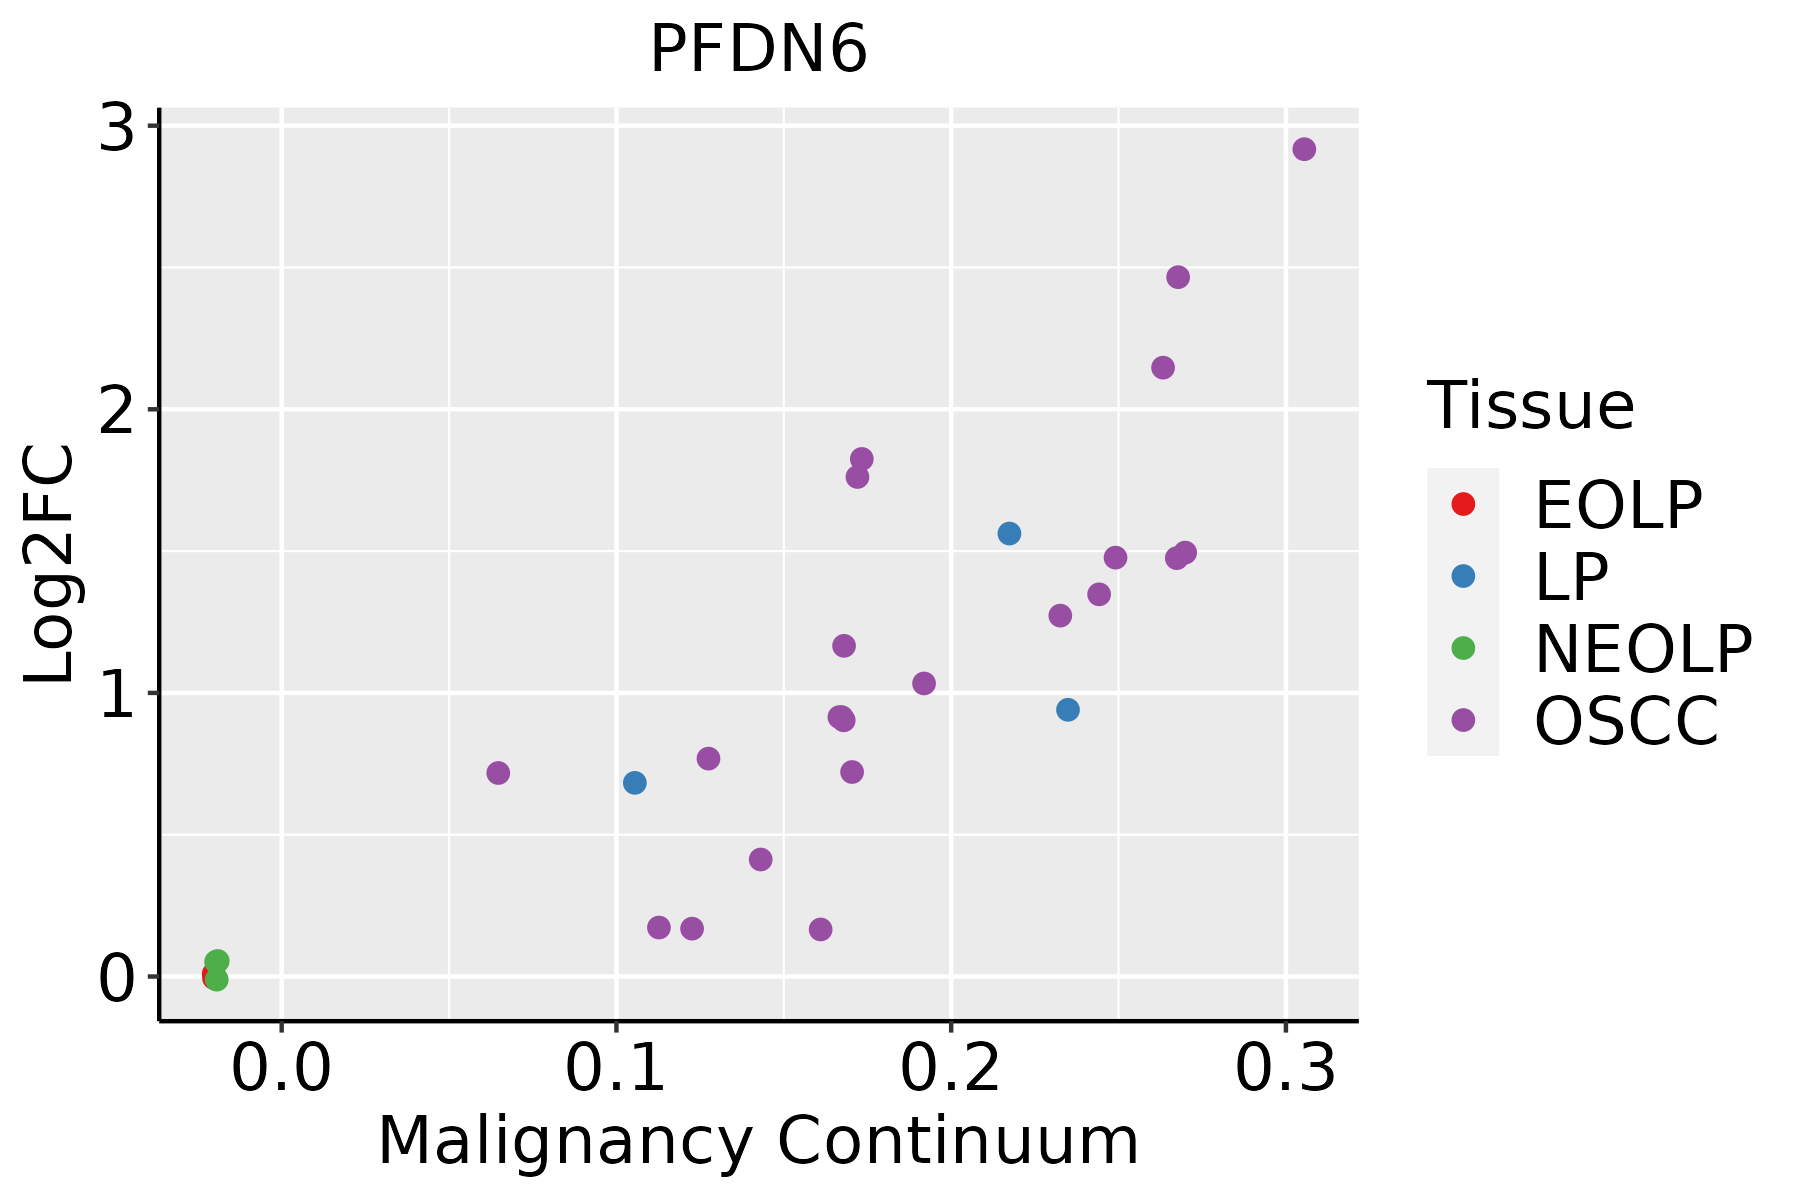 | EOLP: Erosive Oral lichen planus |
| LP: leukoplakia | ||
| NEOLP: Non-erosive oral lichen planus | ||
| OSCC: Oral squamous cell carcinoma | ||
| Prostate | 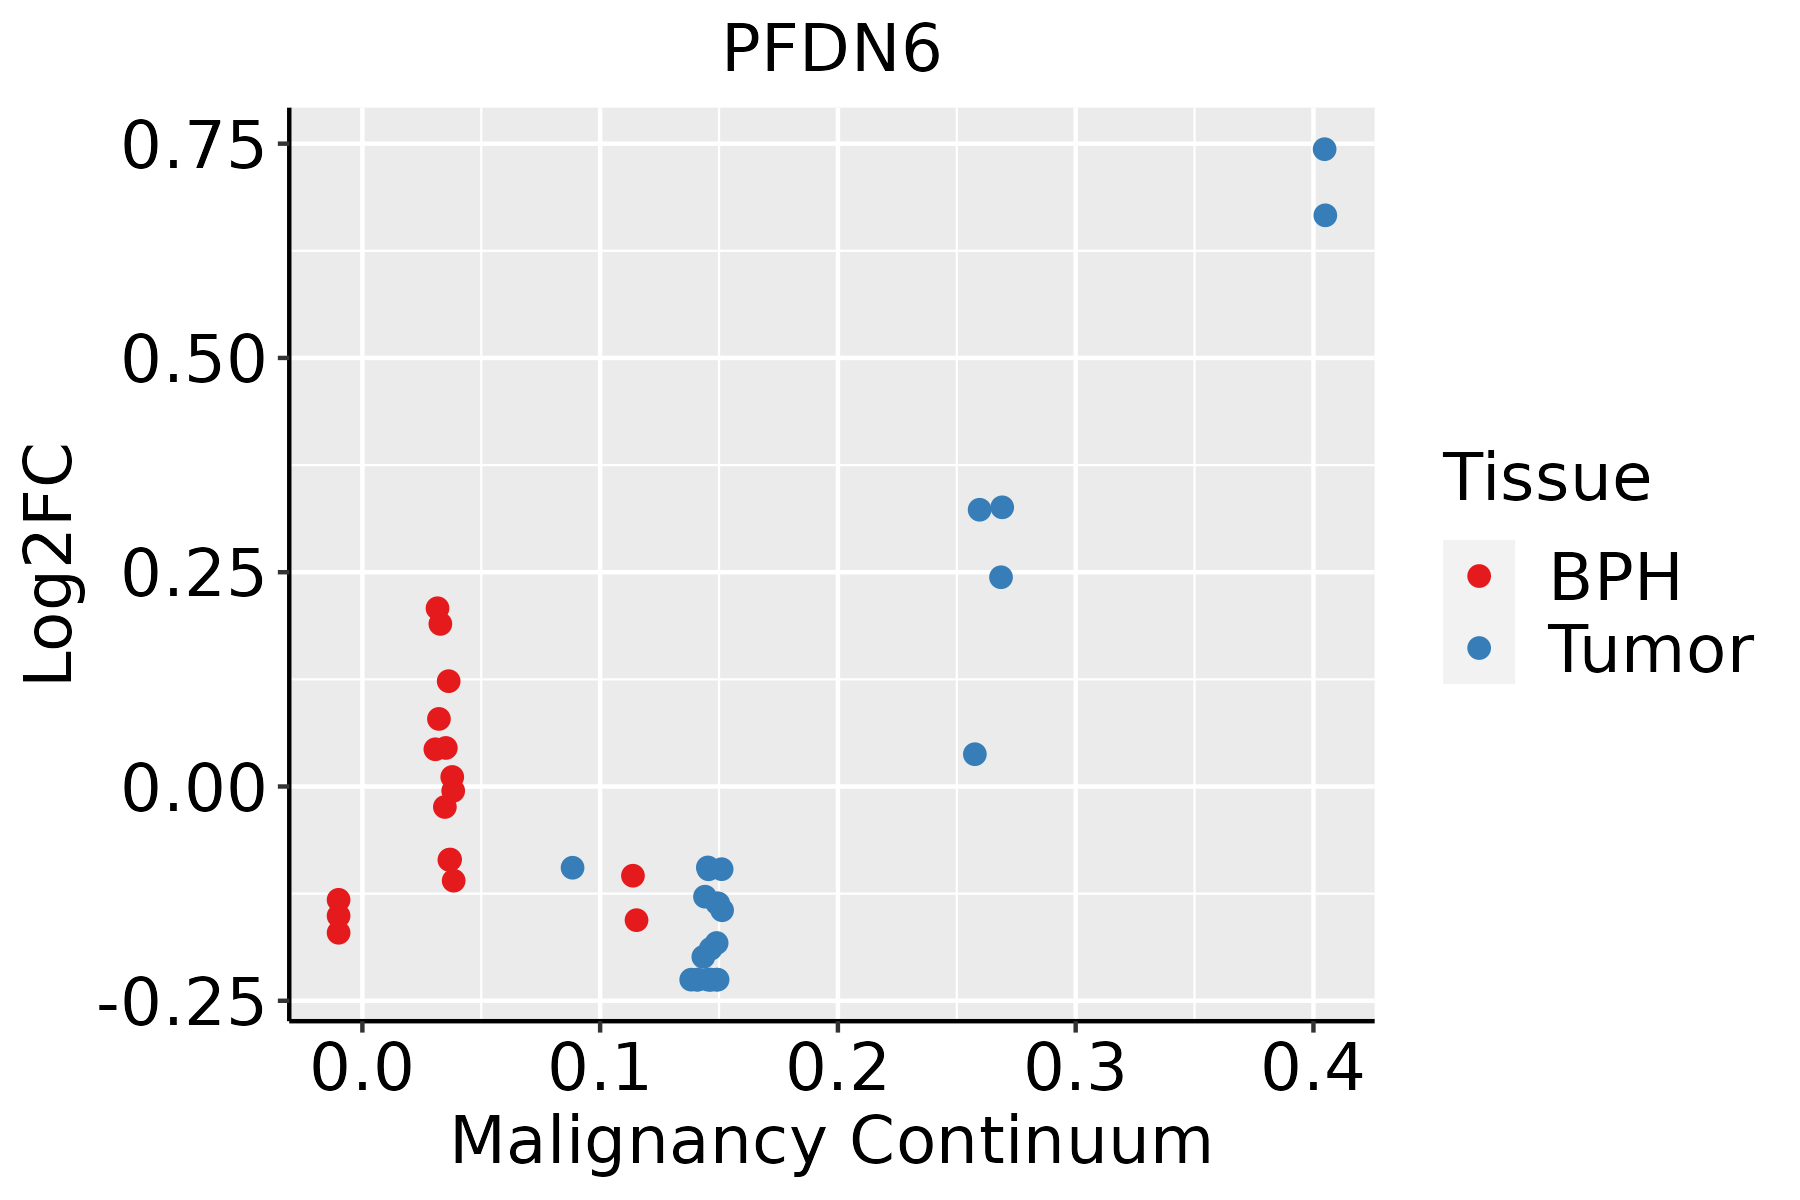 | BPH: Benign Prostatic Hyperplasia |
| Skin |  | AK: Actinic keratosis |
| cSCC: Cutaneous squamous cell carcinoma | ||
| SCCIS:squamous cell carcinoma in situ | ||
| Thyroid |  | ATC: Anaplastic thyroid cancer |
| HT: Hashimoto's thyroiditis | ||
| PTC: Papillary thyroid cancer |
| ∗log2FC in expression of this searched gene in stem-like cells from each diseased tissue sample relative to stem-like cells in normal samples in each tissue plotted against the malignancy continuum. Samples are colored based on if they are from different disease stage. |
Top |
Malignant transformation related pathway analysis |
| Find out the enriched GO biological processes and KEGG pathways involved in transition from healthy to precancer to cancer |
| Tissue | Disease Stage | Enriched GO biological Processes |
| Colorectum | AD |  |
| Colorectum | SER |  |
| Colorectum | MSS |  |
| Colorectum | MSI-H |  |
| Colorectum | FAP |  |
| ∗Top 15 enriched GO BP terms are showed in the bar plot of each disease state in each tissue. Each row represents a significant GO biological process which is colored according to the -log10(p.adjust). |
| Page: 1 2 3 4 5 6 7 8 9 |
| GO ID | Tissue | Disease Stage | Description | Gene Ratio | Bg Ratio | pvalue | p.adjust | Count |
| GO:1902903 | Colorectum | AD | regulation of supramolecular fiber organization | 139/3918 | 383/18723 | 2.01e-12 | 3.19e-10 | 139 |
| GO:0006457 | Colorectum | AD | protein folding | 73/3918 | 212/18723 | 3.24e-06 | 9.10e-05 | 73 |
| GO:1902904 | Colorectum | AD | negative regulation of supramolecular fiber organization | 60/3918 | 167/18723 | 5.23e-06 | 1.35e-04 | 60 |
| GO:1990000 | Colorectum | AD | amyloid fibril formation | 15/3918 | 34/18723 | 1.96e-03 | 1.58e-02 | 15 |
| GO:19029031 | Colorectum | SER | regulation of supramolecular fiber organization | 114/2897 | 383/18723 | 7.32e-13 | 1.95e-10 | 114 |
| GO:19029041 | Colorectum | SER | negative regulation of supramolecular fiber organization | 50/2897 | 167/18723 | 1.63e-06 | 7.23e-05 | 50 |
| GO:00064571 | Colorectum | SER | protein folding | 54/2897 | 212/18723 | 1.04e-04 | 2.18e-03 | 54 |
| GO:19900001 | Colorectum | SER | amyloid fibril formation | 13/2897 | 34/18723 | 1.06e-03 | 1.23e-02 | 13 |
| GO:19029032 | Colorectum | MSS | regulation of supramolecular fiber organization | 121/3467 | 383/18723 | 3.63e-10 | 3.28e-08 | 121 |
| GO:00064572 | Colorectum | MSS | protein folding | 71/3467 | 212/18723 | 1.25e-07 | 5.91e-06 | 71 |
| GO:19029042 | Colorectum | MSS | negative regulation of supramolecular fiber organization | 49/3467 | 167/18723 | 4.30e-04 | 5.23e-03 | 49 |
| GO:19900002 | Colorectum | MSS | amyloid fibril formation | 15/3467 | 34/18723 | 5.22e-04 | 5.99e-03 | 15 |
| GO:000645720 | Esophagus | HGIN | protein folding | 75/2587 | 212/18723 | 1.61e-15 | 3.86e-13 | 75 |
| GO:190290327 | Esophagus | HGIN | regulation of supramolecular fiber organization | 79/2587 | 383/18723 | 1.40e-04 | 2.81e-03 | 79 |
| GO:199000010 | Esophagus | HGIN | amyloid fibril formation | 13/2587 | 34/18723 | 3.51e-04 | 5.65e-03 | 13 |
| GO:005113118 | Esophagus | HGIN | chaperone-mediated protein complex assembly | 10/2587 | 23/18723 | 5.09e-04 | 7.38e-03 | 10 |
| GO:19059068 | Esophagus | HGIN | regulation of amyloid fibril formation | 8/2587 | 16/18723 | 6.00e-04 | 8.41e-03 | 8 |
| GO:19059078 | Esophagus | HGIN | negative regulation of amyloid fibril formation | 6/2587 | 13/18723 | 4.97e-03 | 4.18e-02 | 6 |
| GO:0006457110 | Esophagus | ESCC | protein folding | 163/8552 | 212/18723 | 1.13e-20 | 1.74e-18 | 163 |
| GO:1902903111 | Esophagus | ESCC | regulation of supramolecular fiber organization | 237/8552 | 383/18723 | 9.06e-11 | 2.75e-09 | 237 |
| Page: 1 2 3 4 5 |
| Pathway ID | Tissue | Disease Stage | Description | Gene Ratio | Bg Ratio | pvalue | p.adjust | qvalue | Count |
| Page: 1 |
Top |
Cell-cell communication analysis |
| Identification of potential cell-cell interactions between two cell types and their ligand-receptor pairs for different disease states |
| Ligand | Receptor | LRpair | Pathway | Tissue | Disease Stage |
| Page: 1 |
Top |
Single-cell gene regulatory network inference analysis |
| Find out the significant the regulons (TFs) and the target genes of each regulon across cell types for different disease states |
| TF | Cell Type | Tissue | Disease Stage | Target Gene | RSS | Regulon Activity |
| ∗The dot plots of a searched regulon are shown for all cell subpopulations in each disease state of each tissue based on the regulon specific score inferred using pySCENIC and by calculating the average expression. |
| Page: 1 |
Top |
Somatic mutation of malignant transformation related genes |
| Annotation of somatic variants for genes involved in malignant transformation |
| Hugo Symbol | Variant Class | Variant Classification | dbSNP RS | HGVSc | HGVSp | HGVSp Short | SWISSPROT | BIOTYPE | SIFT | PolyPhen | Tumor Sample Barcode | Tissue | Histology | Sex | Age | Stage | Therapy Types | Drugs | Outcome |
| PFDN6 | SNV | Missense_Mutation | c.160N>G | p.Asn54Asp | p.N54D | O15212 | protein_coding | tolerated(0.23) | benign(0.066) | TCGA-A8-A09V-01 | Breast | breast invasive carcinoma | Female | <65 | I/II | Hormone Therapy | tamoxiphen | SD | |
| PFDN6 | SNV | Missense_Mutation | c.286N>A | p.Asp96Asn | p.D96N | O15212 | protein_coding | tolerated(0.21) | possibly_damaging(0.562) | TCGA-C5-A1BK-01 | Cervix | cervical & endocervical cancer | Female | <65 | I/II | Unknown | Unknown | SD | |
| PFDN6 | SNV | Missense_Mutation | novel | c.256N>A | p.Glu86Lys | p.E86K | O15212 | protein_coding | deleterious(0) | probably_damaging(0.999) | TCGA-VS-A9UY-01 | Cervix | cervical & endocervical cancer | Female | <65 | I/II | Chemotherapy | cisplatin | PD |
| PFDN6 | SNV | Missense_Mutation | c.260N>G | p.Ile87Ser | p.I87S | O15212 | protein_coding | deleterious(0) | possibly_damaging(0.771) | TCGA-AA-3811-01 | Colorectum | colon adenocarcinoma | Female | >=65 | III/IV | Unknown | Unknown | PD | |
| PFDN6 | SNV | Missense_Mutation | c.202N>A | p.Glu68Lys | p.E68K | O15212 | protein_coding | deleterious(0.01) | possibly_damaging(0.568) | TCGA-CK-4951-01 | Colorectum | colon adenocarcinoma | Female | >=65 | I/II | Unknown | Unknown | PD | |
| PFDN6 | SNV | Missense_Mutation | novel | c.349N>T | p.Arg117Trp | p.R117W | O15212 | protein_coding | deleterious(0.02) | possibly_damaging(0.617) | TCGA-A5-A0G2-01 | Endometrium | uterine corpus endometrioid carcinoma | Female | <65 | III/IV | Unknown | Unknown | SD |
| PFDN6 | SNV | Missense_Mutation | rs763752325 | c.155G>A | p.Gly52Glu | p.G52E | O15212 | protein_coding | tolerated(1) | benign(0) | TCGA-AJ-A2QO-01 | Endometrium | uterine corpus endometrioid carcinoma | Female | >=65 | I/II | Unknown | Unknown | SD |
| PFDN6 | SNV | Missense_Mutation | novel | c.312N>T | p.Gln104His | p.Q104H | O15212 | protein_coding | tolerated(1) | benign(0.006) | TCGA-CV-A45P-01 | Oral cavity | head & neck squamous cell carcinoma | Female | >=65 | I/II | Unknown | Unknown | PD |
| Page: 1 |
Top |
Related drugs of malignant transformation related genes |
| Identification of chemicals and drugs interact with genes involved in malignant transfromation |
| (DGIdb 4.0) |
| Entrez ID | Symbol | Category | Interaction Types | Drug Claim Name | Drug Name | PMIDs |
| Page: 1 |

Copyright 2023-Present -The University of Texas Health Science Center at Houston |