
|
|||||
|
 | |
| |
| |
| |
| |
| |
|
Gene: PFDN4 |
Gene summary for PFDN4 |
| Gene information | Species | Human | Gene symbol | PFDN4 | Gene ID | 5203 |
| Gene name | prefoldin subunit 4 | |
| Gene Alias | C1 | |
| Cytomap | 20q13.2 | |
| Gene Type | protein-coding | GO ID | GO:0006457 | UniProtAcc | Q9NQP4 |
Top |
Malignant transformation analysis |
| Identification of the aberrant gene expression in precancerous and cancerous lesions by comparing the gene expression of stem-like cells in diseased tissues with normal stem cells |
| Entrez ID | Symbol | Replicates | Species | Organ | Tissue | Adj P-value | Log2FC | Malignancy |
| 5203 | PFDN4 | GSM4909286 | Human | Breast | IDC | 1.43e-03 | -9.72e-03 | 0.1081 |
| 5203 | PFDN4 | GSM4909290 | Human | Breast | IDC | 4.26e-02 | -2.51e-01 | 0.2096 |
| 5203 | PFDN4 | GSM4909293 | Human | Breast | IDC | 2.43e-02 | -2.04e-01 | 0.1581 |
| 5203 | PFDN4 | GSM4909294 | Human | Breast | IDC | 1.29e-05 | -2.56e-01 | 0.2022 |
| 5203 | PFDN4 | GSM4909296 | Human | Breast | IDC | 1.74e-13 | -2.83e-01 | 0.1524 |
| 5203 | PFDN4 | GSM4909297 | Human | Breast | IDC | 5.95e-14 | -1.06e-01 | 0.1517 |
| 5203 | PFDN4 | GSM4909301 | Human | Breast | IDC | 1.01e-06 | 3.21e-01 | 0.1577 |
| 5203 | PFDN4 | GSM4909302 | Human | Breast | IDC | 7.34e-11 | -3.65e-01 | 0.1545 |
| 5203 | PFDN4 | GSM4909311 | Human | Breast | IDC | 7.94e-30 | -3.50e-01 | 0.1534 |
| 5203 | PFDN4 | GSM4909312 | Human | Breast | IDC | 1.14e-08 | -1.43e-01 | 0.1552 |
| 5203 | PFDN4 | GSM4909313 | Human | Breast | IDC | 6.62e-04 | -2.21e-01 | 0.0391 |
| 5203 | PFDN4 | GSM4909317 | Human | Breast | IDC | 8.35e-03 | 3.68e-01 | 0.1355 |
| 5203 | PFDN4 | GSM4909318 | Human | Breast | IDC | 8.10e-22 | 9.27e-01 | 0.2031 |
| 5203 | PFDN4 | GSM4909319 | Human | Breast | IDC | 4.91e-33 | -3.98e-01 | 0.1563 |
| 5203 | PFDN4 | GSM4909320 | Human | Breast | IDC | 5.24e-10 | 1.70e-03 | 0.1575 |
| 5203 | PFDN4 | GSM4909321 | Human | Breast | IDC | 2.69e-15 | -2.12e-01 | 0.1559 |
| 5203 | PFDN4 | brca10 | Human | Breast | Precancer | 8.80e-07 | -3.26e-01 | -0.0029 |
| 5203 | PFDN4 | NCCBC11 | Human | Breast | DCIS | 2.04e-04 | -4.39e-01 | 0.1232 |
| 5203 | PFDN4 | NCCBC14 | Human | Breast | DCIS | 7.49e-09 | -1.34e-01 | 0.2021 |
| 5203 | PFDN4 | NCCBC2 | Human | Breast | DCIS | 1.14e-08 | 5.10e-01 | 0.1554 |
| Page: 1 2 3 4 5 6 7 8 9 |
| Tissue | Expression Dynamics | Abbreviation |
| Breast |  | IDC: Invasive ductal carcinoma |
| DCIS: Ductal carcinoma in situ | ||
| Precancer(BRCA1-mut): Precancerous lesion from BRCA1 mutation carriers | ||
| Endometrium |  | AEH: Atypical endometrial hyperplasia |
| EEC: Endometrioid Cancer | ||
| Esophagus | 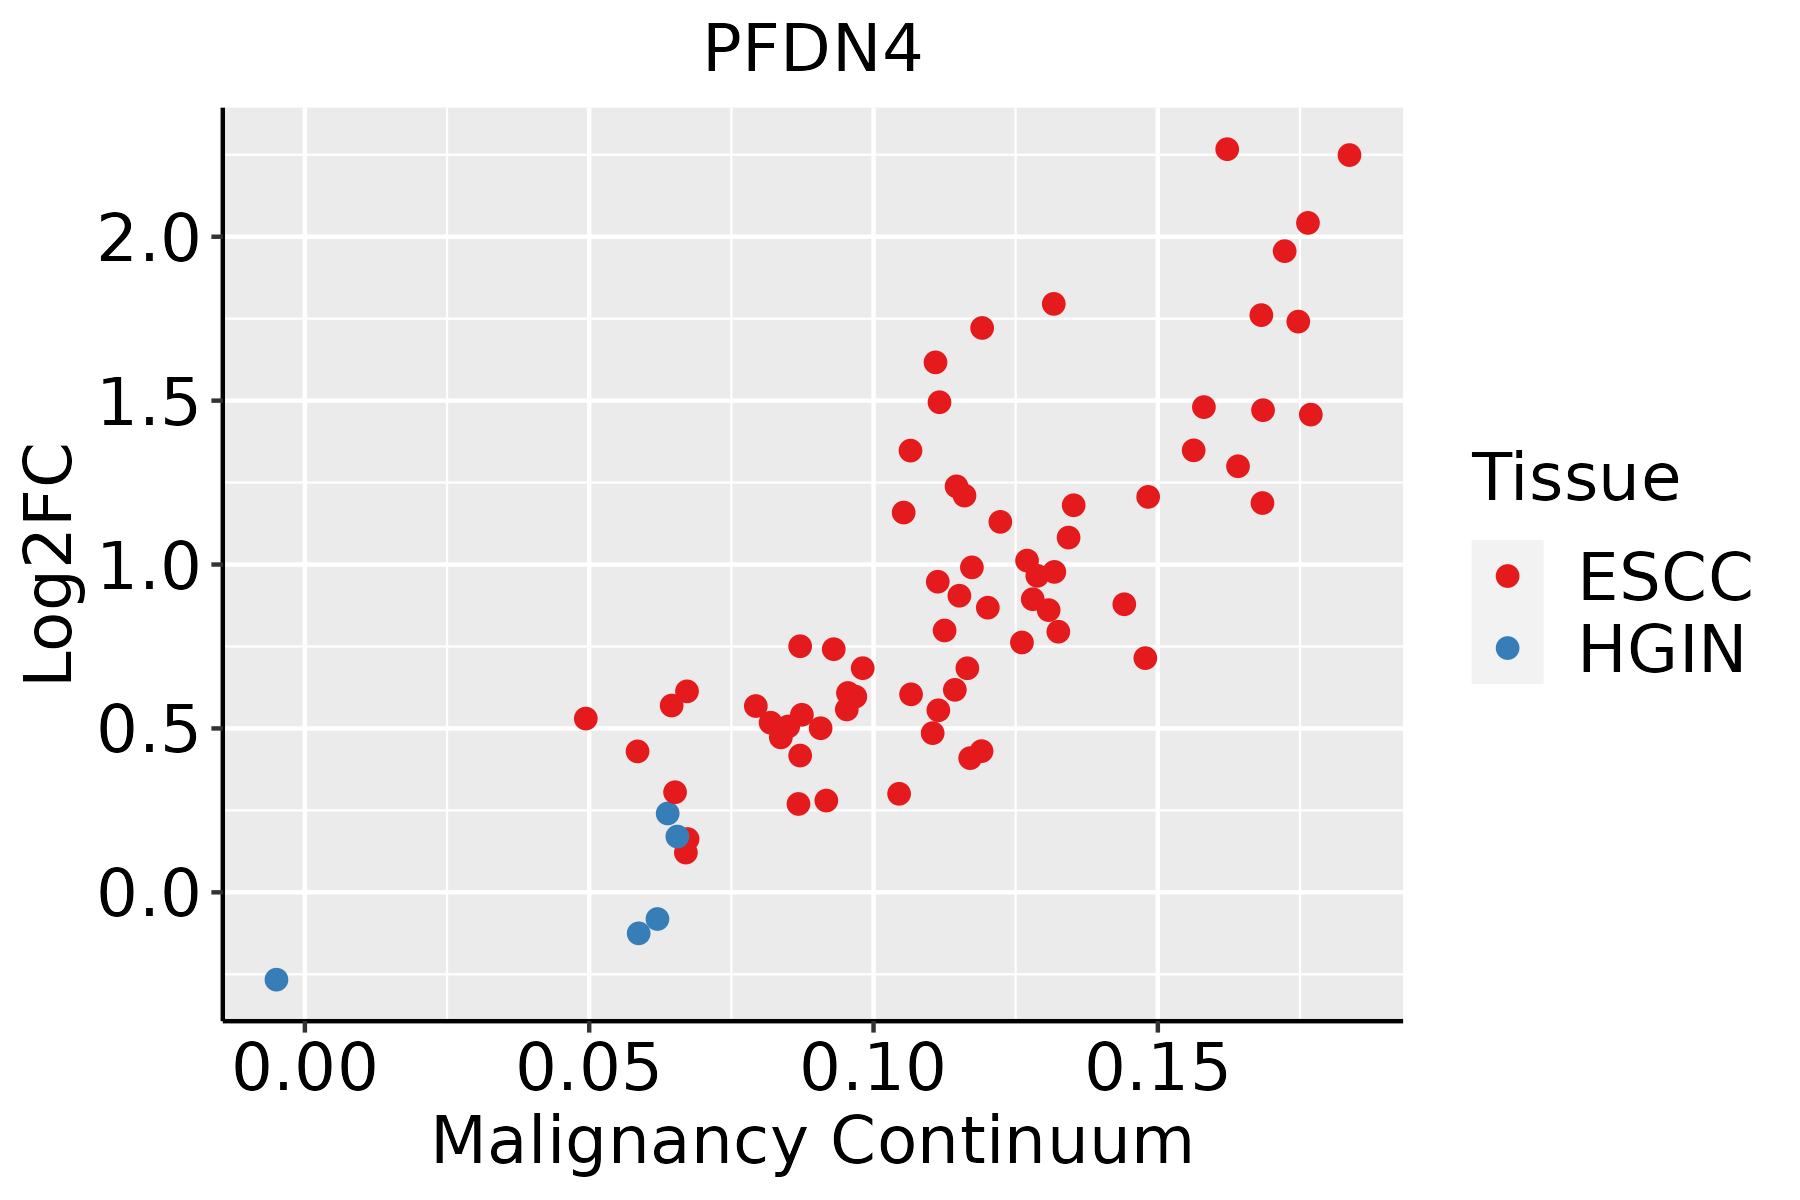 | ESCC: Esophageal squamous cell carcinoma |
| HGIN: High-grade intraepithelial neoplasias | ||
| LGIN: Low-grade intraepithelial neoplasias | ||
| Liver | 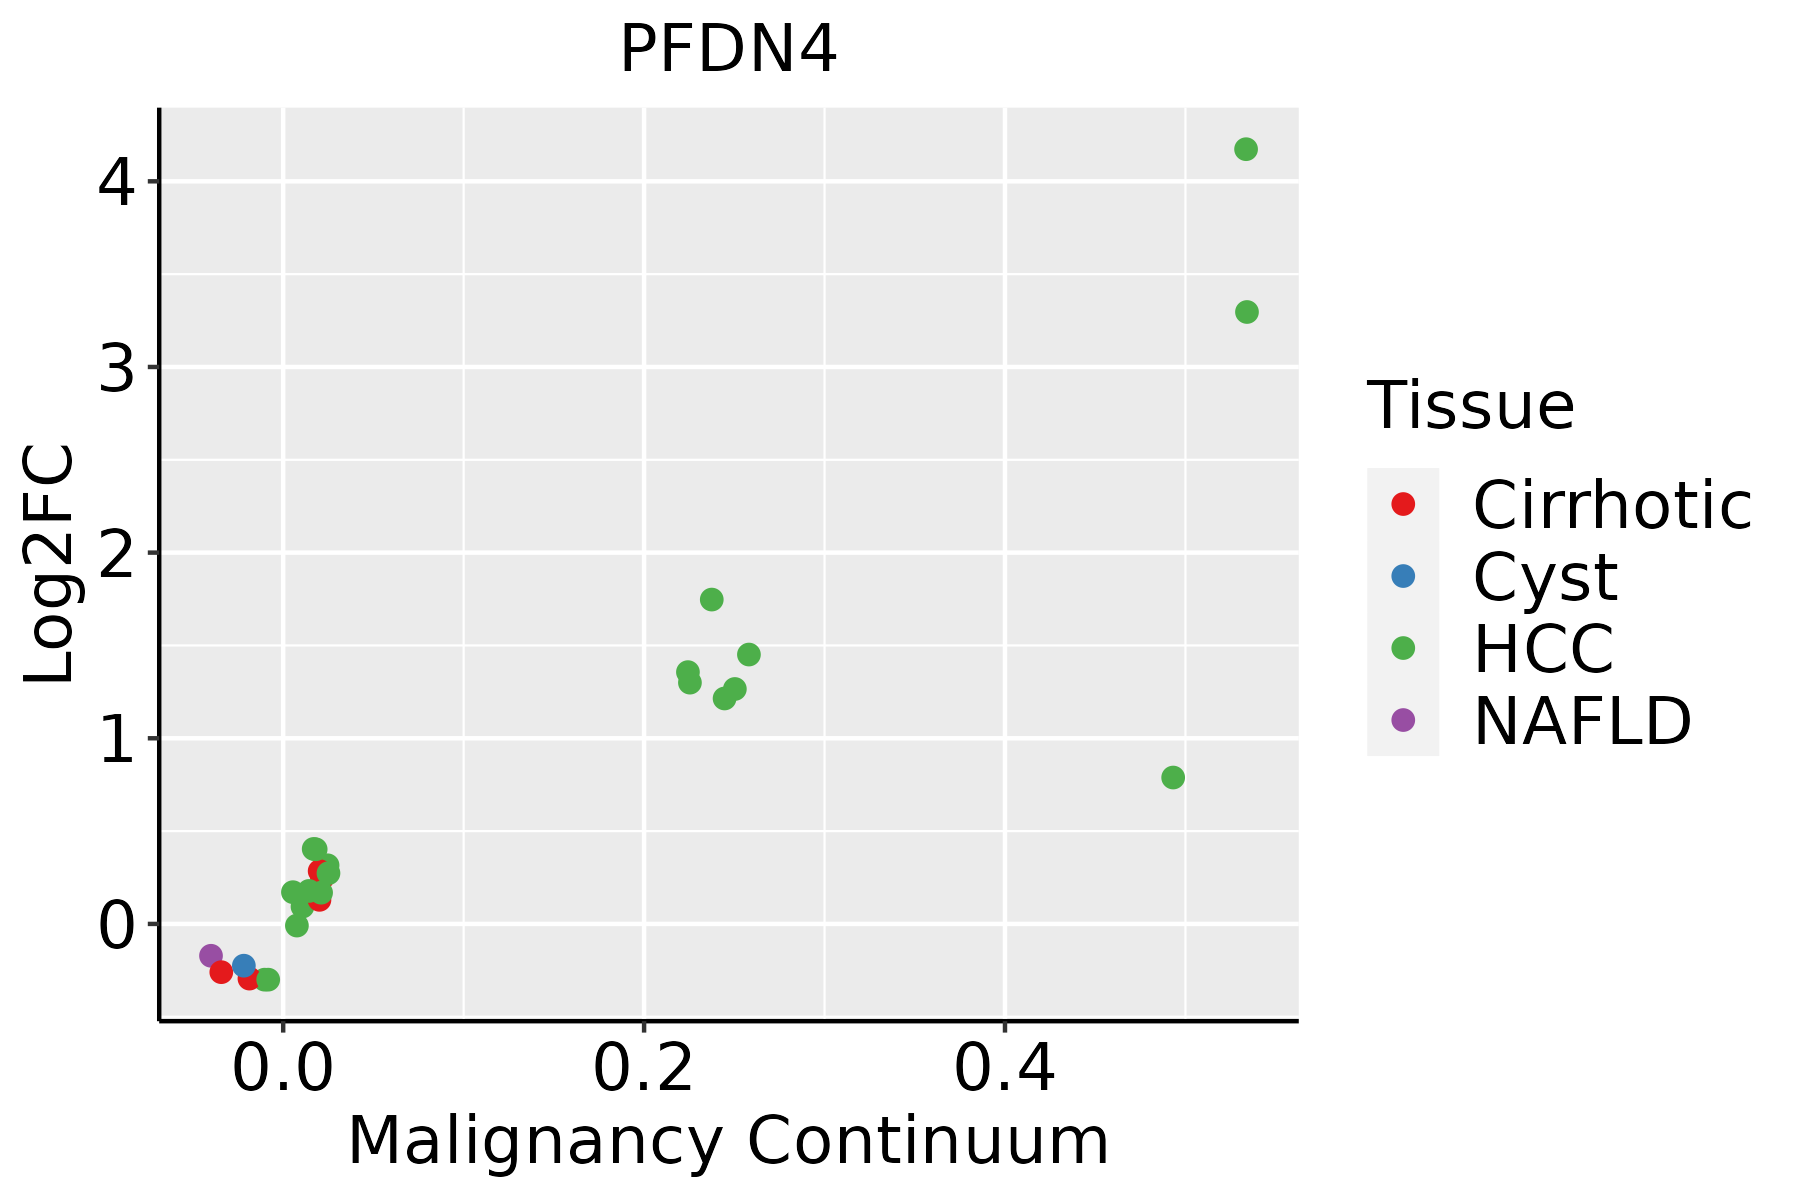 | HCC: Hepatocellular carcinoma |
| NAFLD: Non-alcoholic fatty liver disease | ||
| Oral Cavity | 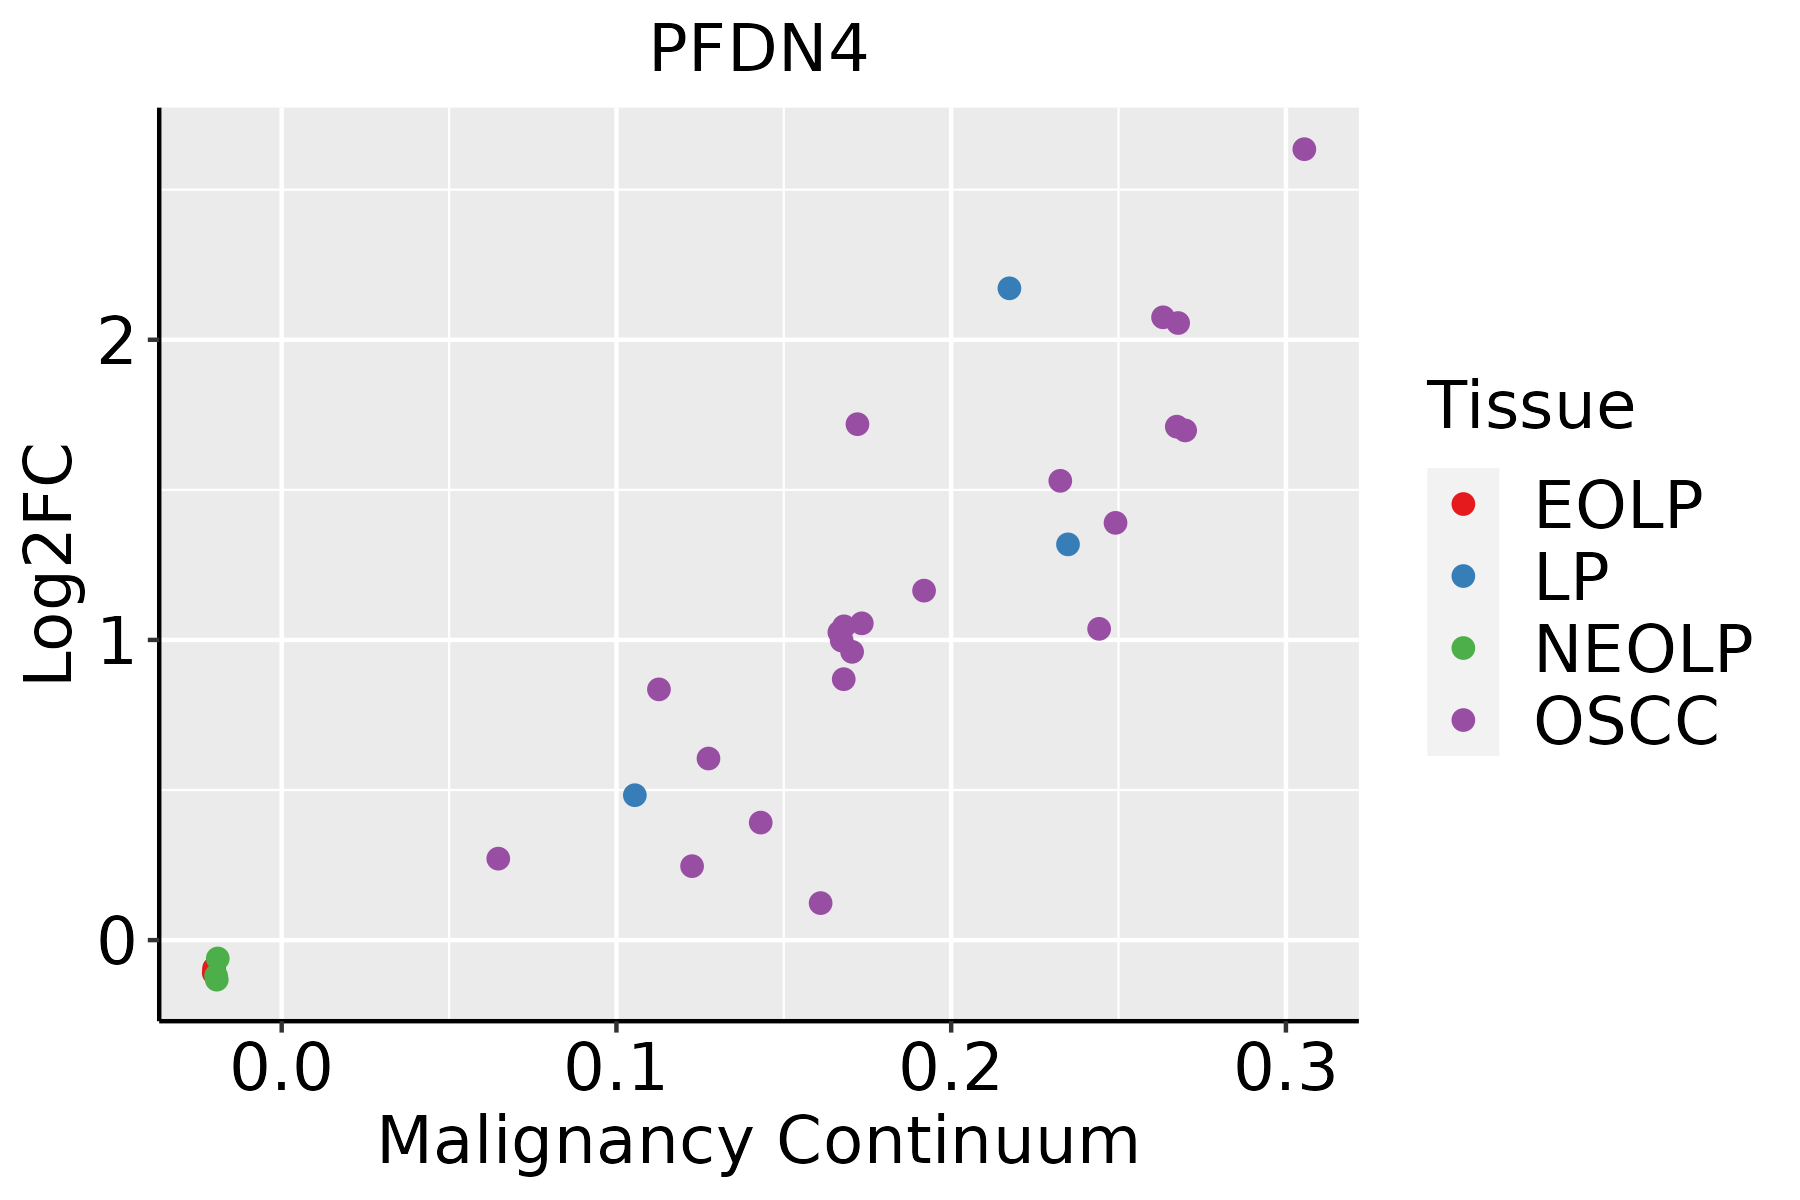 | EOLP: Erosive Oral lichen planus |
| LP: leukoplakia | ||
| NEOLP: Non-erosive oral lichen planus | ||
| OSCC: Oral squamous cell carcinoma | ||
| Skin |  | AK: Actinic keratosis |
| cSCC: Cutaneous squamous cell carcinoma | ||
| SCCIS:squamous cell carcinoma in situ | ||
| Thyroid | 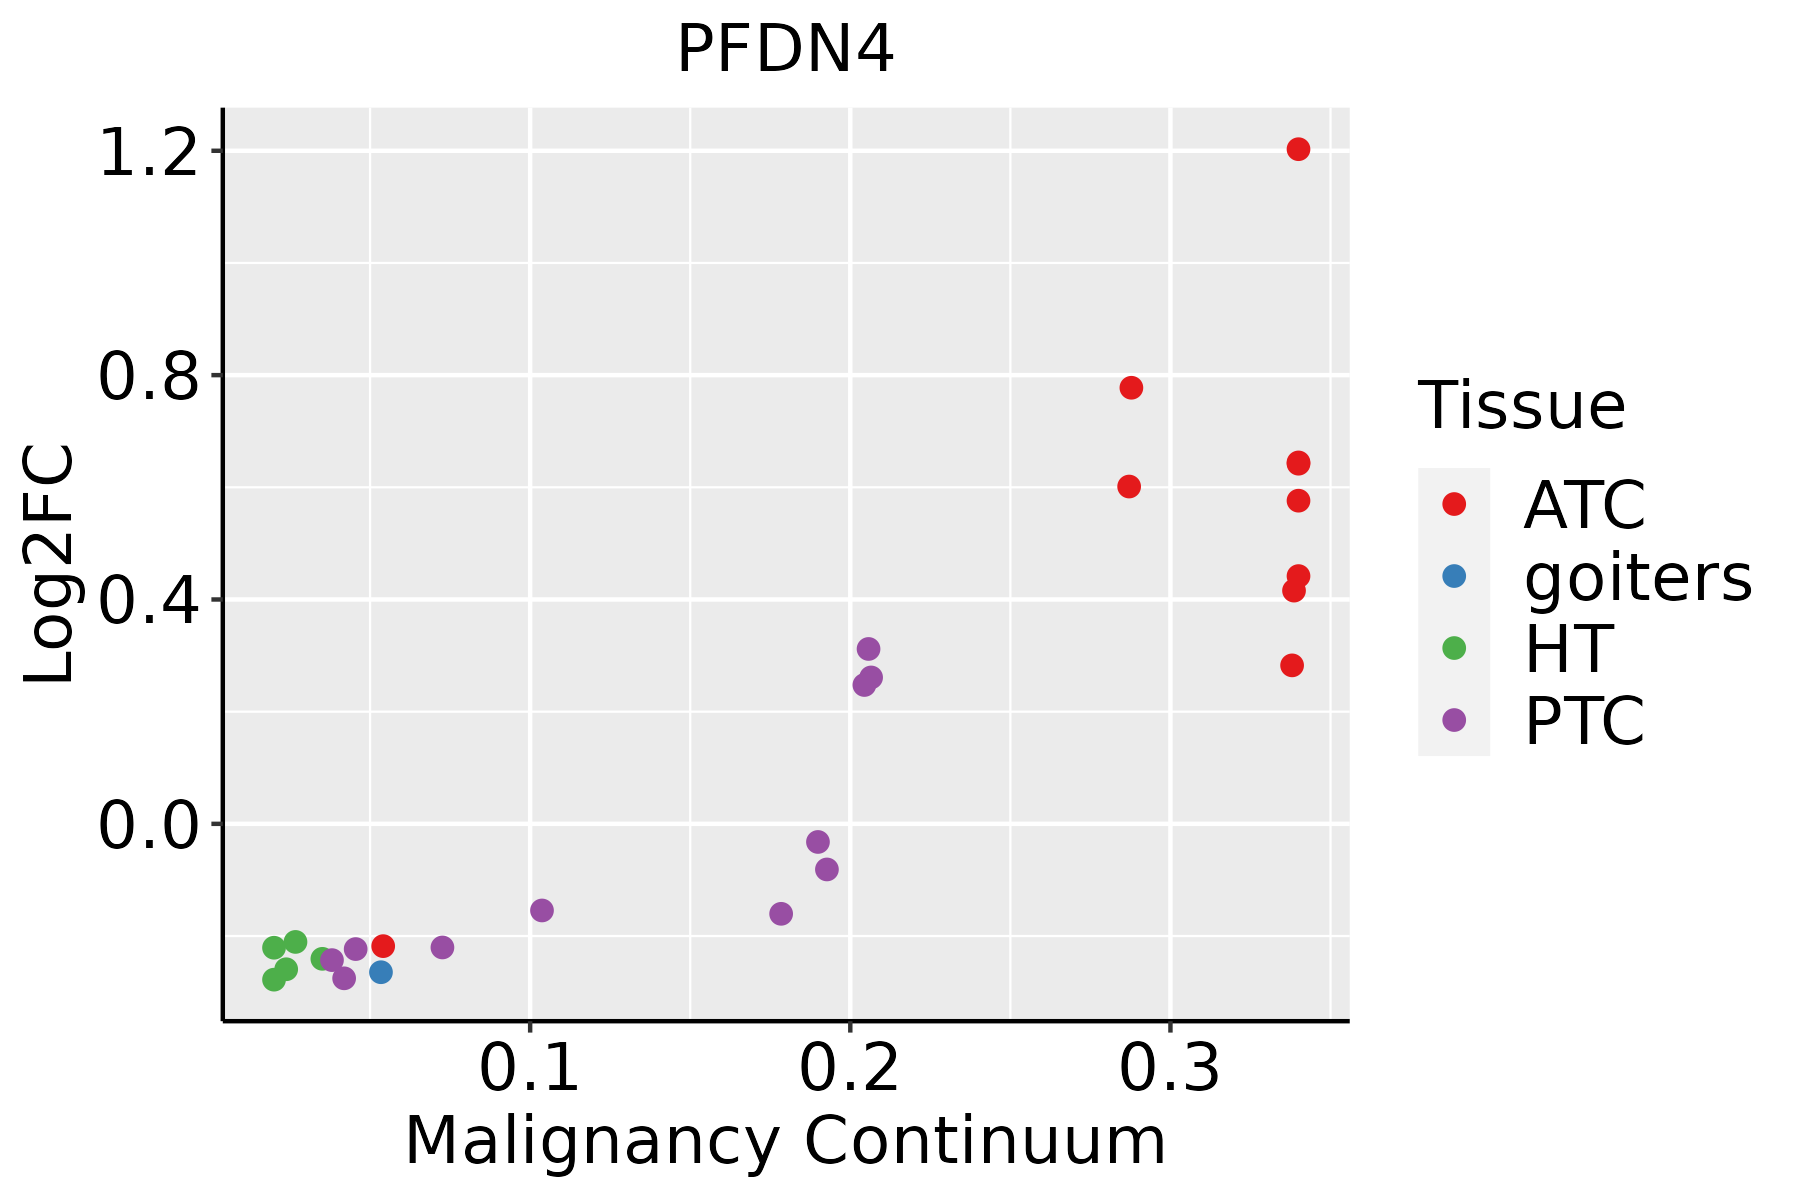 | ATC: Anaplastic thyroid cancer |
| HT: Hashimoto's thyroiditis | ||
| PTC: Papillary thyroid cancer |
| ∗log2FC in expression of this searched gene in stem-like cells from each diseased tissue sample relative to stem-like cells in normal samples in each tissue plotted against the malignancy continuum. Samples are colored based on if they are from different disease stage. |
Top |
Malignant transformation related pathway analysis |
| Find out the enriched GO biological processes and KEGG pathways involved in transition from healthy to precancer to cancer |
| Tissue | Disease Stage | Enriched GO biological Processes |
| Colorectum | AD |  |
| Colorectum | SER |  |
| Colorectum | MSS |  |
| Colorectum | MSI-H |  |
| Colorectum | FAP |  |
| ∗Top 15 enriched GO BP terms are showed in the bar plot of each disease state in each tissue. Each row represents a significant GO biological process which is colored according to the -log10(p.adjust). |
| Page: 1 2 3 4 5 6 7 8 9 |
| GO ID | Tissue | Disease Stage | Description | Gene Ratio | Bg Ratio | pvalue | p.adjust | Count |
| GO:00064578 | Breast | Precancer | protein folding | 43/1080 | 212/18723 | 3.48e-13 | 7.45e-11 | 43 |
| GO:19029039 | Breast | Precancer | regulation of supramolecular fiber organization | 42/1080 | 383/18723 | 4.92e-05 | 1.04e-03 | 42 |
| GO:19900005 | Breast | Precancer | amyloid fibril formation | 9/1080 | 34/18723 | 9.66e-05 | 1.80e-03 | 9 |
| GO:19059063 | Breast | Precancer | regulation of amyloid fibril formation | 5/1080 | 16/18723 | 1.62e-03 | 1.64e-02 | 5 |
| GO:19059073 | Breast | Precancer | negative regulation of amyloid fibril formation | 4/1080 | 13/18723 | 5.17e-03 | 3.86e-02 | 4 |
| GO:000645713 | Breast | IDC | protein folding | 47/1434 | 212/18723 | 2.31e-11 | 3.86e-09 | 47 |
| GO:199000012 | Breast | IDC | amyloid fibril formation | 12/1434 | 34/18723 | 4.35e-06 | 1.53e-04 | 12 |
| GO:190290314 | Breast | IDC | regulation of supramolecular fiber organization | 54/1434 | 383/18723 | 9.40e-06 | 2.66e-04 | 54 |
| GO:190590611 | Breast | IDC | regulation of amyloid fibril formation | 7/1434 | 16/18723 | 9.40e-05 | 1.81e-03 | 7 |
| GO:190590711 | Breast | IDC | negative regulation of amyloid fibril formation | 6/1434 | 13/18723 | 2.14e-04 | 3.45e-03 | 6 |
| GO:000645723 | Breast | DCIS | protein folding | 47/1390 | 212/18723 | 7.84e-12 | 1.53e-09 | 47 |
| GO:199000021 | Breast | DCIS | amyloid fibril formation | 12/1390 | 34/18723 | 3.15e-06 | 1.02e-04 | 12 |
| GO:190290324 | Breast | DCIS | regulation of supramolecular fiber organization | 54/1390 | 383/18723 | 3.82e-06 | 1.16e-04 | 54 |
| GO:19059062 | Breast | DCIS | regulation of amyloid fibril formation | 7/1390 | 16/18723 | 7.70e-05 | 1.48e-03 | 7 |
| GO:19059072 | Breast | DCIS | negative regulation of amyloid fibril formation | 6/1390 | 13/18723 | 1.80e-04 | 2.96e-03 | 6 |
| GO:000645710 | Endometrium | AEH | protein folding | 61/2100 | 212/18723 | 1.86e-12 | 3.48e-10 | 61 |
| GO:190290316 | Endometrium | AEH | regulation of supramolecular fiber organization | 83/2100 | 383/18723 | 2.20e-09 | 1.78e-07 | 83 |
| GO:19029049 | Endometrium | AEH | negative regulation of supramolecular fiber organization | 39/2100 | 167/18723 | 6.07e-06 | 1.50e-04 | 39 |
| GO:19900007 | Endometrium | AEH | amyloid fibril formation | 12/2100 | 34/18723 | 1.97e-04 | 2.49e-03 | 12 |
| GO:19059075 | Endometrium | AEH | negative regulation of amyloid fibril formation | 6/2100 | 13/18723 | 1.68e-03 | 1.36e-02 | 6 |
| Page: 1 2 3 4 5 |
| Pathway ID | Tissue | Disease Stage | Description | Gene Ratio | Bg Ratio | pvalue | p.adjust | qvalue | Count |
| Page: 1 |
Top |
Cell-cell communication analysis |
| Identification of potential cell-cell interactions between two cell types and their ligand-receptor pairs for different disease states |
| Ligand | Receptor | LRpair | Pathway | Tissue | Disease Stage |
| Page: 1 |
Top |
Single-cell gene regulatory network inference analysis |
| Find out the significant the regulons (TFs) and the target genes of each regulon across cell types for different disease states |
| TF | Cell Type | Tissue | Disease Stage | Target Gene | RSS | Regulon Activity |
| ∗The dot plots of a searched regulon are shown for all cell subpopulations in each disease state of each tissue based on the regulon specific score inferred using pySCENIC and by calculating the average expression. |
| Page: 1 |
Top |
Somatic mutation of malignant transformation related genes |
| Annotation of somatic variants for genes involved in malignant transformation |
| Hugo Symbol | Variant Class | Variant Classification | dbSNP RS | HGVSc | HGVSp | HGVSp Short | SWISSPROT | BIOTYPE | SIFT | PolyPhen | Tumor Sample Barcode | Tissue | Histology | Sex | Age | Stage | Therapy Types | Drugs | Outcome |
| PFDN4 | SNV | Missense_Mutation | novel | c.370G>T | p.Gly124Trp | p.G124W | Q9NQP4 | protein_coding | deleterious(0.01) | probably_damaging(1) | TCGA-A7-A0DB-01 | Breast | breast invasive carcinoma | Female | <65 | I/II | Hormone Therapy | arimidex | SD |
| PFDN4 | SNV | Missense_Mutation | novel | c.63N>C | p.Gln21His | p.Q21H | Q9NQP4 | protein_coding | deleterious(0) | probably_damaging(0.954) | TCGA-AZ-4315-01 | Colorectum | colon adenocarcinoma | Male | <65 | I/II | Unknown | Unknown | SD |
| PFDN4 | SNV | Missense_Mutation | novel | c.277N>C | p.Asn93His | p.N93H | Q9NQP4 | protein_coding | tolerated(0.06) | possibly_damaging(0.468) | TCGA-AZ-4315-01 | Colorectum | colon adenocarcinoma | Male | <65 | I/II | Unknown | Unknown | SD |
| PFDN4 | SNV | Missense_Mutation | c.52N>A | p.Glu18Lys | p.E18K | Q9NQP4 | protein_coding | tolerated(0.06) | benign(0.062) | TCGA-CA-6717-01 | Colorectum | colon adenocarcinoma | Male | <65 | I/II | Chemotherapy | oxaliplatin | CR | |
| PFDN4 | SNV | Missense_Mutation | c.74N>C | p.Lys25Thr | p.K25T | Q9NQP4 | protein_coding | tolerated(0.07) | benign(0.015) | TCGA-CA-6718-01 | Colorectum | colon adenocarcinoma | Male | <65 | I/II | Unknown | Unknown | PD | |
| PFDN4 | SNV | Missense_Mutation | c.248N>T | p.Thr83Met | p.T83M | Q9NQP4 | protein_coding | deleterious(0.02) | benign(0.269) | TCGA-WS-AB45-01 | Colorectum | colon adenocarcinoma | Female | <65 | I/II | Unknown | Unknown | SD | |
| PFDN4 | SNV | Missense_Mutation | novel | c.106N>A | p.Leu36Met | p.L36M | Q9NQP4 | protein_coding | deleterious(0.01) | probably_damaging(0.946) | TCGA-A5-A0G2-01 | Endometrium | uterine corpus endometrioid carcinoma | Female | <65 | III/IV | Unknown | Unknown | SD |
| PFDN4 | SNV | Missense_Mutation | rs368220174 | c.298N>A | p.Ala100Thr | p.A100T | Q9NQP4 | protein_coding | tolerated(0.22) | benign(0.011) | TCGA-AP-A051-01 | Endometrium | uterine corpus endometrioid carcinoma | Female | >=65 | I/II | Unknown | Unknown | SD |
| PFDN4 | SNV | Missense_Mutation | novel | c.44N>C | p.Val15Ala | p.V15A | Q9NQP4 | protein_coding | deleterious(0.03) | possibly_damaging(0.619) | TCGA-AX-A2HJ-01 | Endometrium | uterine corpus endometrioid carcinoma | Female | <65 | I/II | Unknown | Unknown | SD |
| PFDN4 | SNV | Missense_Mutation | c.109A>G | p.Lys37Glu | p.K37E | Q9NQP4 | protein_coding | deleterious(0.02) | benign(0.336) | TCGA-B5-A0JY-01 | Endometrium | uterine corpus endometrioid carcinoma | Female | <65 | III/IV | Chemotherapy | doxorubicin | SD |
| Page: 1 2 |
Top |
Related drugs of malignant transformation related genes |
| Identification of chemicals and drugs interact with genes involved in malignant transfromation |
| (DGIdb 4.0) |
| Entrez ID | Symbol | Category | Interaction Types | Drug Claim Name | Drug Name | PMIDs |
| Page: 1 |

Copyright 2023-Present -The University of Texas Health Science Center at Houston |