
|
|||||
|
 | |
| |
| |
| |
| |
| |
|
Gene: PFDN1 |
Gene summary for PFDN1 |
| Gene information | Species | Human | Gene symbol | PFDN1 | Gene ID | 5201 |
| Gene name | prefoldin subunit 1 | |
| Gene Alias | ||
| Cytomap | 5q31.3 | |
| Gene Type | protein-coding | GO ID | GO:0006457 | UniProtAcc | O60925 |
Top |
Malignant transformation analysis |
| Identification of the aberrant gene expression in precancerous and cancerous lesions by comparing the gene expression of stem-like cells in diseased tissues with normal stem cells |
| Entrez ID | Symbol | Replicates | Species | Organ | Tissue | Adj P-value | Log2FC | Malignancy |
| 5201 | PFDN1 | LZE2T | Human | Esophagus | ESCC | 1.93e-06 | 4.94e-01 | 0.082 |
| 5201 | PFDN1 | LZE4T | Human | Esophagus | ESCC | 2.22e-12 | 2.83e-01 | 0.0811 |
| 5201 | PFDN1 | LZE5T | Human | Esophagus | ESCC | 9.54e-03 | 5.79e-01 | 0.0514 |
| 5201 | PFDN1 | LZE7T | Human | Esophagus | ESCC | 6.75e-10 | 5.28e-01 | 0.0667 |
| 5201 | PFDN1 | LZE8T | Human | Esophagus | ESCC | 9.24e-07 | 1.89e-01 | 0.067 |
| 5201 | PFDN1 | LZE22T | Human | Esophagus | ESCC | 7.88e-09 | 6.20e-01 | 0.068 |
| 5201 | PFDN1 | LZE24T | Human | Esophagus | ESCC | 1.66e-21 | 5.41e-01 | 0.0596 |
| 5201 | PFDN1 | LZE21T | Human | Esophagus | ESCC | 3.69e-02 | 2.71e-01 | 0.0655 |
| 5201 | PFDN1 | LZE6T | Human | Esophagus | ESCC | 7.33e-14 | 5.50e-01 | 0.0845 |
| 5201 | PFDN1 | P1T-E | Human | Esophagus | ESCC | 8.02e-09 | 4.70e-01 | 0.0875 |
| 5201 | PFDN1 | P2T-E | Human | Esophagus | ESCC | 2.83e-34 | 5.37e-01 | 0.1177 |
| 5201 | PFDN1 | P4T-E | Human | Esophagus | ESCC | 7.14e-26 | 5.38e-01 | 0.1323 |
| 5201 | PFDN1 | P5T-E | Human | Esophagus | ESCC | 2.19e-33 | 5.99e-01 | 0.1327 |
| 5201 | PFDN1 | P8T-E | Human | Esophagus | ESCC | 1.09e-29 | 5.68e-01 | 0.0889 |
| 5201 | PFDN1 | P9T-E | Human | Esophagus | ESCC | 1.27e-19 | 4.74e-01 | 0.1131 |
| 5201 | PFDN1 | P10T-E | Human | Esophagus | ESCC | 1.50e-32 | 4.73e-01 | 0.116 |
| 5201 | PFDN1 | P11T-E | Human | Esophagus | ESCC | 3.74e-26 | 9.97e-01 | 0.1426 |
| 5201 | PFDN1 | P12T-E | Human | Esophagus | ESCC | 1.16e-46 | 9.38e-01 | 0.1122 |
| 5201 | PFDN1 | P15T-E | Human | Esophagus | ESCC | 1.78e-28 | 6.17e-01 | 0.1149 |
| 5201 | PFDN1 | P16T-E | Human | Esophagus | ESCC | 9.82e-24 | 3.44e-01 | 0.1153 |
| Page: 1 2 3 4 5 6 7 |
| Tissue | Expression Dynamics | Abbreviation |
| Esophagus | 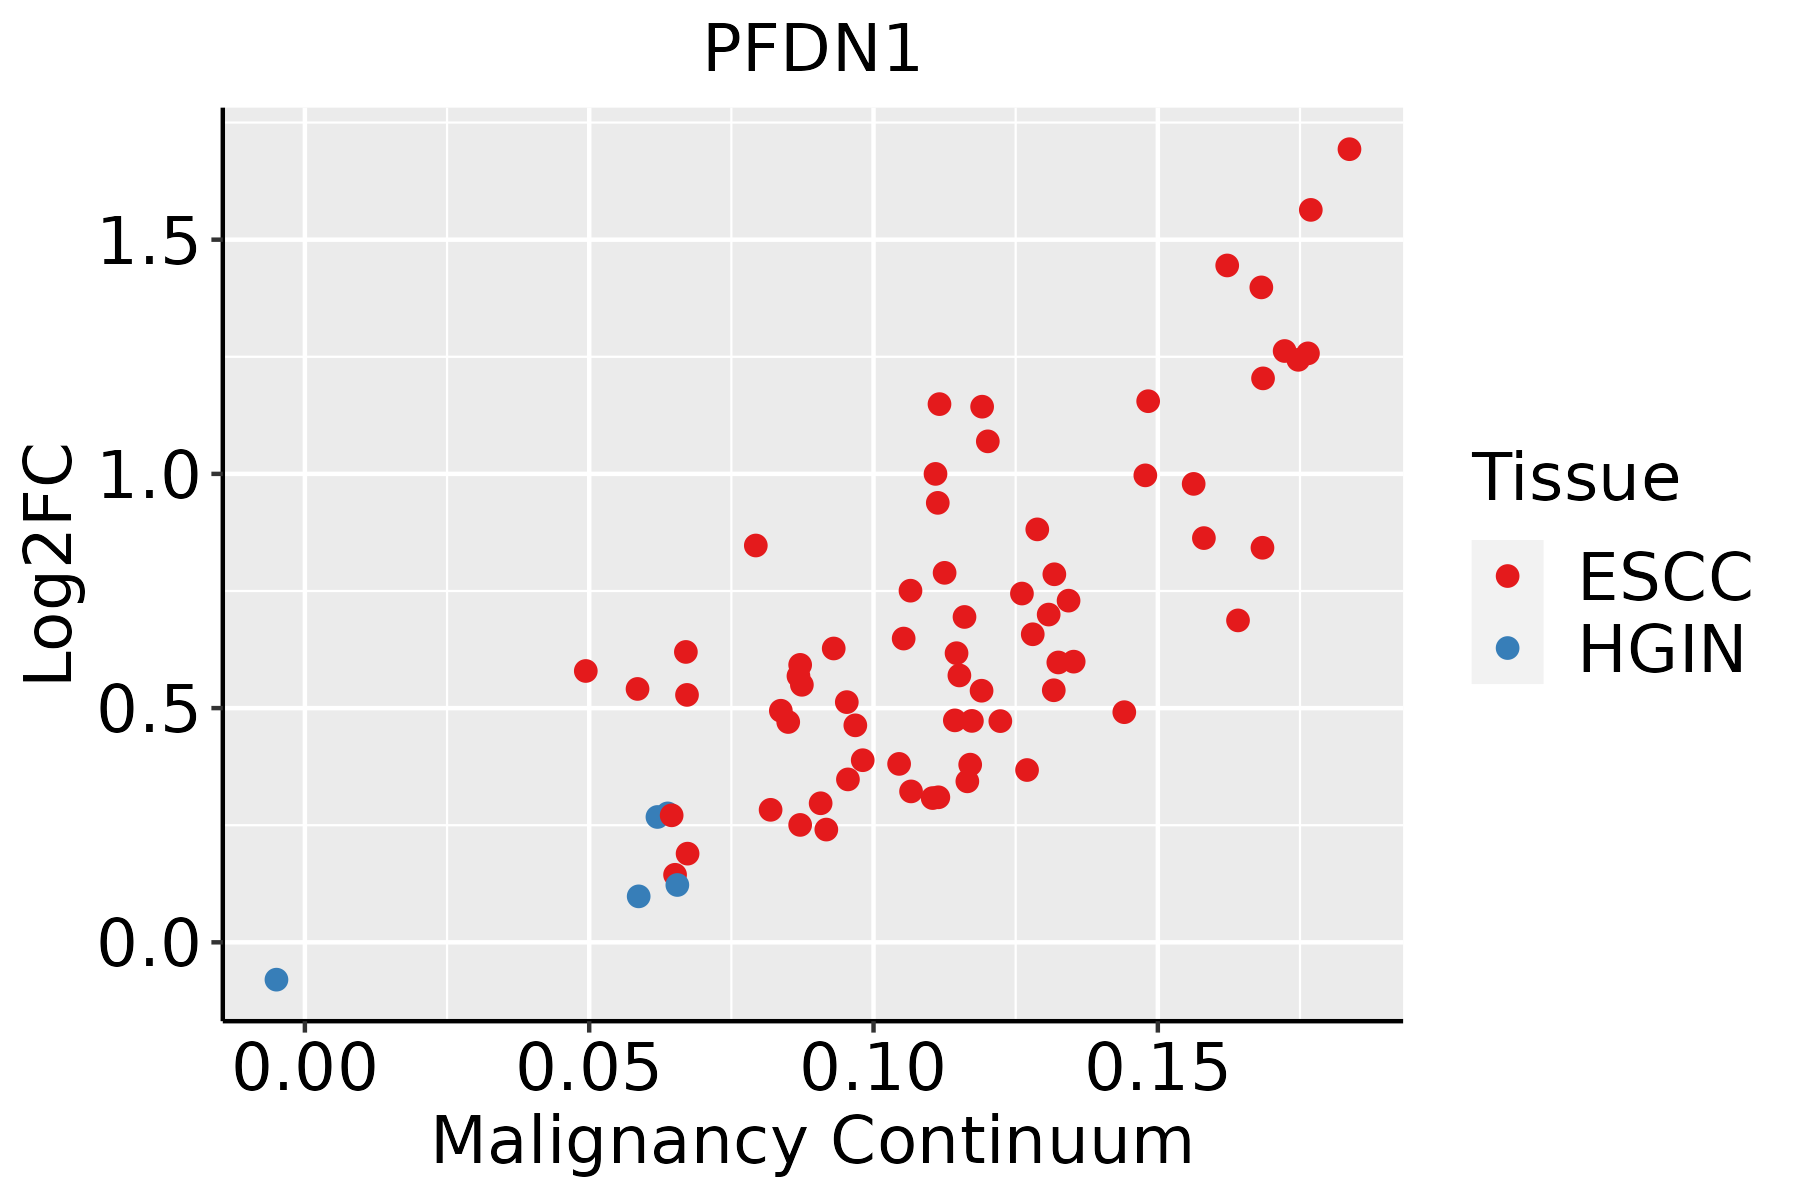 | ESCC: Esophageal squamous cell carcinoma |
| HGIN: High-grade intraepithelial neoplasias | ||
| LGIN: Low-grade intraepithelial neoplasias | ||
| Liver | 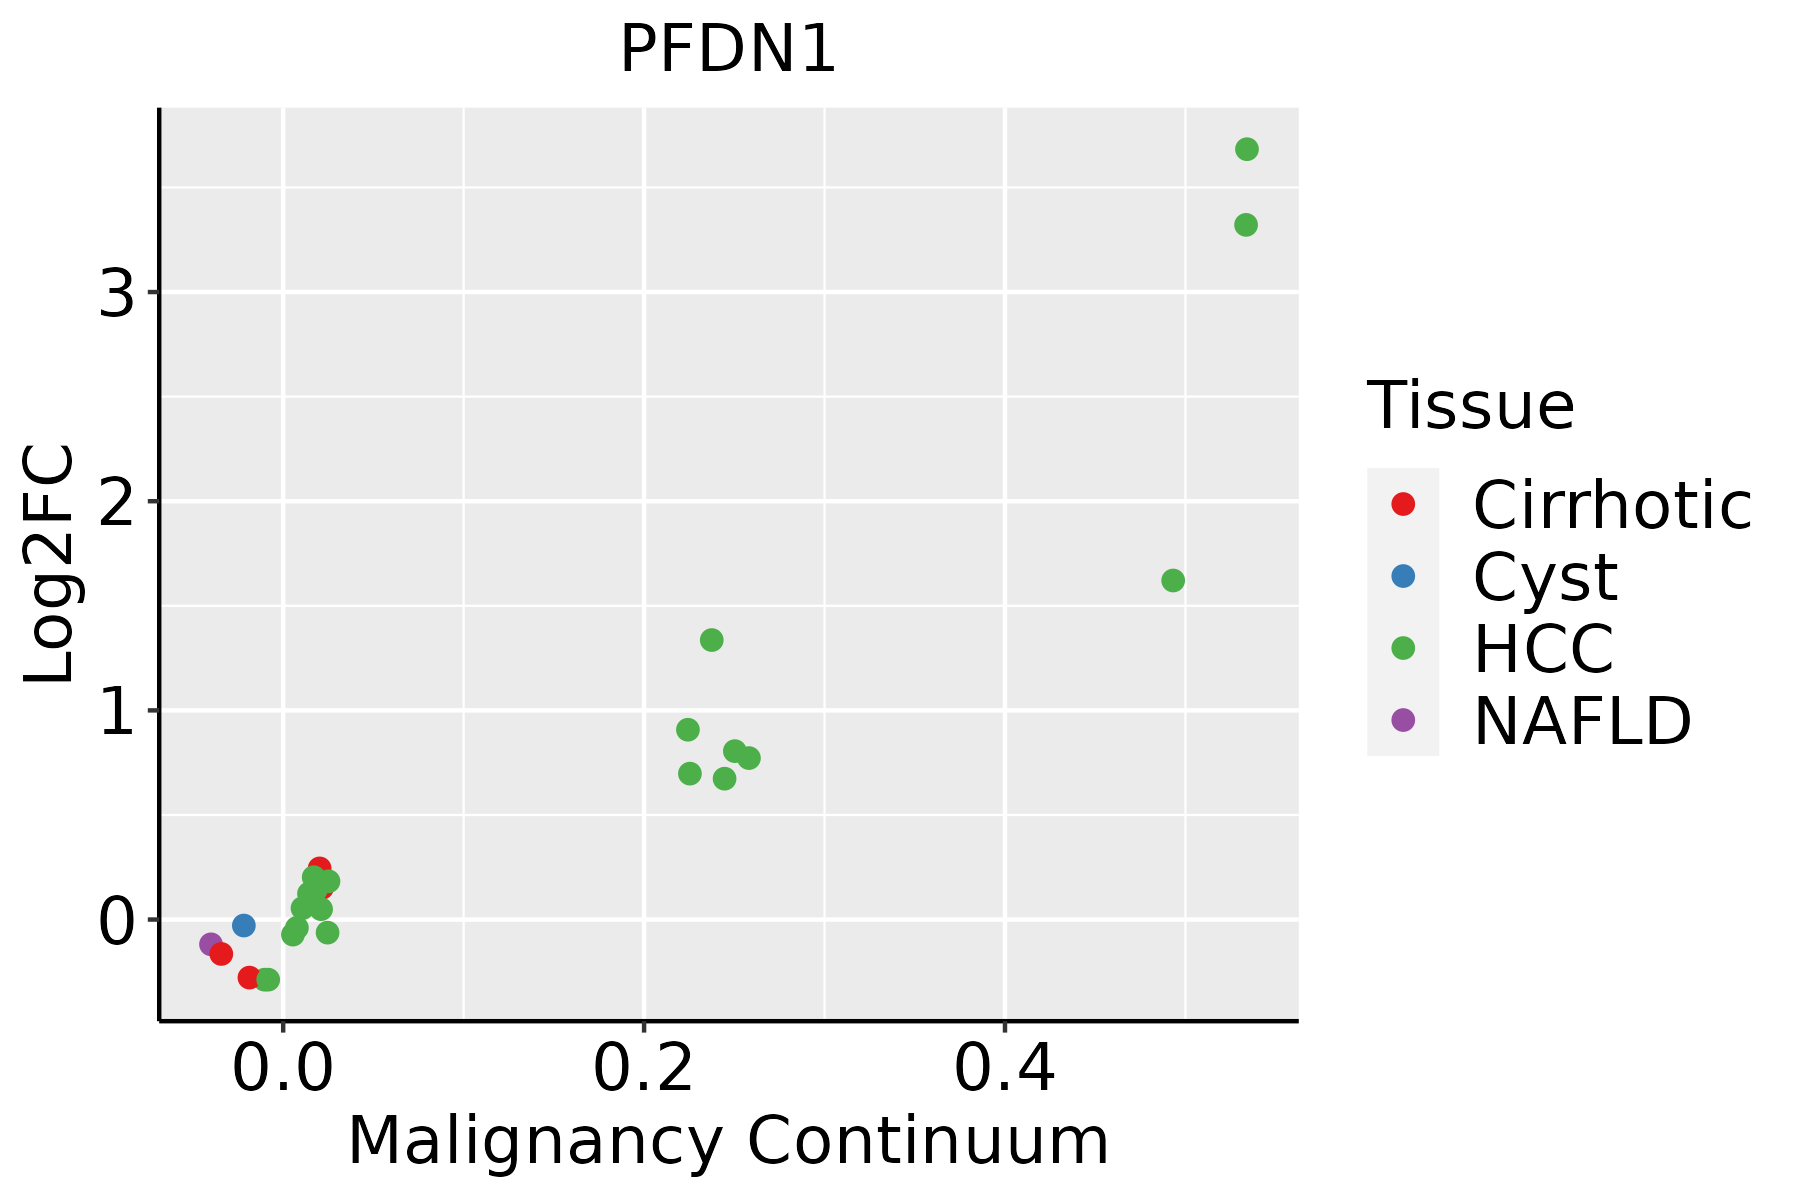 | HCC: Hepatocellular carcinoma |
| NAFLD: Non-alcoholic fatty liver disease | ||
| Oral Cavity |  | EOLP: Erosive Oral lichen planus |
| LP: leukoplakia | ||
| NEOLP: Non-erosive oral lichen planus | ||
| OSCC: Oral squamous cell carcinoma | ||
| Prostate | 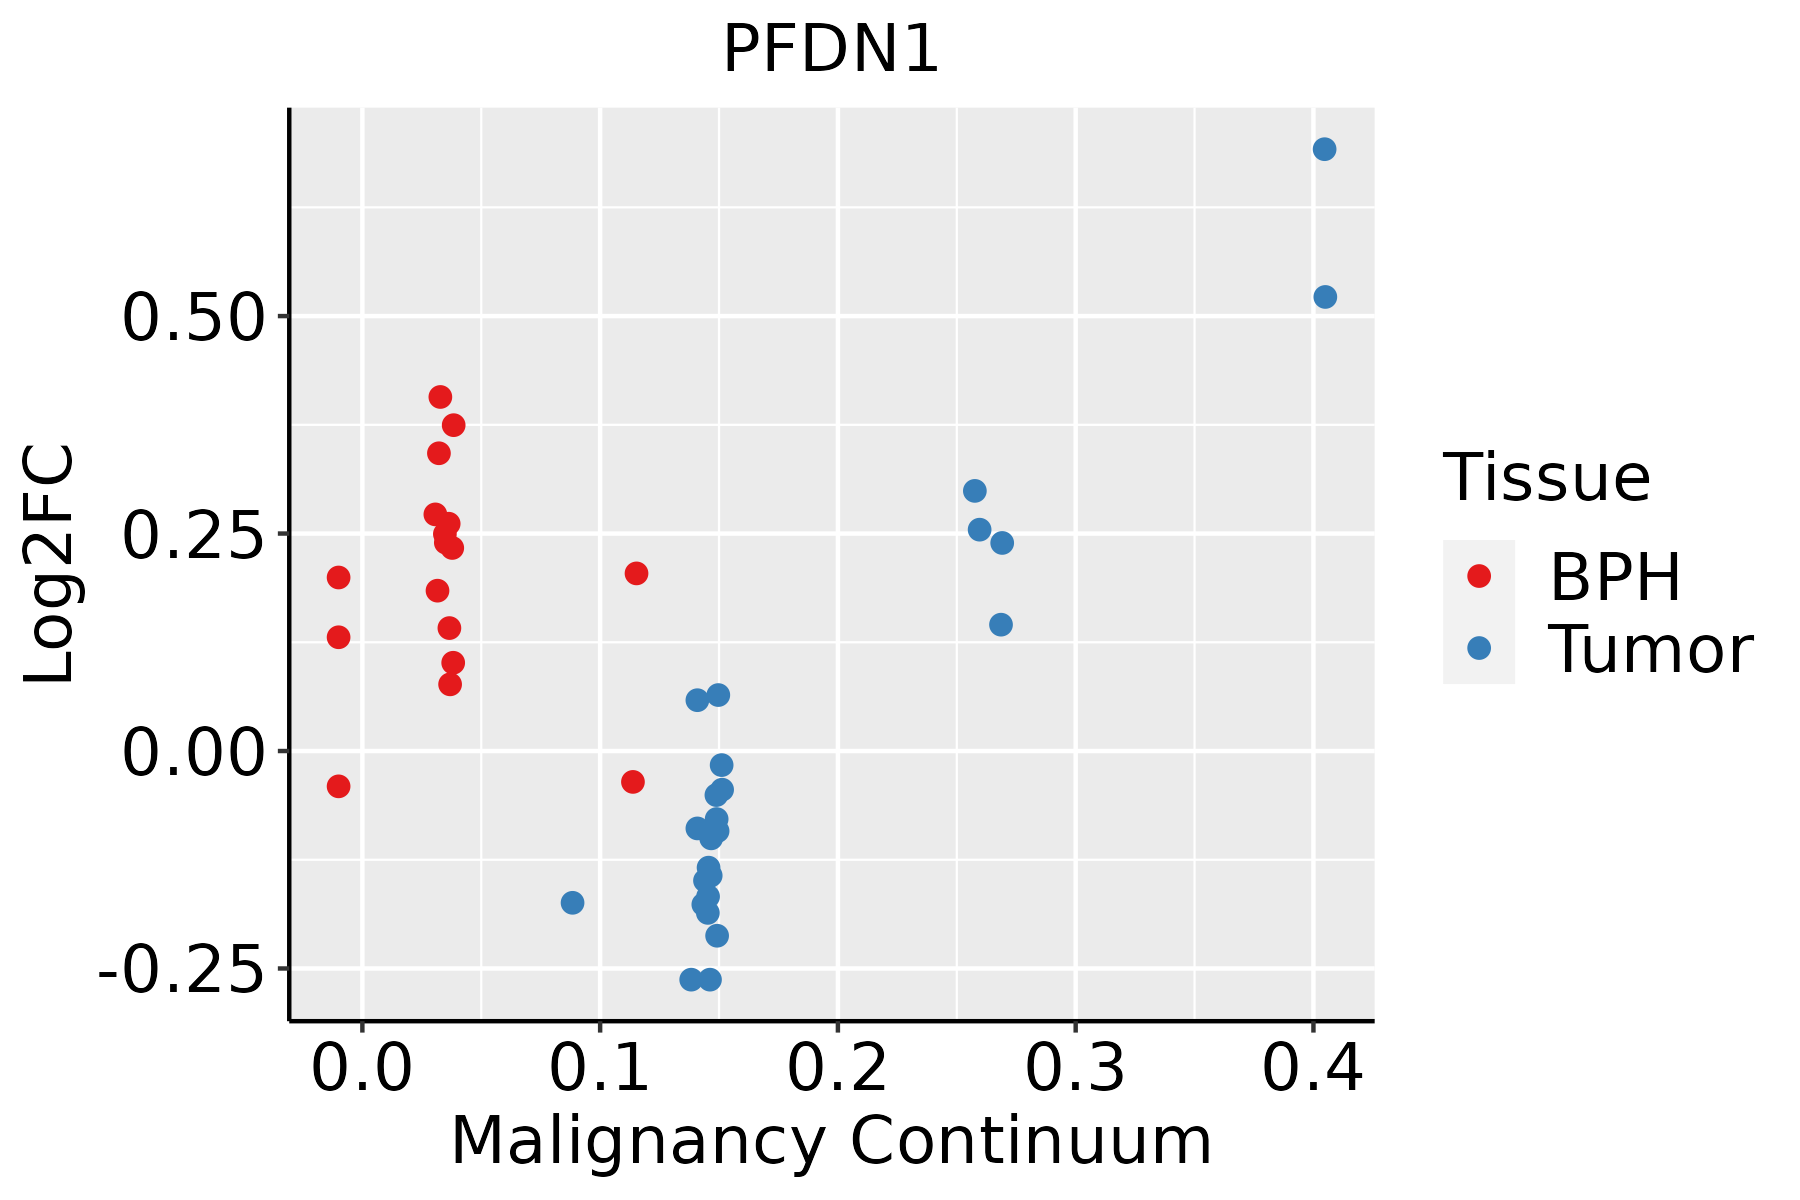 | BPH: Benign Prostatic Hyperplasia |
| Skin | 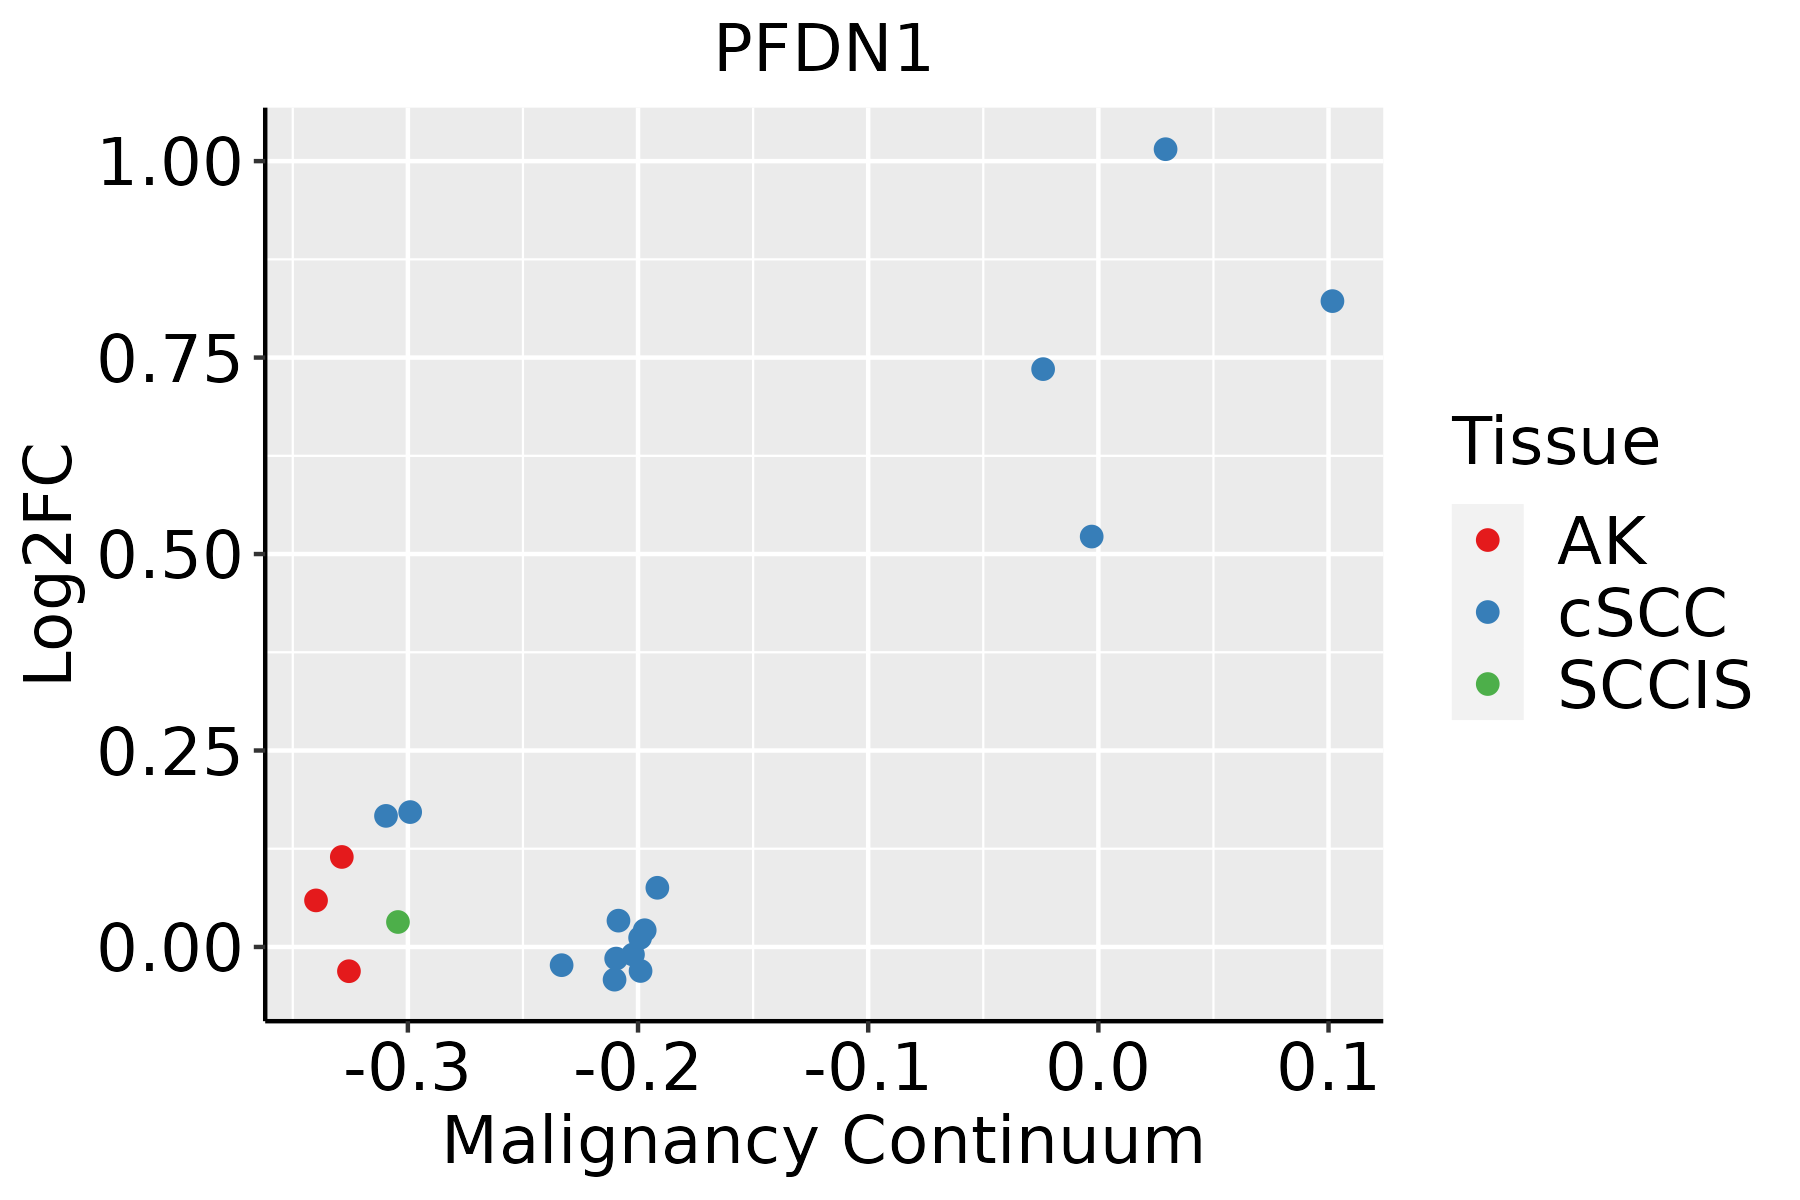 | AK: Actinic keratosis |
| cSCC: Cutaneous squamous cell carcinoma | ||
| SCCIS:squamous cell carcinoma in situ | ||
| Thyroid |  | ATC: Anaplastic thyroid cancer |
| HT: Hashimoto's thyroiditis | ||
| PTC: Papillary thyroid cancer |
| ∗log2FC in expression of this searched gene in stem-like cells from each diseased tissue sample relative to stem-like cells in normal samples in each tissue plotted against the malignancy continuum. Samples are colored based on if they are from different disease stage. |
Top |
Malignant transformation related pathway analysis |
| Find out the enriched GO biological processes and KEGG pathways involved in transition from healthy to precancer to cancer |
| Tissue | Disease Stage | Enriched GO biological Processes |
| Colorectum | AD |  |
| Colorectum | SER |  |
| Colorectum | MSS |  |
| Colorectum | MSI-H |  |
| Colorectum | FAP |  |
| ∗Top 15 enriched GO BP terms are showed in the bar plot of each disease state in each tissue. Each row represents a significant GO biological process which is colored according to the -log10(p.adjust). |
| Page: 1 2 3 4 5 6 7 8 9 |
| GO ID | Tissue | Disease Stage | Description | Gene Ratio | Bg Ratio | pvalue | p.adjust | Count |
| GO:0006457110 | Esophagus | ESCC | protein folding | 163/8552 | 212/18723 | 1.13e-20 | 1.74e-18 | 163 |
| GO:1902903111 | Esophagus | ESCC | regulation of supramolecular fiber organization | 237/8552 | 383/18723 | 9.06e-11 | 2.75e-09 | 237 |
| GO:190590616 | Esophagus | ESCC | regulation of amyloid fibril formation | 13/8552 | 16/18723 | 4.05e-03 | 1.62e-02 | 13 |
| GO:190590716 | Esophagus | ESCC | negative regulation of amyloid fibril formation | 11/8552 | 13/18723 | 4.76e-03 | 1.85e-02 | 11 |
| GO:00064577 | Liver | Cirrhotic | protein folding | 114/4634 | 212/18723 | 9.23e-20 | 2.31e-17 | 114 |
| GO:190290312 | Liver | Cirrhotic | regulation of supramolecular fiber organization | 148/4634 | 383/18723 | 8.85e-10 | 4.08e-08 | 148 |
| GO:19900003 | Liver | Cirrhotic | amyloid fibril formation | 19/4634 | 34/18723 | 1.01e-04 | 1.05e-03 | 19 |
| GO:1905907 | Liver | Cirrhotic | negative regulation of amyloid fibril formation | 10/4634 | 13/18723 | 1.14e-04 | 1.14e-03 | 10 |
| GO:19029046 | Liver | Cirrhotic | negative regulation of supramolecular fiber organization | 63/4634 | 167/18723 | 1.29e-04 | 1.26e-03 | 63 |
| GO:1905906 | Liver | Cirrhotic | regulation of amyloid fibril formation | 11/4634 | 16/18723 | 2.58e-04 | 2.30e-03 | 11 |
| GO:000645712 | Liver | HCC | protein folding | 160/7958 | 212/18723 | 1.07e-22 | 1.88e-20 | 160 |
| GO:190290322 | Liver | HCC | regulation of supramolecular fiber organization | 224/7958 | 383/18723 | 1.54e-10 | 5.33e-09 | 224 |
| GO:199000011 | Liver | HCC | amyloid fibril formation | 24/7958 | 34/18723 | 8.62e-04 | 5.13e-03 | 24 |
| GO:190290412 | Liver | HCC | negative regulation of supramolecular fiber organization | 90/7958 | 167/18723 | 1.90e-03 | 9.69e-03 | 90 |
| GO:19059071 | Liver | HCC | negative regulation of amyloid fibril formation | 11/7958 | 13/18723 | 2.38e-03 | 1.16e-02 | 11 |
| GO:19059061 | Liver | HCC | regulation of amyloid fibril formation | 12/7958 | 16/18723 | 8.74e-03 | 3.40e-02 | 12 |
| GO:000645718 | Oral cavity | OSCC | protein folding | 154/7305 | 212/18723 | 1.89e-23 | 4.60e-21 | 154 |
| GO:190290320 | Oral cavity | OSCC | regulation of supramolecular fiber organization | 211/7305 | 383/18723 | 9.45e-11 | 2.88e-09 | 211 |
| GO:19059067 | Oral cavity | OSCC | regulation of amyloid fibril formation | 13/7305 | 16/18723 | 7.05e-04 | 3.89e-03 | 13 |
| GO:19059077 | Oral cavity | OSCC | negative regulation of amyloid fibril formation | 11/7305 | 13/18723 | 1.02e-03 | 5.29e-03 | 11 |
| Page: 1 2 3 |
| Pathway ID | Tissue | Disease Stage | Description | Gene Ratio | Bg Ratio | pvalue | p.adjust | qvalue | Count |
| Page: 1 |
Top |
Cell-cell communication analysis |
| Identification of potential cell-cell interactions between two cell types and their ligand-receptor pairs for different disease states |
| Ligand | Receptor | LRpair | Pathway | Tissue | Disease Stage |
| Page: 1 |
Top |
Single-cell gene regulatory network inference analysis |
| Find out the significant the regulons (TFs) and the target genes of each regulon across cell types for different disease states |
| TF | Cell Type | Tissue | Disease Stage | Target Gene | RSS | Regulon Activity |
| ∗The dot plots of a searched regulon are shown for all cell subpopulations in each disease state of each tissue based on the regulon specific score inferred using pySCENIC and by calculating the average expression. |
| Page: 1 |
Top |
Somatic mutation of malignant transformation related genes |
| Annotation of somatic variants for genes involved in malignant transformation |
| Hugo Symbol | Variant Class | Variant Classification | dbSNP RS | HGVSc | HGVSp | HGVSp Short | SWISSPROT | BIOTYPE | SIFT | PolyPhen | Tumor Sample Barcode | Tissue | Histology | Sex | Age | Stage | Therapy Types | Drugs | Outcome |
| PFDN1 | SNV | Missense_Mutation | c.43N>C | p.Glu15Gln | p.E15Q | O60925 | protein_coding | tolerated(0.05) | possibly_damaging(0.566) | TCGA-C8-A12T-01 | Breast | breast invasive carcinoma | Female | <65 | I/II | Unknown | Unknown | SD | |
| PFDN1 | SNV | Missense_Mutation | c.185N>G | p.Glu62Gly | p.E62G | O60925 | protein_coding | deleterious(0) | possibly_damaging(0.872) | TCGA-FU-A3HZ-01 | Cervix | cervical & endocervical cancer | Female | <65 | I/II | Chemotherapy | cisplatin | CR | |
| PFDN1 | SNV | Missense_Mutation | rs763185306 | c.119C>T | p.Thr40Met | p.T40M | O60925 | protein_coding | tolerated(0.09) | benign(0.081) | TCGA-D5-6540-01 | Colorectum | colon adenocarcinoma | Male | >=65 | I/II | Unknown | Unknown | SD |
| PFDN1 | SNV | Missense_Mutation | c.80T>C | p.Val27Ala | p.V27A | O60925 | protein_coding | tolerated(0.07) | benign(0.006) | TCGA-F4-6570-01 | Colorectum | colon adenocarcinoma | Female | >=65 | I/II | Unknown | Unknown | SD | |
| PFDN1 | SNV | Missense_Mutation | rs757466775 | c.313N>A | p.Val105Ile | p.V105I | O60925 | protein_coding | tolerated(0.2) | benign(0.048) | TCGA-A5-A0GB-01 | Endometrium | uterine corpus endometrioid carcinoma | Female | >=65 | I/II | Unknown | Unknown | SD |
| PFDN1 | SNV | Missense_Mutation | novel | c.52N>T | p.Ala18Ser | p.A18S | O60925 | protein_coding | tolerated(0.34) | benign(0.062) | TCGA-AP-A059-01 | Endometrium | uterine corpus endometrioid carcinoma | Female | >=65 | I/II | Unknown | Unknown | SD |
| PFDN1 | SNV | Missense_Mutation | c.197G>T | p.Arg66Ile | p.R66I | O60925 | protein_coding | deleterious(0.02) | benign(0.376) | TCGA-EO-A22U-01 | Endometrium | uterine corpus endometrioid carcinoma | Female | >=65 | I/II | Unknown | Unknown | SD |
| Page: 1 |
Top |
Related drugs of malignant transformation related genes |
| Identification of chemicals and drugs interact with genes involved in malignant transfromation |
| (DGIdb 4.0) |
| Entrez ID | Symbol | Category | Interaction Types | Drug Claim Name | Drug Name | PMIDs |
| Page: 1 |

Copyright 2023-Present -The University of Texas Health Science Center at Houston |