
|
|||||
|
 | |
| |
| |
| |
| |
| |
|
Gene: PEX7 |
Gene summary for PEX7 |
| Gene information | Species | Human | Gene symbol | PEX7 | Gene ID | 5191 |
| Gene name | peroxisomal biogenesis factor 7 | |
| Gene Alias | PBD9B | |
| Cytomap | 6q23.3 | |
| Gene Type | protein-coding | GO ID | GO:0006605 | UniProtAcc | O00628 |
Top |
Malignant transformation analysis |
| Identification of the aberrant gene expression in precancerous and cancerous lesions by comparing the gene expression of stem-like cells in diseased tissues with normal stem cells |
| Entrez ID | Symbol | Replicates | Species | Organ | Tissue | Adj P-value | Log2FC | Malignancy |
| 5191 | PEX7 | C21 | Human | Oral cavity | OSCC | 6.21e-13 | 4.29e-01 | 0.2678 |
| 5191 | PEX7 | C30 | Human | Oral cavity | OSCC | 1.07e-33 | 1.07e+00 | 0.3055 |
| 5191 | PEX7 | C43 | Human | Oral cavity | OSCC | 1.97e-12 | 2.93e-01 | 0.1704 |
| 5191 | PEX7 | C46 | Human | Oral cavity | OSCC | 9.46e-12 | 3.51e-01 | 0.1673 |
| 5191 | PEX7 | C06 | Human | Oral cavity | OSCC | 2.06e-02 | 5.11e-01 | 0.2699 |
| 5191 | PEX7 | C08 | Human | Oral cavity | OSCC | 1.19e-10 | 3.51e-01 | 0.1919 |
| 5191 | PEX7 | LN46 | Human | Oral cavity | OSCC | 5.58e-03 | 1.80e-01 | 0.1666 |
| 5191 | PEX7 | LP15 | Human | Oral cavity | LP | 3.77e-04 | 7.48e-01 | 0.2174 |
| 5191 | PEX7 | SYSMH1 | Human | Oral cavity | OSCC | 9.79e-05 | 2.05e-01 | 0.1127 |
| 5191 | PEX7 | SYSMH2 | Human | Oral cavity | OSCC | 3.79e-09 | 2.33e-01 | 0.2326 |
| 5191 | PEX7 | SYSMH6 | Human | Oral cavity | OSCC | 5.99e-03 | 1.86e-01 | 0.1275 |
| Page: 1 |
| Tissue | Expression Dynamics | Abbreviation |
| Oral Cavity | 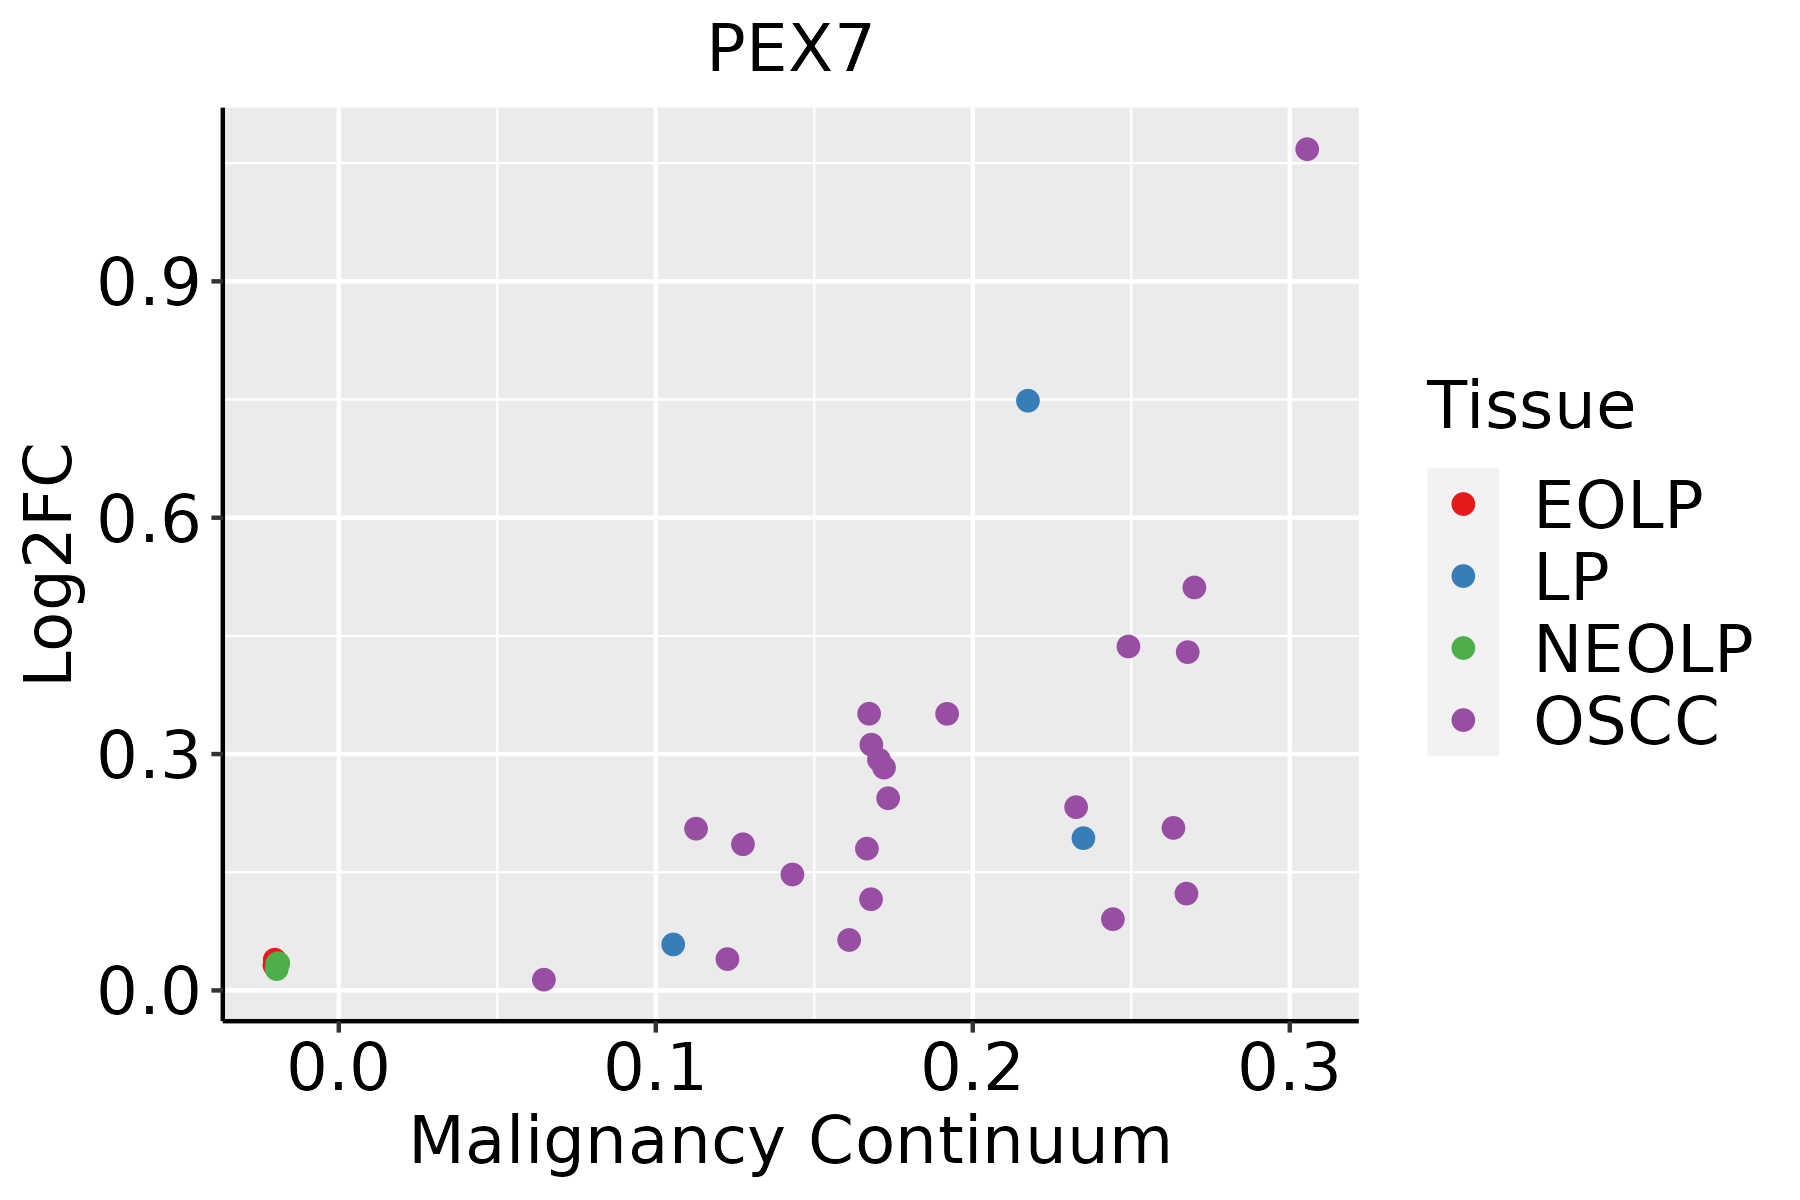 | EOLP: Erosive Oral lichen planus |
| LP: leukoplakia | ||
| NEOLP: Non-erosive oral lichen planus | ||
| OSCC: Oral squamous cell carcinoma |
| ∗log2FC in expression of this searched gene in stem-like cells from each diseased tissue sample relative to stem-like cells in normal samples in each tissue plotted against the malignancy continuum. Samples are colored based on if they are from different disease stage. |
Top |
Malignant transformation related pathway analysis |
| Find out the enriched GO biological processes and KEGG pathways involved in transition from healthy to precancer to cancer |
| Tissue | Disease Stage | Enriched GO biological Processes |
| Colorectum | AD |  |
| Colorectum | SER |  |
| Colorectum | MSS |  |
| Colorectum | MSI-H |  |
| Colorectum | FAP |  |
| ∗Top 15 enriched GO BP terms are showed in the bar plot of each disease state in each tissue. Each row represents a significant GO biological process which is colored according to the -log10(p.adjust). |
| Page: 1 2 3 4 5 6 7 8 9 |
| GO ID | Tissue | Disease Stage | Description | Gene Ratio | Bg Ratio | pvalue | p.adjust | Count |
| GO:007259418 | Oral cavity | OSCC | establishment of protein localization to organelle | 284/7305 | 422/18723 | 1.50e-32 | 1.35e-29 | 284 |
| GO:000660520 | Oral cavity | OSCC | protein targeting | 204/7305 | 314/18723 | 6.78e-21 | 1.13e-18 | 204 |
| GO:001703815 | Oral cavity | OSCC | protein import | 136/7305 | 206/18723 | 3.15e-15 | 2.08e-13 | 136 |
| GO:00718068 | Oral cavity | OSCC | protein transmembrane transport | 43/7305 | 59/18723 | 1.32e-07 | 2.22e-06 | 43 |
| GO:00650025 | Oral cavity | OSCC | intracellular protein transmembrane transport | 36/7305 | 51/18723 | 4.79e-06 | 5.47e-05 | 36 |
| GO:00447432 | Oral cavity | OSCC | protein transmembrane import into intracellular organelle | 25/7305 | 36/18723 | 2.10e-04 | 1.38e-03 | 25 |
| GO:0006625 | Oral cavity | OSCC | protein targeting to peroxisome | 14/7305 | 18/18723 | 9.51e-04 | 4.96e-03 | 14 |
| GO:0072662 | Oral cavity | OSCC | protein localization to peroxisome | 14/7305 | 18/18723 | 9.51e-04 | 4.96e-03 | 14 |
| GO:0072663 | Oral cavity | OSCC | establishment of protein localization to peroxisome | 14/7305 | 18/18723 | 9.51e-04 | 4.96e-03 | 14 |
| GO:0043574 | Oral cavity | OSCC | peroxisomal transport | 16/7305 | 22/18723 | 1.40e-03 | 6.79e-03 | 16 |
| GO:00070312 | Oral cavity | OSCC | peroxisome organization | 23/7305 | 36/18723 | 2.19e-03 | 9.95e-03 | 23 |
| GO:0015919 | Oral cavity | OSCC | peroxisomal membrane transport | 14/7305 | 20/18723 | 4.95e-03 | 1.94e-02 | 14 |
| GO:007259419 | Oral cavity | LP | establishment of protein localization to organelle | 205/4623 | 422/18723 | 6.76e-27 | 3.85e-24 | 205 |
| GO:0006605110 | Oral cavity | LP | protein targeting | 156/4623 | 314/18723 | 5.43e-22 | 1.62e-19 | 156 |
| GO:001703816 | Oral cavity | LP | protein import | 95/4623 | 206/18723 | 1.55e-11 | 1.13e-09 | 95 |
| GO:007180615 | Oral cavity | LP | protein transmembrane transport | 36/4623 | 59/18723 | 3.37e-09 | 1.44e-07 | 36 |
| GO:006500213 | Oral cavity | LP | intracellular protein transmembrane transport | 31/4623 | 51/18723 | 4.70e-08 | 1.64e-06 | 31 |
| GO:004474311 | Oral cavity | LP | protein transmembrane import into intracellular organelle | 22/4623 | 36/18723 | 3.76e-06 | 7.90e-05 | 22 |
| GO:00070311 | Oral cavity | LP | peroxisome organization | 17/4623 | 36/18723 | 2.74e-03 | 1.92e-02 | 17 |
| GO:00066251 | Oral cavity | LP | protein targeting to peroxisome | 10/4623 | 18/18723 | 4.91e-03 | 3.06e-02 | 10 |
| Page: 1 2 |
| Pathway ID | Tissue | Disease Stage | Description | Gene Ratio | Bg Ratio | pvalue | p.adjust | qvalue | Count |
| hsa041466 | Oral cavity | OSCC | Peroxisome | 47/3704 | 82/8465 | 9.01e-03 | 2.01e-02 | 1.03e-02 | 47 |
| hsa0414611 | Oral cavity | OSCC | Peroxisome | 47/3704 | 82/8465 | 9.01e-03 | 2.01e-02 | 1.03e-02 | 47 |
| hsa0414621 | Oral cavity | LP | Peroxisome | 33/2418 | 82/8465 | 1.48e-02 | 4.69e-02 | 3.03e-02 | 33 |
| hsa0414631 | Oral cavity | LP | Peroxisome | 33/2418 | 82/8465 | 1.48e-02 | 4.69e-02 | 3.03e-02 | 33 |
| Page: 1 |
Top |
Cell-cell communication analysis |
| Identification of potential cell-cell interactions between two cell types and their ligand-receptor pairs for different disease states |
| Ligand | Receptor | LRpair | Pathway | Tissue | Disease Stage |
| Page: 1 |
Top |
Single-cell gene regulatory network inference analysis |
| Find out the significant the regulons (TFs) and the target genes of each regulon across cell types for different disease states |
| TF | Cell Type | Tissue | Disease Stage | Target Gene | RSS | Regulon Activity |
| ∗The dot plots of a searched regulon are shown for all cell subpopulations in each disease state of each tissue based on the regulon specific score inferred using pySCENIC and by calculating the average expression. |
| Page: 1 |
Top |
Somatic mutation of malignant transformation related genes |
| Annotation of somatic variants for genes involved in malignant transformation |
| Hugo Symbol | Variant Class | Variant Classification | dbSNP RS | HGVSc | HGVSp | HGVSp Short | SWISSPROT | BIOTYPE | SIFT | PolyPhen | Tumor Sample Barcode | Tissue | Histology | Sex | Age | Stage | Therapy Types | Drugs | Outcome |
| PEX7 | SNV | Missense_Mutation | novel | c.189N>G | p.Ser63Arg | p.S63R | O00628 | protein_coding | tolerated(0.39) | benign(0.065) | TCGA-A8-A09A-01 | Breast | breast invasive carcinoma | Female | <65 | I/II | Hormone Therapy | tamoxiphen | SD |
| PEX7 | SNV | Missense_Mutation | c.272N>G | p.Ser91Trp | p.S91W | O00628 | protein_coding | deleterious(0) | probably_damaging(1) | TCGA-B6-A0WW-01 | Breast | breast invasive carcinoma | Female | <65 | I/II | Unknown | Unknown | PD | |
| PEX7 | SNV | Missense_Mutation | c.243N>G | p.His81Gln | p.H81Q | O00628 | protein_coding | deleterious(0.04) | possibly_damaging(0.776) | TCGA-D8-A1XC-01 | Breast | breast invasive carcinoma | Female | >=65 | III/IV | Unknown | Unknown | PD | |
| PEX7 | SNV | Missense_Mutation | novel | c.674N>T | p.Gly225Val | p.G225V | O00628 | protein_coding | tolerated(0.95) | benign(0.092) | TCGA-E2-A56Z-01 | Breast | breast invasive carcinoma | Female | >=65 | I/II | Hormone Therapy | arimidex | SD |
| PEX7 | insertion | Nonsense_Mutation | novel | c.685_686insATCCATTGCTGTTCTGAGTTATGTGGGGT | p.Arg229AsnfsTer6 | p.R229Nfs*6 | O00628 | protein_coding | TCGA-AQ-A04J-01 | Breast | breast invasive carcinoma | Female | <65 | I/II | Chemotherapy | cytoxan | SD | ||
| PEX7 | SNV | Missense_Mutation | rs769576852 | c.680A>G | p.Asp227Gly | p.D227G | O00628 | protein_coding | deleterious(0) | benign(0.148) | TCGA-2W-A8YY-01 | Cervix | cervical & endocervical cancer | Female | <65 | I/II | Chemotherapy | cisplatin | CR |
| PEX7 | SNV | Missense_Mutation | c.259N>G | p.Ser87Gly | p.S87G | O00628 | protein_coding | tolerated(0.4) | benign(0) | TCGA-AZ-6598-01 | Colorectum | colon adenocarcinoma | Female | >=65 | I/II | Unknown | Unknown | SD | |
| PEX7 | SNV | Missense_Mutation | c.131N>A | p.Gly44Asp | p.G44D | O00628 | protein_coding | deleterious(0) | probably_damaging(1) | TCGA-QG-A5Z1-01 | Colorectum | colon adenocarcinoma | Male | >=65 | III/IV | Unspecific | Complete Response | ||
| PEX7 | SNV | Missense_Mutation | novel | c.652N>A | p.Ala218Thr | p.A218T | O00628 | protein_coding | deleterious(0.02) | benign(0.192) | TCGA-A5-A0GP-01 | Endometrium | uterine corpus endometrioid carcinoma | Female | <65 | I/II | Unknown | Unknown | SD |
| PEX7 | SNV | Missense_Mutation | novel | c.968N>T | p.Ala323Val | p.A323V | O00628 | protein_coding | tolerated_low_confidence(0.23) | benign(0) | TCGA-A5-A1OF-01 | Endometrium | uterine corpus endometrioid carcinoma | Female | <65 | I/II | Unknown | Unknown | SD |
| Page: 1 2 3 |
Top |
Related drugs of malignant transformation related genes |
| Identification of chemicals and drugs interact with genes involved in malignant transfromation |
| (DGIdb 4.0) |
| Entrez ID | Symbol | Category | Interaction Types | Drug Claim Name | Drug Name | PMIDs |
| Page: 1 |

Copyright 2023-Present -The University of Texas Health Science Center at Houston |