
|
|||||
|
 | |
| |
| |
| |
| |
| |
|
Gene: PEX6 |
Gene summary for PEX6 |
| Gene information | Species | Human | Gene symbol | PEX6 | Gene ID | 5190 |
| Gene name | peroxisomal biogenesis factor 6 | |
| Gene Alias | HMLR2 | |
| Cytomap | 6p21.1 | |
| Gene Type | protein-coding | GO ID | GO:0006605 | UniProtAcc | A0A024RD09 |
Top |
Malignant transformation analysis |
| Identification of the aberrant gene expression in precancerous and cancerous lesions by comparing the gene expression of stem-like cells in diseased tissues with normal stem cells |
| Entrez ID | Symbol | Replicates | Species | Organ | Tissue | Adj P-value | Log2FC | Malignancy |
| 5190 | PEX6 | LZE2T | Human | Esophagus | ESCC | 2.57e-08 | 7.43e-01 | 0.082 |
| 5190 | PEX6 | P2T-E | Human | Esophagus | ESCC | 3.18e-16 | 2.23e-01 | 0.1177 |
| 5190 | PEX6 | P4T-E | Human | Esophagus | ESCC | 1.37e-08 | 1.49e-01 | 0.1323 |
| 5190 | PEX6 | P5T-E | Human | Esophagus | ESCC | 3.49e-05 | 8.54e-02 | 0.1327 |
| 5190 | PEX6 | P8T-E | Human | Esophagus | ESCC | 3.36e-06 | 4.84e-02 | 0.0889 |
| 5190 | PEX6 | P10T-E | Human | Esophagus | ESCC | 3.56e-07 | 9.99e-02 | 0.116 |
| 5190 | PEX6 | P12T-E | Human | Esophagus | ESCC | 3.69e-09 | 7.78e-02 | 0.1122 |
| 5190 | PEX6 | P15T-E | Human | Esophagus | ESCC | 1.97e-06 | 1.29e-01 | 0.1149 |
| 5190 | PEX6 | P16T-E | Human | Esophagus | ESCC | 4.12e-04 | 5.47e-02 | 0.1153 |
| 5190 | PEX6 | P23T-E | Human | Esophagus | ESCC | 6.42e-03 | 1.51e-01 | 0.108 |
| 5190 | PEX6 | P24T-E | Human | Esophagus | ESCC | 1.66e-08 | 7.46e-02 | 0.1287 |
| 5190 | PEX6 | P26T-E | Human | Esophagus | ESCC | 8.90e-08 | 5.78e-02 | 0.1276 |
| 5190 | PEX6 | P27T-E | Human | Esophagus | ESCC | 2.52e-12 | 1.50e-01 | 0.1055 |
| 5190 | PEX6 | P28T-E | Human | Esophagus | ESCC | 7.30e-16 | 1.36e-01 | 0.1149 |
| 5190 | PEX6 | P30T-E | Human | Esophagus | ESCC | 2.08e-04 | 1.40e-01 | 0.137 |
| 5190 | PEX6 | P31T-E | Human | Esophagus | ESCC | 2.90e-03 | 6.61e-02 | 0.1251 |
| 5190 | PEX6 | P32T-E | Human | Esophagus | ESCC | 4.29e-06 | 2.40e-02 | 0.1666 |
| 5190 | PEX6 | P48T-E | Human | Esophagus | ESCC | 1.28e-05 | 6.70e-02 | 0.0959 |
| 5190 | PEX6 | P49T-E | Human | Esophagus | ESCC | 7.45e-10 | 1.02e+00 | 0.1768 |
| 5190 | PEX6 | P57T-E | Human | Esophagus | ESCC | 6.65e-13 | 1.07e-01 | 0.0926 |
| Page: 1 2 |
| Tissue | Expression Dynamics | Abbreviation |
| Esophagus |  | ESCC: Esophageal squamous cell carcinoma |
| HGIN: High-grade intraepithelial neoplasias | ||
| LGIN: Low-grade intraepithelial neoplasias | ||
| Liver | 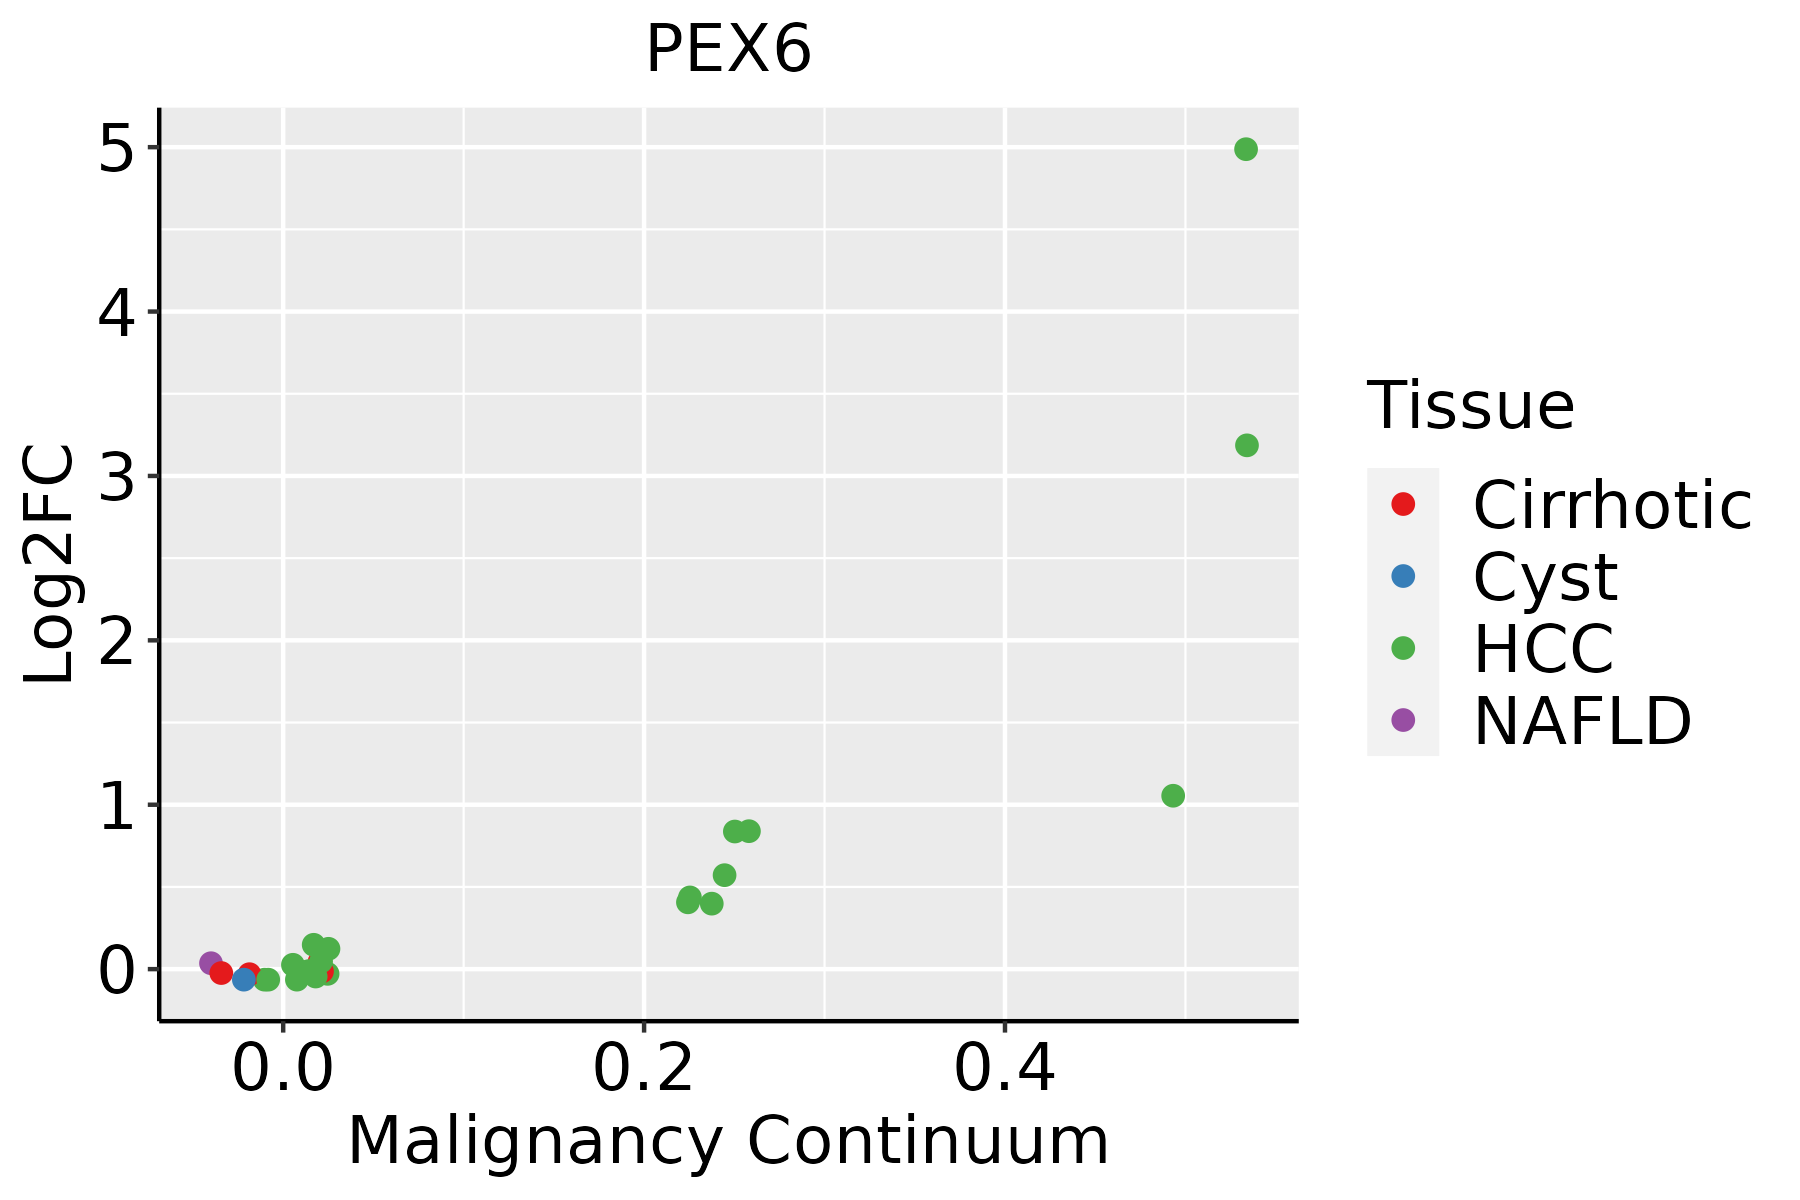 | HCC: Hepatocellular carcinoma |
| NAFLD: Non-alcoholic fatty liver disease |
| ∗log2FC in expression of this searched gene in stem-like cells from each diseased tissue sample relative to stem-like cells in normal samples in each tissue plotted against the malignancy continuum. Samples are colored based on if they are from different disease stage. |
Top |
Malignant transformation related pathway analysis |
| Find out the enriched GO biological processes and KEGG pathways involved in transition from healthy to precancer to cancer |
| Tissue | Disease Stage | Enriched GO biological Processes |
| Colorectum | AD |  |
| Colorectum | SER |  |
| Colorectum | MSS |  |
| Colorectum | MSI-H |  |
| Colorectum | FAP |  |
| ∗Top 15 enriched GO BP terms are showed in the bar plot of each disease state in each tissue. Each row represents a significant GO biological process which is colored according to the -log10(p.adjust). |
| Page: 1 2 3 4 5 6 7 8 9 |
| GO ID | Tissue | Disease Stage | Description | Gene Ratio | Bg Ratio | pvalue | p.adjust | Count |
| GO:0072594110 | Esophagus | ESCC | establishment of protein localization to organelle | 311/8552 | 422/18723 | 3.02e-32 | 2.13e-29 | 311 |
| GO:0031647111 | Esophagus | ESCC | regulation of protein stability | 223/8552 | 298/18723 | 5.76e-25 | 1.52e-22 | 223 |
| GO:0006605111 | Esophagus | ESCC | protein targeting | 229/8552 | 314/18723 | 4.93e-23 | 1.01e-20 | 229 |
| GO:001703818 | Esophagus | ESCC | protein import | 149/8552 | 206/18723 | 5.90e-15 | 3.31e-13 | 149 |
| GO:0050821111 | Esophagus | ESCC | protein stabilization | 140/8552 | 191/18723 | 6.50e-15 | 3.61e-13 | 140 |
| GO:00718069 | Esophagus | ESCC | protein transmembrane transport | 47/8552 | 59/18723 | 9.02e-08 | 1.51e-06 | 47 |
| GO:00650026 | Esophagus | ESCC | intracellular protein transmembrane transport | 40/8552 | 51/18723 | 1.76e-06 | 2.08e-05 | 40 |
| GO:00447433 | Esophagus | ESCC | protein transmembrane import into intracellular organelle | 29/8552 | 36/18723 | 1.91e-05 | 1.67e-04 | 29 |
| GO:00066252 | Esophagus | ESCC | protein targeting to peroxisome | 14/8552 | 18/18723 | 5.77e-03 | 2.14e-02 | 14 |
| GO:00726622 | Esophagus | ESCC | protein localization to peroxisome | 14/8552 | 18/18723 | 5.77e-03 | 2.14e-02 | 14 |
| GO:00726632 | Esophagus | ESCC | establishment of protein localization to peroxisome | 14/8552 | 18/18723 | 5.77e-03 | 2.14e-02 | 14 |
| GO:00435742 | Esophagus | ESCC | peroxisomal transport | 16/8552 | 22/18723 | 9.46e-03 | 3.28e-02 | 16 |
| GO:007259422 | Liver | HCC | establishment of protein localization to organelle | 299/7958 | 422/18723 | 1.06e-32 | 6.10e-30 | 299 |
| GO:003164722 | Liver | HCC | regulation of protein stability | 211/7958 | 298/18723 | 2.29e-23 | 5.01e-21 | 211 |
| GO:000660512 | Liver | HCC | protein targeting | 219/7958 | 314/18723 | 7.74e-23 | 1.49e-20 | 219 |
| GO:005082122 | Liver | HCC | protein stabilization | 139/7958 | 191/18723 | 1.61e-17 | 1.71e-15 | 139 |
| GO:001703811 | Liver | HCC | protein import | 140/7958 | 206/18723 | 1.12e-13 | 6.46e-12 | 140 |
| GO:007180611 | Liver | HCC | protein transmembrane transport | 47/7958 | 59/18723 | 5.82e-09 | 1.51e-07 | 47 |
| GO:006500211 | Liver | HCC | intracellular protein transmembrane transport | 41/7958 | 51/18723 | 3.41e-08 | 7.61e-07 | 41 |
| GO:00447431 | Liver | HCC | protein transmembrane import into intracellular organelle | 29/7958 | 36/18723 | 3.42e-06 | 4.49e-05 | 29 |
| Page: 1 2 |
| Pathway ID | Tissue | Disease Stage | Description | Gene Ratio | Bg Ratio | pvalue | p.adjust | qvalue | Count |
| hsa041467 | Esophagus | ESCC | Peroxisome | 55/4205 | 82/8465 | 1.04e-03 | 3.27e-03 | 1.68e-03 | 55 |
| hsa0414612 | Esophagus | ESCC | Peroxisome | 55/4205 | 82/8465 | 1.04e-03 | 3.27e-03 | 1.68e-03 | 55 |
| hsa041464 | Liver | HCC | Peroxisome | 58/4020 | 82/8465 | 1.57e-05 | 1.05e-04 | 5.85e-05 | 58 |
| hsa041465 | Liver | HCC | Peroxisome | 58/4020 | 82/8465 | 1.57e-05 | 1.05e-04 | 5.85e-05 | 58 |
| Page: 1 |
Top |
Cell-cell communication analysis |
| Identification of potential cell-cell interactions between two cell types and their ligand-receptor pairs for different disease states |
| Ligand | Receptor | LRpair | Pathway | Tissue | Disease Stage |
| Page: 1 |
Top |
Single-cell gene regulatory network inference analysis |
| Find out the significant the regulons (TFs) and the target genes of each regulon across cell types for different disease states |
| TF | Cell Type | Tissue | Disease Stage | Target Gene | RSS | Regulon Activity |
| ∗The dot plots of a searched regulon are shown for all cell subpopulations in each disease state of each tissue based on the regulon specific score inferred using pySCENIC and by calculating the average expression. |
| Page: 1 |
Top |
Somatic mutation of malignant transformation related genes |
| Annotation of somatic variants for genes involved in malignant transformation |
| Hugo Symbol | Variant Class | Variant Classification | dbSNP RS | HGVSc | HGVSp | HGVSp Short | SWISSPROT | BIOTYPE | SIFT | PolyPhen | Tumor Sample Barcode | Tissue | Histology | Sex | Age | Stage | Therapy Types | Drugs | Outcome |
| PEX6 | SNV | Missense_Mutation | c.2749C>G | p.Leu917Val | p.L917V | Q13608 | protein_coding | deleterious(0) | probably_damaging(0.925) | TCGA-A8-A09M-01 | Breast | breast invasive carcinoma | Female | >=65 | III/IV | Chemotherapy | paclitaxel | CR | |
| PEX6 | SNV | Missense_Mutation | c.1927N>C | p.Ser643Arg | p.S643R | Q13608 | protein_coding | tolerated(0.11) | benign(0.021) | TCGA-D8-A1XK-01 | Breast | breast invasive carcinoma | Female | <65 | I/II | Chemotherapy | doxorubicine+cyclophosphamide | SD | |
| PEX6 | SNV | Missense_Mutation | novel | c.1891G>A | p.Val631Met | p.V631M | Q13608 | protein_coding | tolerated(0.05) | possibly_damaging(0.447) | TCGA-E2-A2P6-01 | Breast | breast invasive carcinoma | Female | >=65 | I/II | Hormone Therapy | anastrozole | SD |
| PEX6 | insertion | Frame_Shift_Ins | novel | c.1404_1405insGGAGGGGCTGCCCAAGAGGTCAATTGTGTGTATGT | p.Arg469GlyfsTer23 | p.R469Gfs*23 | Q13608 | protein_coding | TCGA-BH-A0DZ-01 | Breast | breast invasive carcinoma | Female | <65 | I/II | Chemotherapy | docetaxel | SD | ||
| PEX6 | deletion | Frame_Shift_Del | novel | c.1568delN | p.Pro523LeufsTer25 | p.P523Lfs*25 | Q13608 | protein_coding | TCGA-D8-A27V-01 | Breast | breast invasive carcinoma | Female | <65 | I/II | Hormone Therapy | tamoxiphen | SD | ||
| PEX6 | deletion | Frame_Shift_Del | novel | c.2258delN | p.Leu753ArgfsTer5 | p.L753Rfs*5 | Q13608 | protein_coding | TCGA-EW-A2FV-01 | Breast | breast invasive carcinoma | Female | <65 | III/IV | Chemotherapy | docetaxel | SD | ||
| PEX6 | SNV | Missense_Mutation | novel | c.958G>C | p.Glu320Gln | p.E320Q | Q13608 | protein_coding | deleterious(0.02) | benign(0.159) | TCGA-C5-A3HD-01 | Cervix | cervical & endocervical cancer | Female | <65 | I/II | Chemotherapy | cisplatin | SD |
| PEX6 | SNV | Missense_Mutation | c.1752N>C | p.Gln584His | p.Q584H | Q13608 | protein_coding | tolerated(0.55) | benign(0.011) | TCGA-C5-A7UC-01 | Cervix | cervical & endocervical cancer | Female | <65 | I/II | Unknown | Unknown | SD | |
| PEX6 | SNV | Missense_Mutation | c.1504N>A | p.Glu502Lys | p.E502K | Q13608 | protein_coding | deleterious(0) | benign(0.049) | TCGA-EK-A2R8-01 | Cervix | cervical & endocervical cancer | Female | <65 | I/II | Unknown | Unknown | SD | |
| PEX6 | SNV | Missense_Mutation | rs780239941 | c.1817N>A | p.Arg606Gln | p.R606Q | Q13608 | protein_coding | tolerated(0.88) | benign(0) | TCGA-EK-A2RK-01 | Cervix | cervical & endocervical cancer | Female | >=65 | I/II | Unknown | Unknown | SD |
| Page: 1 2 3 4 5 6 |
Top |
Related drugs of malignant transformation related genes |
| Identification of chemicals and drugs interact with genes involved in malignant transfromation |
| (DGIdb 4.0) |
| Entrez ID | Symbol | Category | Interaction Types | Drug Claim Name | Drug Name | PMIDs |
| Page: 1 |

Copyright 2023-Present -The University of Texas Health Science Center at Houston |