
|
|||||
|
 | |
| |
| |
| |
| |
| |
|
Gene: PEX5 |
Gene summary for PEX5 |
| Gene information | Species | Human | Gene symbol | PEX5 | Gene ID | 5830 |
| Gene name | peroxisomal biogenesis factor 5 | |
| Gene Alias | PBD2A | |
| Cytomap | 12p13.31 | |
| Gene Type | protein-coding | GO ID | GO:0006605 | UniProtAcc | A0A0S2Z480 |
Top |
Malignant transformation analysis |
| Identification of the aberrant gene expression in precancerous and cancerous lesions by comparing the gene expression of stem-like cells in diseased tissues with normal stem cells |
| Entrez ID | Symbol | Replicates | Species | Organ | Tissue | Adj P-value | Log2FC | Malignancy |
| 5830 | PEX5 | LZE8T | Human | Esophagus | ESCC | 1.31e-03 | 1.75e-01 | 0.067 |
| 5830 | PEX5 | LZE24T | Human | Esophagus | ESCC | 1.18e-07 | 1.63e-01 | 0.0596 |
| 5830 | PEX5 | P2T-E | Human | Esophagus | ESCC | 3.00e-18 | 3.60e-01 | 0.1177 |
| 5830 | PEX5 | P4T-E | Human | Esophagus | ESCC | 3.29e-11 | 2.82e-01 | 0.1323 |
| 5830 | PEX5 | P5T-E | Human | Esophagus | ESCC | 3.24e-02 | 5.40e-02 | 0.1327 |
| 5830 | PEX5 | P8T-E | Human | Esophagus | ESCC | 3.31e-12 | 1.63e-01 | 0.0889 |
| 5830 | PEX5 | P9T-E | Human | Esophagus | ESCC | 6.53e-07 | 4.55e-02 | 0.1131 |
| 5830 | PEX5 | P10T-E | Human | Esophagus | ESCC | 1.99e-08 | 1.36e-01 | 0.116 |
| 5830 | PEX5 | P11T-E | Human | Esophagus | ESCC | 7.42e-05 | 1.38e-01 | 0.1426 |
| 5830 | PEX5 | P12T-E | Human | Esophagus | ESCC | 1.77e-17 | 4.20e-01 | 0.1122 |
| 5830 | PEX5 | P15T-E | Human | Esophagus | ESCC | 1.33e-05 | 1.56e-01 | 0.1149 |
| 5830 | PEX5 | P16T-E | Human | Esophagus | ESCC | 3.31e-49 | 1.09e+00 | 0.1153 |
| 5830 | PEX5 | P20T-E | Human | Esophagus | ESCC | 3.85e-05 | 1.69e-01 | 0.1124 |
| 5830 | PEX5 | P21T-E | Human | Esophagus | ESCC | 2.17e-05 | 1.28e-01 | 0.1617 |
| 5830 | PEX5 | P22T-E | Human | Esophagus | ESCC | 3.23e-21 | 4.70e-01 | 0.1236 |
| 5830 | PEX5 | P23T-E | Human | Esophagus | ESCC | 1.26e-15 | 2.07e-01 | 0.108 |
| 5830 | PEX5 | P24T-E | Human | Esophagus | ESCC | 1.11e-09 | 2.80e-01 | 0.1287 |
| 5830 | PEX5 | P26T-E | Human | Esophagus | ESCC | 1.22e-19 | 2.35e-01 | 0.1276 |
| 5830 | PEX5 | P27T-E | Human | Esophagus | ESCC | 4.57e-20 | 2.70e-01 | 0.1055 |
| 5830 | PEX5 | P28T-E | Human | Esophagus | ESCC | 3.62e-10 | 1.87e-01 | 0.1149 |
| Page: 1 2 3 4 |
| Tissue | Expression Dynamics | Abbreviation |
| Esophagus | 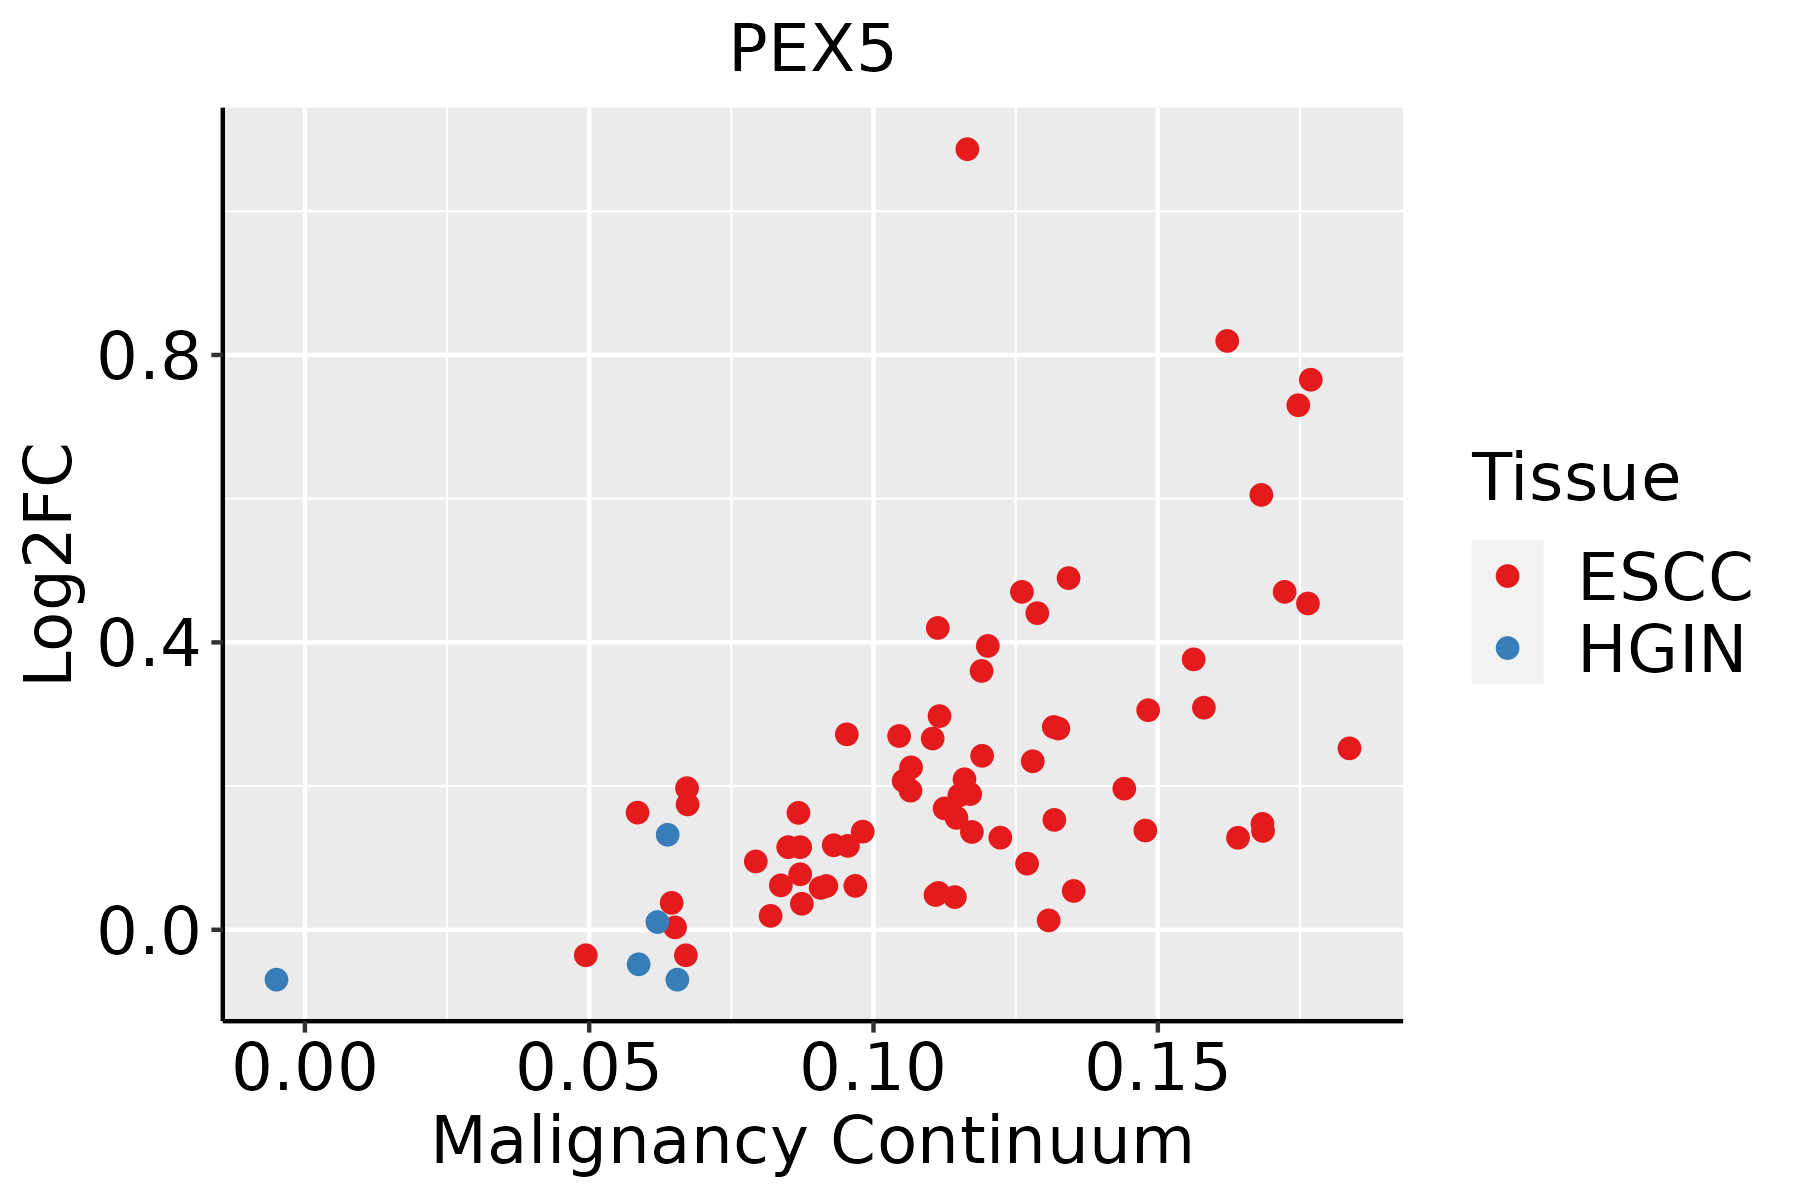 | ESCC: Esophageal squamous cell carcinoma |
| HGIN: High-grade intraepithelial neoplasias | ||
| LGIN: Low-grade intraepithelial neoplasias | ||
| Liver |  | HCC: Hepatocellular carcinoma |
| NAFLD: Non-alcoholic fatty liver disease | ||
| Oral Cavity |  | EOLP: Erosive Oral lichen planus |
| LP: leukoplakia | ||
| NEOLP: Non-erosive oral lichen planus | ||
| OSCC: Oral squamous cell carcinoma |
| ∗log2FC in expression of this searched gene in stem-like cells from each diseased tissue sample relative to stem-like cells in normal samples in each tissue plotted against the malignancy continuum. Samples are colored based on if they are from different disease stage. |
Top |
Malignant transformation related pathway analysis |
| Find out the enriched GO biological processes and KEGG pathways involved in transition from healthy to precancer to cancer |
| Tissue | Disease Stage | Enriched GO biological Processes |
| Colorectum | AD |  |
| Colorectum | SER |  |
| Colorectum | MSS |  |
| Colorectum | MSI-H |  |
| Colorectum | FAP |  |
| ∗Top 15 enriched GO BP terms are showed in the bar plot of each disease state in each tissue. Each row represents a significant GO biological process which is colored according to the -log10(p.adjust). |
| Page: 1 2 3 4 5 6 7 8 9 |
| GO ID | Tissue | Disease Stage | Description | Gene Ratio | Bg Ratio | pvalue | p.adjust | Count |
| GO:0072594110 | Esophagus | ESCC | establishment of protein localization to organelle | 311/8552 | 422/18723 | 3.02e-32 | 2.13e-29 | 311 |
| GO:0006605111 | Esophagus | ESCC | protein targeting | 229/8552 | 314/18723 | 4.93e-23 | 1.01e-20 | 229 |
| GO:0043254111 | Esophagus | ESCC | regulation of protein-containing complex assembly | 278/8552 | 428/18723 | 3.81e-16 | 2.77e-14 | 278 |
| GO:0090150110 | Esophagus | ESCC | establishment of protein localization to membrane | 182/8552 | 260/18723 | 1.27e-15 | 8.19e-14 | 182 |
| GO:001703818 | Esophagus | ESCC | protein import | 149/8552 | 206/18723 | 5.90e-15 | 3.31e-13 | 149 |
| GO:00718069 | Esophagus | ESCC | protein transmembrane transport | 47/8552 | 59/18723 | 9.02e-08 | 1.51e-06 | 47 |
| GO:00650026 | Esophagus | ESCC | intracellular protein transmembrane transport | 40/8552 | 51/18723 | 1.76e-06 | 2.08e-05 | 40 |
| GO:00447433 | Esophagus | ESCC | protein transmembrane import into intracellular organelle | 29/8552 | 36/18723 | 1.91e-05 | 1.67e-04 | 29 |
| GO:00066124 | Esophagus | ESCC | protein targeting to membrane | 83/8552 | 131/18723 | 3.31e-05 | 2.73e-04 | 83 |
| GO:0031333110 | Esophagus | ESCC | negative regulation of protein-containing complex assembly | 86/8552 | 141/18723 | 1.74e-04 | 1.14e-03 | 86 |
| GO:00066252 | Esophagus | ESCC | protein targeting to peroxisome | 14/8552 | 18/18723 | 5.77e-03 | 2.14e-02 | 14 |
| GO:00726622 | Esophagus | ESCC | protein localization to peroxisome | 14/8552 | 18/18723 | 5.77e-03 | 2.14e-02 | 14 |
| GO:00726632 | Esophagus | ESCC | establishment of protein localization to peroxisome | 14/8552 | 18/18723 | 5.77e-03 | 2.14e-02 | 14 |
| GO:00435742 | Esophagus | ESCC | peroxisomal transport | 16/8552 | 22/18723 | 9.46e-03 | 3.28e-02 | 16 |
| GO:007259422 | Liver | HCC | establishment of protein localization to organelle | 299/7958 | 422/18723 | 1.06e-32 | 6.10e-30 | 299 |
| GO:000660512 | Liver | HCC | protein targeting | 219/7958 | 314/18723 | 7.74e-23 | 1.49e-20 | 219 |
| GO:004325422 | Liver | HCC | regulation of protein-containing complex assembly | 264/7958 | 428/18723 | 5.47e-16 | 4.39e-14 | 264 |
| GO:001703811 | Liver | HCC | protein import | 140/7958 | 206/18723 | 1.12e-13 | 6.46e-12 | 140 |
| GO:009015012 | Liver | HCC | establishment of protein localization to membrane | 168/7958 | 260/18723 | 4.07e-13 | 2.13e-11 | 168 |
| GO:007180611 | Liver | HCC | protein transmembrane transport | 47/7958 | 59/18723 | 5.82e-09 | 1.51e-07 | 47 |
| Page: 1 2 3 |
| Pathway ID | Tissue | Disease Stage | Description | Gene Ratio | Bg Ratio | pvalue | p.adjust | qvalue | Count |
| hsa041467 | Esophagus | ESCC | Peroxisome | 55/4205 | 82/8465 | 1.04e-03 | 3.27e-03 | 1.68e-03 | 55 |
| hsa0414612 | Esophagus | ESCC | Peroxisome | 55/4205 | 82/8465 | 1.04e-03 | 3.27e-03 | 1.68e-03 | 55 |
| hsa041464 | Liver | HCC | Peroxisome | 58/4020 | 82/8465 | 1.57e-05 | 1.05e-04 | 5.85e-05 | 58 |
| hsa041465 | Liver | HCC | Peroxisome | 58/4020 | 82/8465 | 1.57e-05 | 1.05e-04 | 5.85e-05 | 58 |
| hsa041466 | Oral cavity | OSCC | Peroxisome | 47/3704 | 82/8465 | 9.01e-03 | 2.01e-02 | 1.03e-02 | 47 |
| hsa0414611 | Oral cavity | OSCC | Peroxisome | 47/3704 | 82/8465 | 9.01e-03 | 2.01e-02 | 1.03e-02 | 47 |
| Page: 1 |
Top |
Cell-cell communication analysis |
| Identification of potential cell-cell interactions between two cell types and their ligand-receptor pairs for different disease states |
| Ligand | Receptor | LRpair | Pathway | Tissue | Disease Stage |
| Page: 1 |
Top |
Single-cell gene regulatory network inference analysis |
| Find out the significant the regulons (TFs) and the target genes of each regulon across cell types for different disease states |
| TF | Cell Type | Tissue | Disease Stage | Target Gene | RSS | Regulon Activity |
| ∗The dot plots of a searched regulon are shown for all cell subpopulations in each disease state of each tissue based on the regulon specific score inferred using pySCENIC and by calculating the average expression. |
| Page: 1 |
Top |
Somatic mutation of malignant transformation related genes |
| Annotation of somatic variants for genes involved in malignant transformation |
| Hugo Symbol | Variant Class | Variant Classification | dbSNP RS | HGVSc | HGVSp | HGVSp Short | SWISSPROT | BIOTYPE | SIFT | PolyPhen | Tumor Sample Barcode | Tissue | Histology | Sex | Age | Stage | Therapy Types | Drugs | Outcome |
| PEX5 | SNV | Missense_Mutation | rs767347186 | c.733G>A | p.Glu245Lys | p.E245K | protein_coding | deleterious(0.02) | benign(0.27) | TCGA-5L-AAT1-01 | Breast | breast invasive carcinoma | Female | <65 | III/IV | Hormone Therapy | letrozol | SD | |
| PEX5 | SNV | Missense_Mutation | novel | c.625T>C | p.Tyr209His | p.Y209H | protein_coding | deleterious(0.03) | possibly_damaging(0.801) | TCGA-A2-A0D1-01 | Breast | breast invasive carcinoma | Female | >=65 | I/II | Chemotherapy | taxotere | SD | |
| PEX5 | deletion | Frame_Shift_Del | novel | c.664delN | p.Phe222LeufsTer16 | p.F222Lfs*16 | protein_coding | TCGA-D8-A27V-01 | Breast | breast invasive carcinoma | Female | <65 | I/II | Hormone Therapy | tamoxiphen | SD | |||
| PEX5 | SNV | Missense_Mutation | rs765907654 | c.1792N>A | p.Glu598Lys | p.E598K | protein_coding | deleterious(0) | probably_damaging(0.999) | TCGA-2W-A8YY-01 | Cervix | cervical & endocervical cancer | Female | <65 | I/II | Chemotherapy | cisplatin | CR | |
| PEX5 | SNV | Missense_Mutation | rs755747771 | c.973N>A | p.Glu325Lys | p.E325K | protein_coding | deleterious(0.04) | possibly_damaging(0.632) | TCGA-C5-A1BQ-01 | Cervix | cervical & endocervical cancer | Female | >=65 | III/IV | Chemotherapy | cisplatin | CR | |
| PEX5 | SNV | Missense_Mutation | novel | c.1777N>T | p.His593Tyr | p.H593Y | protein_coding | tolerated(0.46) | probably_damaging(0.998) | TCGA-C5-A7XC-01 | Cervix | cervical & endocervical cancer | Female | <65 | I/II | Unknown | Unknown | SD | |
| PEX5 | SNV | Missense_Mutation | c.1739N>A | p.Arg580His | p.R580H | protein_coding | deleterious(0) | possibly_damaging(0.866) | TCGA-AA-A00N-01 | Colorectum | colon adenocarcinoma | Male | >=65 | I/II | Unknown | Unknown | PD | ||
| PEX5 | SNV | Missense_Mutation | c.1711N>A | p.Glu571Lys | p.E571K | protein_coding | tolerated(0.14) | possibly_damaging(0.804) | TCGA-AA-A010-01 | Colorectum | colon adenocarcinoma | Female | <65 | I/II | Chemotherapy | folinic | CR | ||
| PEX5 | SNV | Missense_Mutation | c.964N>T | p.Arg322Trp | p.R322W | protein_coding | deleterious(0) | probably_damaging(0.999) | TCGA-AD-6895-01 | Colorectum | colon adenocarcinoma | Male | >=65 | III/IV | Unknown | Unknown | SD | ||
| PEX5 | SNV | Missense_Mutation | c.1705G>A | p.Ala569Thr | p.A569T | protein_coding | deleterious(0) | probably_damaging(0.999) | TCGA-AM-5821-01 | Colorectum | colon adenocarcinoma | Female | >=65 | I/II | Unknown | Unknown | SD |
| Page: 1 2 3 4 5 6 |
Top |
Related drugs of malignant transformation related genes |
| Identification of chemicals and drugs interact with genes involved in malignant transfromation |
| (DGIdb 4.0) |
| Entrez ID | Symbol | Category | Interaction Types | Drug Claim Name | Drug Name | PMIDs |
| Page: 1 |

Copyright 2023-Present -The University of Texas Health Science Center at Houston |