
|
|||||
|
 | |
| |
| |
| |
| |
| |
|
Gene: PEX19 |
Gene summary for PEX19 |
| Gene information | Species | Human | Gene symbol | PEX19 | Gene ID | 5824 |
| Gene name | peroxisomal biogenesis factor 19 | |
| Gene Alias | D1S2223E | |
| Cytomap | 1q23.2 | |
| Gene Type | protein-coding | GO ID | GO:0006457 | UniProtAcc | P40855 |
Top |
Malignant transformation analysis |
| Identification of the aberrant gene expression in precancerous and cancerous lesions by comparing the gene expression of stem-like cells in diseased tissues with normal stem cells |
| Entrez ID | Symbol | Replicates | Species | Organ | Tissue | Adj P-value | Log2FC | Malignancy |
| 5824 | PEX19 | LZE4T | Human | Esophagus | ESCC | 6.12e-11 | 3.13e-01 | 0.0811 |
| 5824 | PEX19 | LZE7T | Human | Esophagus | ESCC | 2.63e-12 | 5.19e-01 | 0.0667 |
| 5824 | PEX19 | LZE20T | Human | Esophagus | ESCC | 3.93e-05 | 1.39e-01 | 0.0662 |
| 5824 | PEX19 | LZE24T | Human | Esophagus | ESCC | 1.45e-14 | 3.97e-01 | 0.0596 |
| 5824 | PEX19 | LZE6T | Human | Esophagus | ESCC | 5.89e-06 | 4.45e-01 | 0.0845 |
| 5824 | PEX19 | P1T-E | Human | Esophagus | ESCC | 5.94e-03 | 1.64e-01 | 0.0875 |
| 5824 | PEX19 | P2T-E | Human | Esophagus | ESCC | 1.18e-29 | 5.63e-01 | 0.1177 |
| 5824 | PEX19 | P4T-E | Human | Esophagus | ESCC | 2.50e-27 | 6.60e-01 | 0.1323 |
| 5824 | PEX19 | P5T-E | Human | Esophagus | ESCC | 9.55e-15 | 2.92e-01 | 0.1327 |
| 5824 | PEX19 | P8T-E | Human | Esophagus | ESCC | 2.13e-19 | 2.72e-01 | 0.0889 |
| 5824 | PEX19 | P9T-E | Human | Esophagus | ESCC | 3.70e-08 | 2.13e-01 | 0.1131 |
| 5824 | PEX19 | P10T-E | Human | Esophagus | ESCC | 7.06e-19 | 2.90e-01 | 0.116 |
| 5824 | PEX19 | P11T-E | Human | Esophagus | ESCC | 1.41e-12 | 4.68e-01 | 0.1426 |
| 5824 | PEX19 | P12T-E | Human | Esophagus | ESCC | 9.19e-17 | 3.10e-01 | 0.1122 |
| 5824 | PEX19 | P15T-E | Human | Esophagus | ESCC | 1.26e-23 | 5.07e-01 | 0.1149 |
| 5824 | PEX19 | P16T-E | Human | Esophagus | ESCC | 1.71e-18 | 3.57e-01 | 0.1153 |
| 5824 | PEX19 | P17T-E | Human | Esophagus | ESCC | 9.72e-08 | 2.85e-01 | 0.1278 |
| 5824 | PEX19 | P19T-E | Human | Esophagus | ESCC | 1.57e-02 | 4.04e-01 | 0.1662 |
| 5824 | PEX19 | P20T-E | Human | Esophagus | ESCC | 7.36e-22 | 4.10e-01 | 0.1124 |
| 5824 | PEX19 | P21T-E | Human | Esophagus | ESCC | 9.50e-29 | 5.29e-01 | 0.1617 |
| Page: 1 2 3 4 5 |
| Tissue | Expression Dynamics | Abbreviation |
| Esophagus | 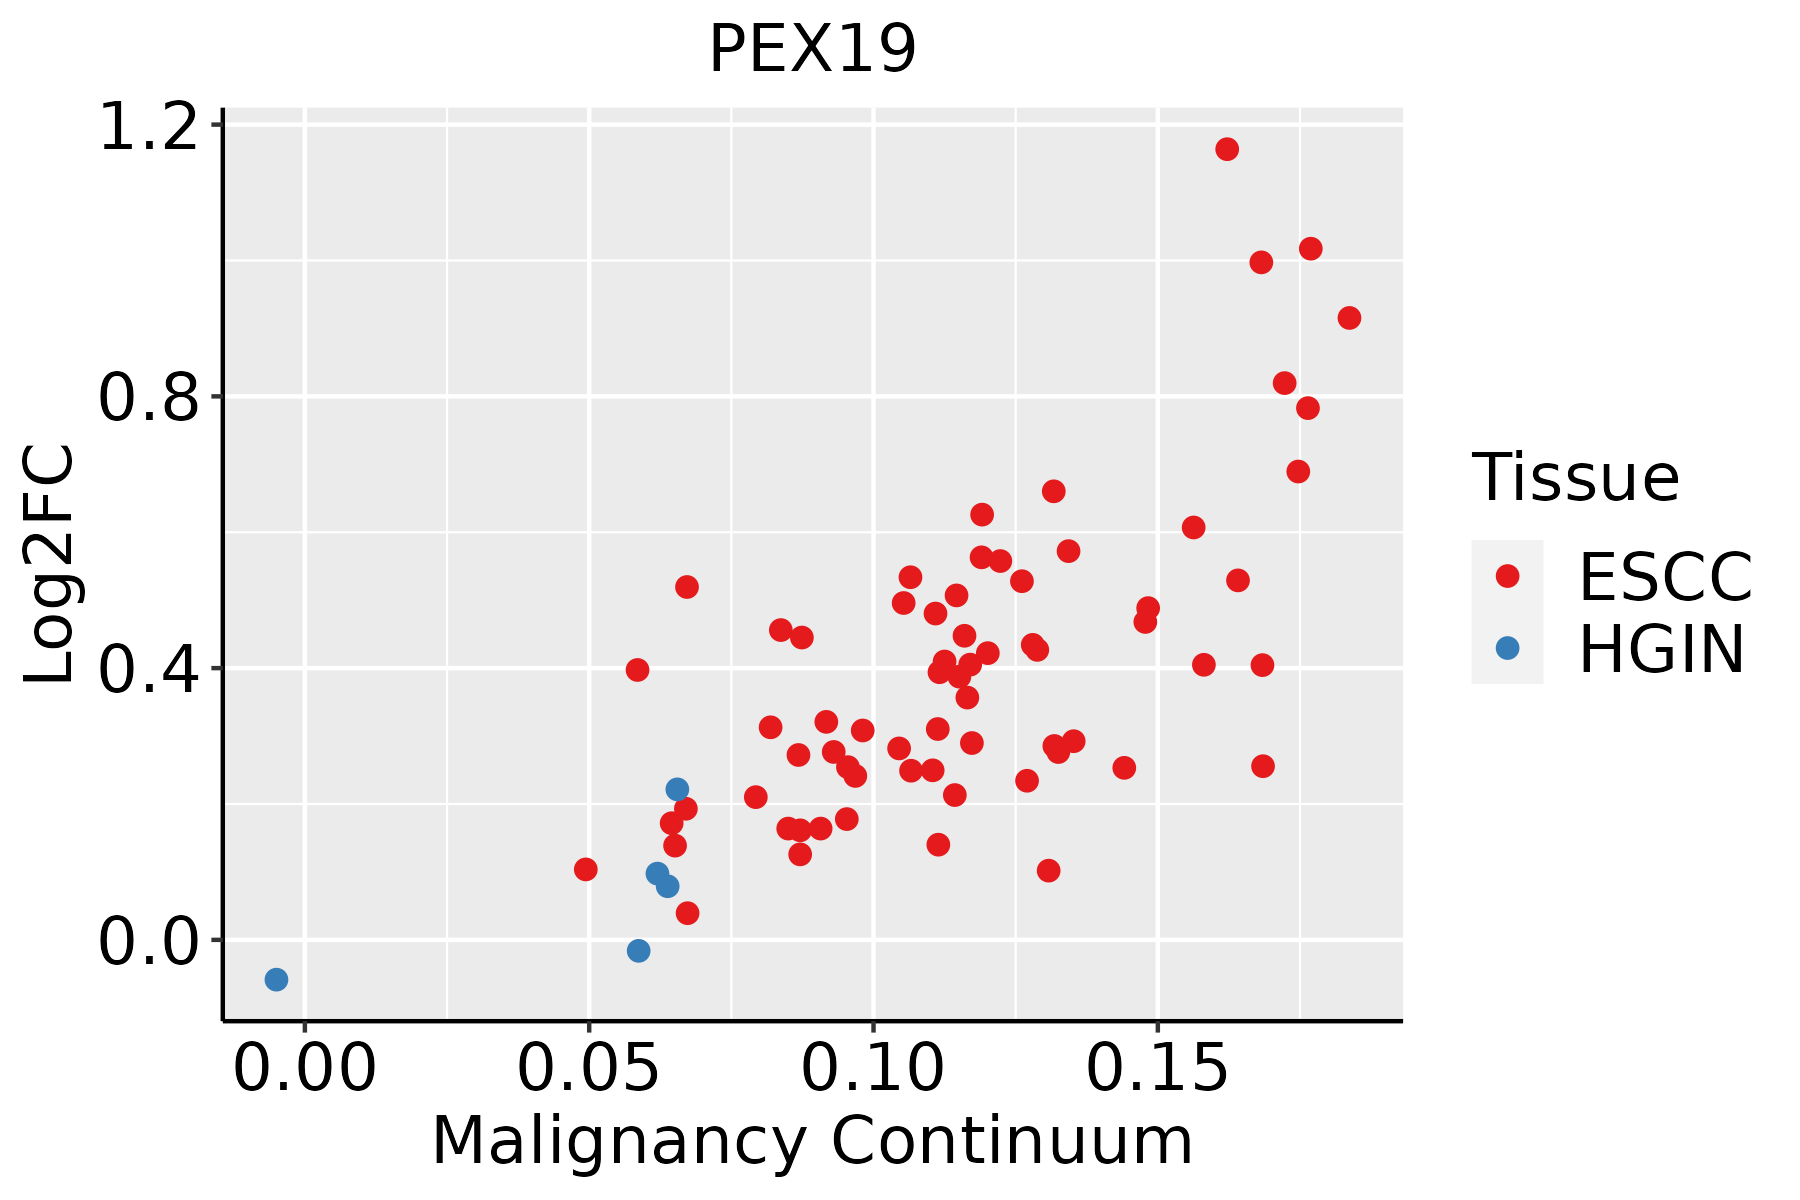 | ESCC: Esophageal squamous cell carcinoma |
| HGIN: High-grade intraepithelial neoplasias | ||
| LGIN: Low-grade intraepithelial neoplasias | ||
| Liver |  | HCC: Hepatocellular carcinoma |
| NAFLD: Non-alcoholic fatty liver disease | ||
| Oral Cavity |  | EOLP: Erosive Oral lichen planus |
| LP: leukoplakia | ||
| NEOLP: Non-erosive oral lichen planus | ||
| OSCC: Oral squamous cell carcinoma |
| ∗log2FC in expression of this searched gene in stem-like cells from each diseased tissue sample relative to stem-like cells in normal samples in each tissue plotted against the malignancy continuum. Samples are colored based on if they are from different disease stage. |
Top |
Malignant transformation related pathway analysis |
| Find out the enriched GO biological processes and KEGG pathways involved in transition from healthy to precancer to cancer |
| Tissue | Disease Stage | Enriched GO biological Processes |
| Colorectum | AD |  |
| Colorectum | SER |  |
| Colorectum | MSS |  |
| Colorectum | MSI-H |  |
| Colorectum | FAP |  |
| ∗Top 15 enriched GO BP terms are showed in the bar plot of each disease state in each tissue. Each row represents a significant GO biological process which is colored according to the -log10(p.adjust). |
| Page: 1 2 3 4 5 6 7 8 9 |
| GO ID | Tissue | Disease Stage | Description | Gene Ratio | Bg Ratio | pvalue | p.adjust | Count |
| GO:0072594110 | Esophagus | ESCC | establishment of protein localization to organelle | 311/8552 | 422/18723 | 3.02e-32 | 2.13e-29 | 311 |
| GO:0031647111 | Esophagus | ESCC | regulation of protein stability | 223/8552 | 298/18723 | 5.76e-25 | 1.52e-22 | 223 |
| GO:0006605111 | Esophagus | ESCC | protein targeting | 229/8552 | 314/18723 | 4.93e-23 | 1.01e-20 | 229 |
| GO:0006457110 | Esophagus | ESCC | protein folding | 163/8552 | 212/18723 | 1.13e-20 | 1.74e-18 | 163 |
| GO:0051098111 | Esophagus | ESCC | regulation of binding | 251/8552 | 363/18723 | 6.73e-20 | 8.46e-18 | 251 |
| GO:0090150110 | Esophagus | ESCC | establishment of protein localization to membrane | 182/8552 | 260/18723 | 1.27e-15 | 8.19e-14 | 182 |
| GO:001703818 | Esophagus | ESCC | protein import | 149/8552 | 206/18723 | 5.90e-15 | 3.31e-13 | 149 |
| GO:0050821111 | Esophagus | ESCC | protein stabilization | 140/8552 | 191/18723 | 6.50e-15 | 3.61e-13 | 140 |
| GO:00482853 | Esophagus | ESCC | organelle fission | 301/8552 | 488/18723 | 4.64e-13 | 2.12e-11 | 301 |
| GO:0061077110 | Esophagus | ESCC | chaperone-mediated protein folding | 56/8552 | 67/18723 | 1.52e-10 | 4.36e-09 | 56 |
| GO:0051100111 | Esophagus | ESCC | negative regulation of binding | 109/8552 | 162/18723 | 2.10e-08 | 4.03e-07 | 109 |
| GO:00066124 | Esophagus | ESCC | protein targeting to membrane | 83/8552 | 131/18723 | 3.31e-05 | 2.73e-04 | 83 |
| GO:00066252 | Esophagus | ESCC | protein targeting to peroxisome | 14/8552 | 18/18723 | 5.77e-03 | 2.14e-02 | 14 |
| GO:00726622 | Esophagus | ESCC | protein localization to peroxisome | 14/8552 | 18/18723 | 5.77e-03 | 2.14e-02 | 14 |
| GO:00726632 | Esophagus | ESCC | establishment of protein localization to peroxisome | 14/8552 | 18/18723 | 5.77e-03 | 2.14e-02 | 14 |
| GO:00435742 | Esophagus | ESCC | peroxisomal transport | 16/8552 | 22/18723 | 9.46e-03 | 3.28e-02 | 16 |
| GO:00064577 | Liver | Cirrhotic | protein folding | 114/4634 | 212/18723 | 9.23e-20 | 2.31e-17 | 114 |
| GO:007259412 | Liver | Cirrhotic | establishment of protein localization to organelle | 189/4634 | 422/18723 | 1.01e-19 | 2.45e-17 | 189 |
| GO:003164712 | Liver | Cirrhotic | regulation of protein stability | 144/4634 | 298/18723 | 6.74e-19 | 1.28e-16 | 144 |
| GO:00066057 | Liver | Cirrhotic | protein targeting | 148/4634 | 314/18723 | 3.86e-18 | 6.20e-16 | 148 |
| Page: 1 2 3 |
| Pathway ID | Tissue | Disease Stage | Description | Gene Ratio | Bg Ratio | pvalue | p.adjust | qvalue | Count |
| hsa041467 | Esophagus | ESCC | Peroxisome | 55/4205 | 82/8465 | 1.04e-03 | 3.27e-03 | 1.68e-03 | 55 |
| hsa0414612 | Esophagus | ESCC | Peroxisome | 55/4205 | 82/8465 | 1.04e-03 | 3.27e-03 | 1.68e-03 | 55 |
| hsa041462 | Liver | Cirrhotic | Peroxisome | 36/2530 | 82/8465 | 4.79e-03 | 1.74e-02 | 1.07e-02 | 36 |
| hsa041463 | Liver | Cirrhotic | Peroxisome | 36/2530 | 82/8465 | 4.79e-03 | 1.74e-02 | 1.07e-02 | 36 |
| hsa041464 | Liver | HCC | Peroxisome | 58/4020 | 82/8465 | 1.57e-05 | 1.05e-04 | 5.85e-05 | 58 |
| hsa041465 | Liver | HCC | Peroxisome | 58/4020 | 82/8465 | 1.57e-05 | 1.05e-04 | 5.85e-05 | 58 |
| hsa041466 | Oral cavity | OSCC | Peroxisome | 47/3704 | 82/8465 | 9.01e-03 | 2.01e-02 | 1.03e-02 | 47 |
| hsa0414611 | Oral cavity | OSCC | Peroxisome | 47/3704 | 82/8465 | 9.01e-03 | 2.01e-02 | 1.03e-02 | 47 |
| Page: 1 |
Top |
Cell-cell communication analysis |
| Identification of potential cell-cell interactions between two cell types and their ligand-receptor pairs for different disease states |
| Ligand | Receptor | LRpair | Pathway | Tissue | Disease Stage |
| Page: 1 |
Top |
Single-cell gene regulatory network inference analysis |
| Find out the significant the regulons (TFs) and the target genes of each regulon across cell types for different disease states |
| TF | Cell Type | Tissue | Disease Stage | Target Gene | RSS | Regulon Activity |
| ∗The dot plots of a searched regulon are shown for all cell subpopulations in each disease state of each tissue based on the regulon specific score inferred using pySCENIC and by calculating the average expression. |
| Page: 1 |
Top |
Somatic mutation of malignant transformation related genes |
| Annotation of somatic variants for genes involved in malignant transformation |
| Hugo Symbol | Variant Class | Variant Classification | dbSNP RS | HGVSc | HGVSp | HGVSp Short | SWISSPROT | BIOTYPE | SIFT | PolyPhen | Tumor Sample Barcode | Tissue | Histology | Sex | Age | Stage | Therapy Types | Drugs | Outcome |
| PEX19 | SNV | Missense_Mutation | c.526C>G | p.Gln176Glu | p.Q176E | P40855 | protein_coding | tolerated(0.09) | possibly_damaging(0.83) | TCGA-AO-A0J3-01 | Breast | breast invasive carcinoma | Female | >=65 | I/II | Chemotherapy | cyclophosphamide | SD | |
| PEX19 | SNV | Missense_Mutation | c.463N>G | p.Lys155Glu | p.K155E | P40855 | protein_coding | deleterious(0.01) | possibly_damaging(0.764) | TCGA-AO-A0JE-01 | Breast | breast invasive carcinoma | Female | <65 | III/IV | Chemotherapy | doxorubicin | SD | |
| PEX19 | SNV | Missense_Mutation | novel | c.280N>G | p.Leu94Val | p.L94V | P40855 | protein_coding | tolerated(0.09) | probably_damaging(0.953) | TCGA-D8-A1JP-01 | Breast | breast invasive carcinoma | Female | >=65 | I/II | Hormone Therapy | tamoxiphen | SD |
| PEX19 | SNV | Missense_Mutation | rs868021380 | c.37N>A | p.Glu13Lys | p.E13K | P40855 | protein_coding | tolerated_low_confidence(0.33) | benign(0.024) | TCGA-MY-A5BF-01 | Cervix | cervical & endocervical cancer | Female | >=65 | I/II | Chemotherapy | cisplatin | CR |
| PEX19 | SNV | Missense_Mutation | c.698N>T | p.Glu233Val | p.E233V | P40855 | protein_coding | deleterious(0) | probably_damaging(0.983) | TCGA-AZ-6608-01 | Colorectum | colon adenocarcinoma | Female | <65 | III/IV | Unknown | Unknown | SD | |
| PEX19 | SNV | Missense_Mutation | rs749320010 | c.651A>C | p.Lys217Asn | p.K217N | P40855 | protein_coding | deleterious(0.01) | benign(0.19) | TCGA-AG-3892-01 | Colorectum | rectum adenocarcinoma | Female | <65 | I/II | Unknown | Unknown | SD |
| PEX19 | SNV | Missense_Mutation | rs149976198 | c.857N>T | p.Ser286Leu | p.S286L | P40855 | protein_coding | deleterious(0.02) | benign(0.143) | TCGA-AP-A1DV-01 | Endometrium | uterine corpus endometrioid carcinoma | Female | <65 | I/II | Unknown | Unknown | SD |
| PEX19 | SNV | Missense_Mutation | rs560911616 | c.20G>A | p.Gly7Asp | p.G7D | P40855 | protein_coding | tolerated_low_confidence(1) | benign(0) | TCGA-B5-A11E-01 | Endometrium | uterine corpus endometrioid carcinoma | Female | <65 | I/II | Unknown | Unknown | SD |
| PEX19 | SNV | Missense_Mutation | c.614G>T | p.Ser205Ile | p.S205I | P40855 | protein_coding | tolerated(0.17) | benign(0.022) | TCGA-B5-A1MX-01 | Endometrium | uterine corpus endometrioid carcinoma | Female | <65 | I/II | Hormone Therapy | megace | SD | |
| PEX19 | SNV | Missense_Mutation | c.649N>C | p.Lys217Gln | p.K217Q | P40855 | protein_coding | deleterious(0.01) | benign(0.388) | TCGA-BS-A0UJ-01 | Endometrium | uterine corpus endometrioid carcinoma | Female | >=65 | I/II | Unknown | Unknown | SD |
| Page: 1 2 3 |
Top |
Related drugs of malignant transformation related genes |
| Identification of chemicals and drugs interact with genes involved in malignant transfromation |
| (DGIdb 4.0) |
| Entrez ID | Symbol | Category | Interaction Types | Drug Claim Name | Drug Name | PMIDs |
| Page: 1 |

Copyright 2023-Present -The University of Texas Health Science Center at Houston |