
|
|||||
|
 | |
| |
| |
| |
| |
| |
|
Gene: PEX14 |
Gene summary for PEX14 |
| Gene information | Species | Human | Gene symbol | PEX14 | Gene ID | 5195 |
| Gene name | peroxisomal biogenesis factor 14 | |
| Gene Alias | NAPP2 | |
| Cytomap | 1p36.22 | |
| Gene Type | protein-coding | GO ID | GO:0000226 | UniProtAcc | O75381 |
Top |
Malignant transformation analysis |
| Identification of the aberrant gene expression in precancerous and cancerous lesions by comparing the gene expression of stem-like cells in diseased tissues with normal stem cells |
| Entrez ID | Symbol | Replicates | Species | Organ | Tissue | Adj P-value | Log2FC | Malignancy |
| 5195 | PEX14 | CCI_1 | Human | Cervix | CC | 8.68e-08 | 6.24e-01 | 0.528 |
| 5195 | PEX14 | CCI_2 | Human | Cervix | CC | 8.16e-13 | 1.12e+00 | 0.5249 |
| 5195 | PEX14 | CCI_3 | Human | Cervix | CC | 1.84e-13 | 7.37e-01 | 0.516 |
| 5195 | PEX14 | HTA11_3410_2000001011 | Human | Colorectum | AD | 9.74e-08 | -3.70e-01 | 0.0155 |
| 5195 | PEX14 | HTA11_2487_2000001011 | Human | Colorectum | SER | 8.66e-03 | -3.61e-01 | -0.1808 |
| 5195 | PEX14 | HTA11_866_3004761011 | Human | Colorectum | AD | 7.67e-03 | -2.56e-01 | 0.096 |
| 5195 | PEX14 | HTA11_99999970781_79442 | Human | Colorectum | MSS | 1.39e-06 | -3.45e-01 | 0.294 |
| 5195 | PEX14 | HTA11_99999974143_84620 | Human | Colorectum | MSS | 4.03e-05 | -3.01e-01 | 0.3005 |
| 5195 | PEX14 | F007 | Human | Colorectum | FAP | 1.43e-03 | -3.70e-01 | 0.1176 |
| 5195 | PEX14 | A001-C-207 | Human | Colorectum | FAP | 2.69e-04 | -3.07e-01 | 0.1278 |
| 5195 | PEX14 | A015-C-203 | Human | Colorectum | FAP | 4.14e-23 | -4.71e-01 | -0.1294 |
| 5195 | PEX14 | A015-C-204 | Human | Colorectum | FAP | 5.05e-07 | -3.69e-01 | -0.0228 |
| 5195 | PEX14 | A014-C-040 | Human | Colorectum | FAP | 6.05e-04 | -3.44e-01 | -0.1184 |
| 5195 | PEX14 | A002-C-201 | Human | Colorectum | FAP | 1.38e-15 | -3.94e-01 | 0.0324 |
| 5195 | PEX14 | A002-C-203 | Human | Colorectum | FAP | 2.24e-03 | -2.62e-01 | 0.2786 |
| 5195 | PEX14 | A001-C-119 | Human | Colorectum | FAP | 1.27e-08 | -4.07e-01 | -0.1557 |
| 5195 | PEX14 | A001-C-108 | Human | Colorectum | FAP | 1.05e-15 | -4.04e-01 | -0.0272 |
| 5195 | PEX14 | A002-C-205 | Human | Colorectum | FAP | 6.75e-21 | -4.83e-01 | -0.1236 |
| 5195 | PEX14 | A001-C-104 | Human | Colorectum | FAP | 1.17e-04 | -3.70e-01 | 0.0184 |
| 5195 | PEX14 | A015-C-005 | Human | Colorectum | FAP | 8.44e-09 | -3.86e-01 | -0.0336 |
| Page: 1 2 3 4 5 6 |
| Tissue | Expression Dynamics | Abbreviation |
| Cervix |  | CC: Cervix cancer |
| HSIL_HPV: HPV-infected high-grade squamous intraepithelial lesions | ||
| N_HPV: HPV-infected normal cervix | ||
| Colorectum (GSE201348) |  | FAP: Familial adenomatous polyposis |
| CRC: Colorectal cancer | ||
| Colorectum (HTA11) |  | AD: Adenomas |
| SER: Sessile serrated lesions | ||
| MSI-H: Microsatellite-high colorectal cancer | ||
| MSS: Microsatellite stable colorectal cancer | ||
| Endometrium | 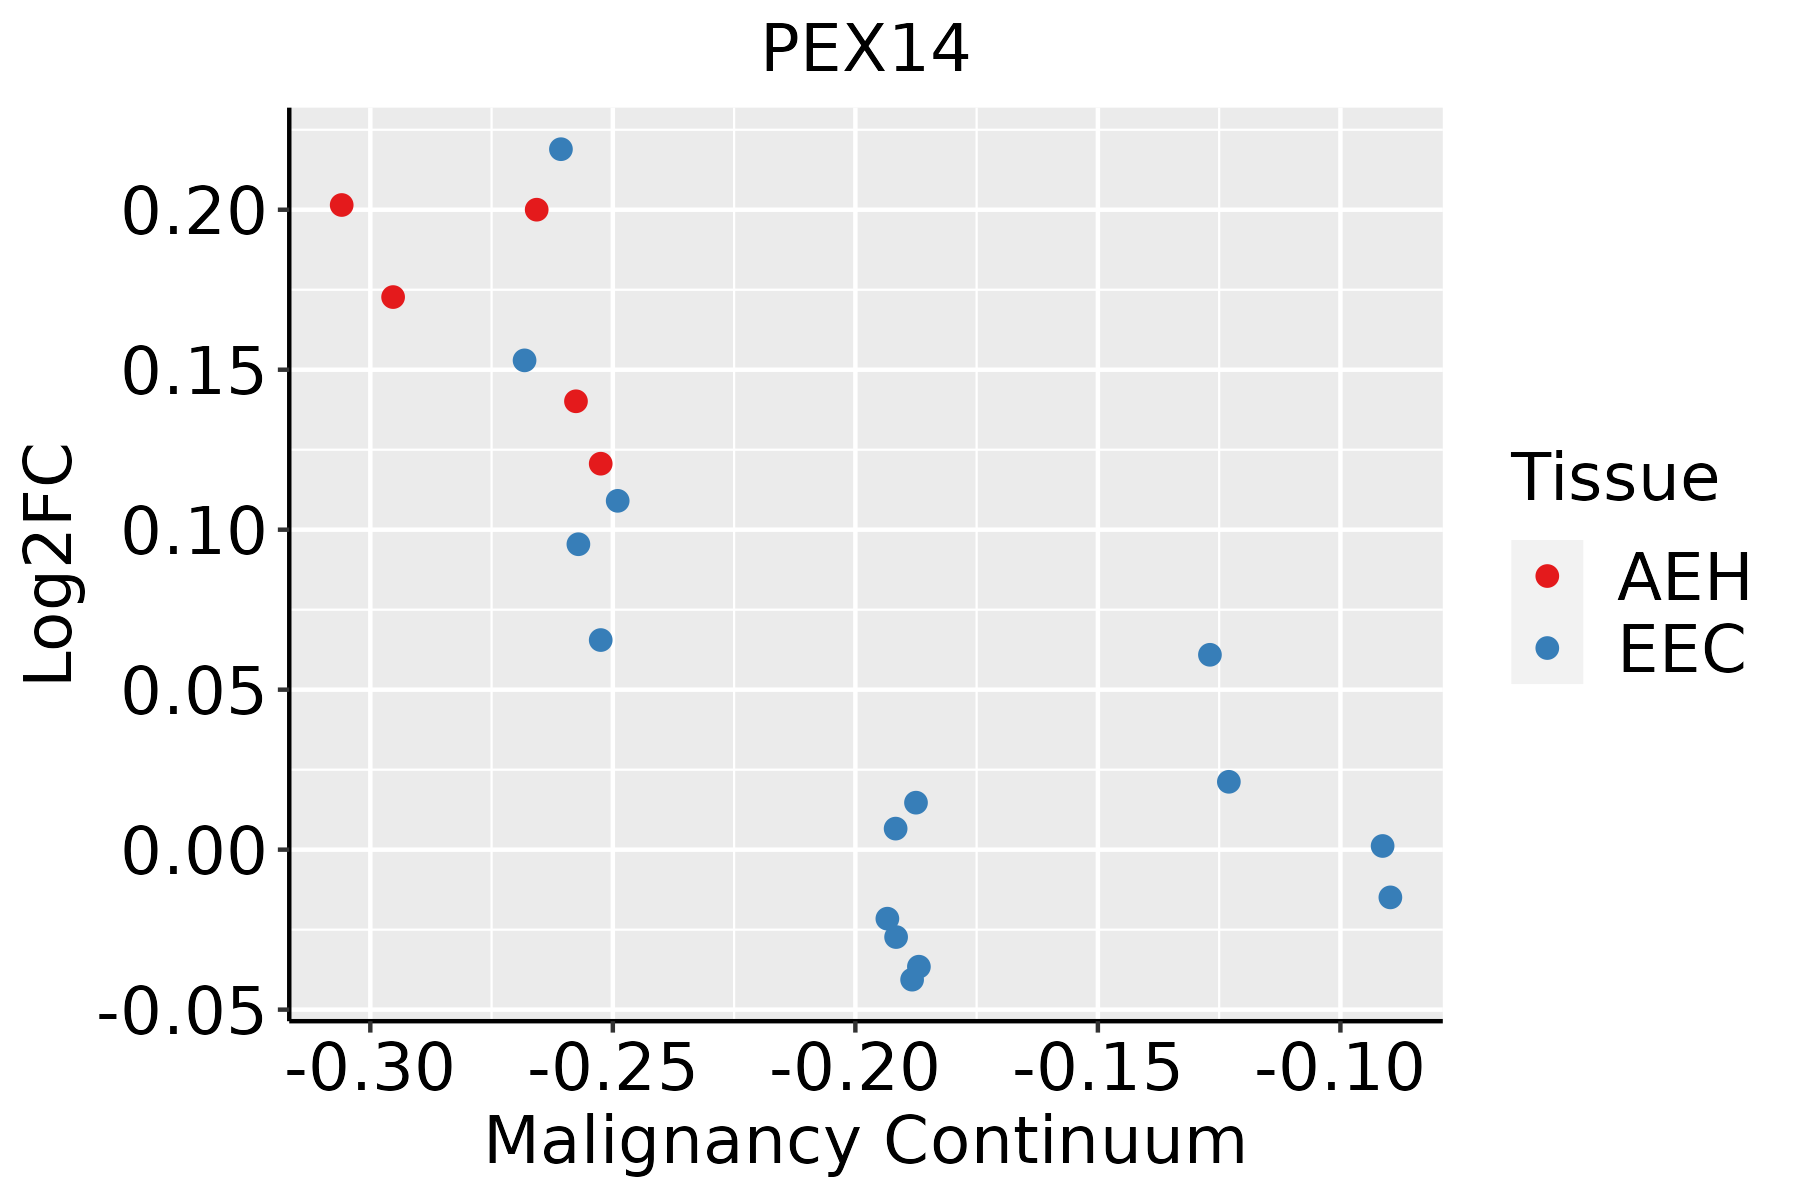 | AEH: Atypical endometrial hyperplasia |
| EEC: Endometrioid Cancer | ||
| Esophagus |  | ESCC: Esophageal squamous cell carcinoma |
| HGIN: High-grade intraepithelial neoplasias | ||
| LGIN: Low-grade intraepithelial neoplasias | ||
| Oral Cavity | 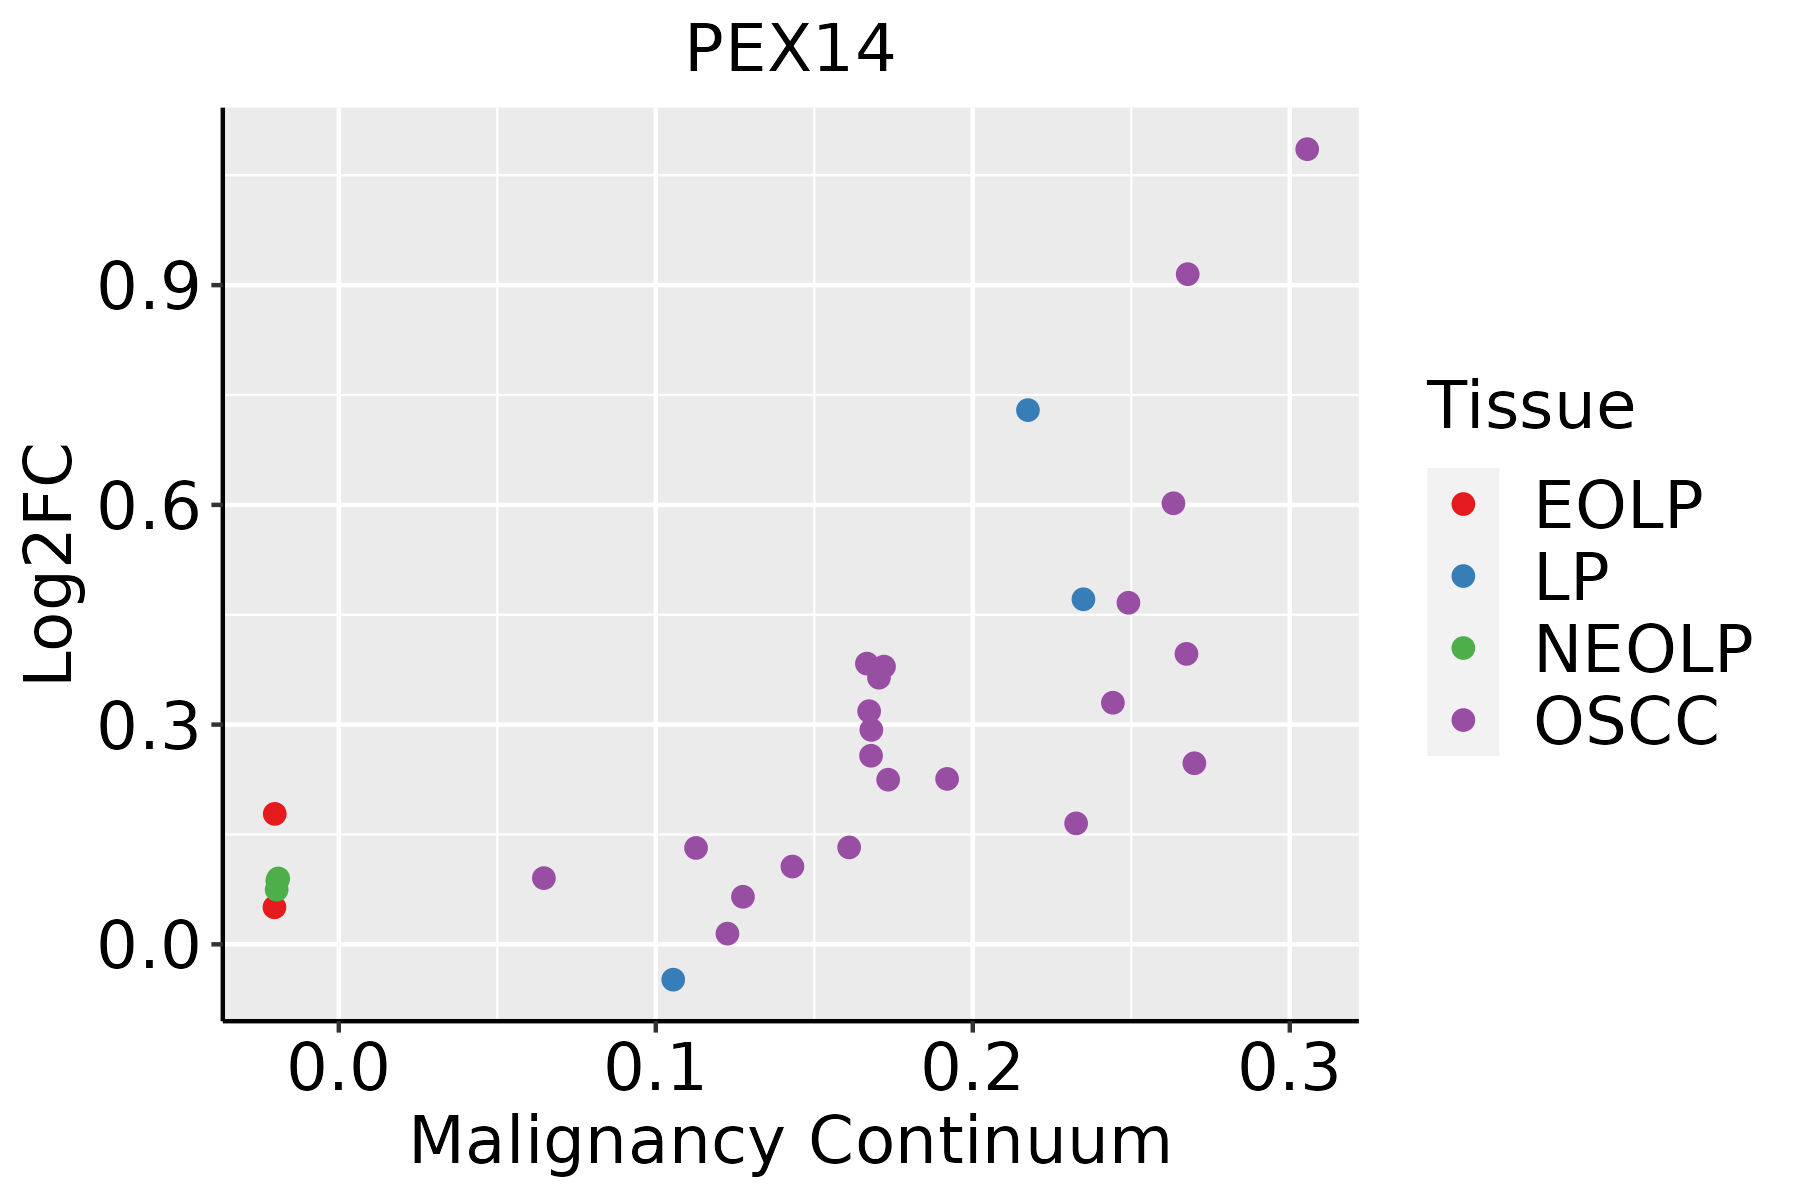 | EOLP: Erosive Oral lichen planus |
| LP: leukoplakia | ||
| NEOLP: Non-erosive oral lichen planus | ||
| OSCC: Oral squamous cell carcinoma |
| ∗log2FC in expression of this searched gene in stem-like cells from each diseased tissue sample relative to stem-like cells in normal samples in each tissue plotted against the malignancy continuum. Samples are colored based on if they are from different disease stage. |
Top |
Malignant transformation related pathway analysis |
| Find out the enriched GO biological processes and KEGG pathways involved in transition from healthy to precancer to cancer |
| Tissue | Disease Stage | Enriched GO biological Processes |
| Colorectum | AD |  |
| Colorectum | SER |  |
| Colorectum | MSS |  |
| Colorectum | MSI-H |  |
| Colorectum | FAP |  |
| ∗Top 15 enriched GO BP terms are showed in the bar plot of each disease state in each tissue. Each row represents a significant GO biological process which is colored according to the -log10(p.adjust). |
| Page: 1 2 3 4 5 6 7 8 9 |
| GO ID | Tissue | Disease Stage | Description | Gene Ratio | Bg Ratio | pvalue | p.adjust | Count |
| GO:00725949 | Cervix | CC | establishment of protein localization to organelle | 99/2311 | 422/18723 | 1.23e-10 | 2.11e-08 | 99 |
| GO:005109810 | Cervix | CC | regulation of binding | 80/2311 | 363/18723 | 1.32e-07 | 6.42e-06 | 80 |
| GO:000660510 | Cervix | CC | protein targeting | 68/2311 | 314/18723 | 2.17e-06 | 6.55e-05 | 68 |
| GO:00510904 | Cervix | CC | regulation of DNA-binding transcription factor activity | 87/2311 | 440/18723 | 4.85e-06 | 1.22e-04 | 87 |
| GO:00170388 | Cervix | CC | protein import | 48/2311 | 206/18723 | 8.62e-06 | 1.98e-04 | 48 |
| GO:00516567 | Cervix | CC | establishment of organelle localization | 76/2311 | 390/18723 | 3.17e-05 | 5.21e-04 | 76 |
| GO:002241110 | Cervix | CC | cellular component disassembly | 83/2311 | 443/18723 | 6.04e-05 | 8.68e-04 | 83 |
| GO:00433939 | Cervix | CC | regulation of protein binding | 42/2311 | 196/18723 | 2.27e-04 | 2.55e-03 | 42 |
| GO:00307057 | Cervix | CC | cytoskeleton-dependent intracellular transport | 40/2311 | 195/18723 | 7.92e-04 | 6.99e-03 | 40 |
| GO:00511009 | Cervix | CC | negative regulation of binding | 34/2311 | 162/18723 | 1.25e-03 | 1.00e-02 | 34 |
| GO:00329847 | Cervix | CC | protein-containing complex disassembly | 41/2311 | 224/18723 | 6.13e-03 | 3.48e-02 | 41 |
| GO:00320916 | Cervix | CC | negative regulation of protein binding | 20/2311 | 94/18723 | 9.92e-03 | 4.86e-02 | 20 |
| GO:0072594 | Colorectum | AD | establishment of protein localization to organelle | 148/3918 | 422/18723 | 7.95e-12 | 1.04e-09 | 148 |
| GO:0051098 | Colorectum | AD | regulation of binding | 126/3918 | 363/18723 | 6.01e-10 | 4.88e-08 | 126 |
| GO:0022411 | Colorectum | AD | cellular component disassembly | 147/3918 | 443/18723 | 8.53e-10 | 6.76e-08 | 147 |
| GO:0051656 | Colorectum | AD | establishment of organelle localization | 131/3918 | 390/18723 | 3.00e-09 | 2.06e-07 | 131 |
| GO:0032984 | Colorectum | AD | protein-containing complex disassembly | 81/3918 | 224/18723 | 9.41e-08 | 4.65e-06 | 81 |
| GO:0006605 | Colorectum | AD | protein targeting | 105/3918 | 314/18723 | 1.39e-07 | 6.44e-06 | 105 |
| GO:0043393 | Colorectum | AD | regulation of protein binding | 68/3918 | 196/18723 | 5.17e-06 | 1.34e-04 | 68 |
| GO:0017038 | Colorectum | AD | protein import | 67/3918 | 206/18723 | 6.34e-05 | 1.05e-03 | 67 |
| Page: 1 2 3 4 5 6 7 8 9 10 |
| Pathway ID | Tissue | Disease Stage | Description | Gene Ratio | Bg Ratio | pvalue | p.adjust | qvalue | Count |
| hsa041467 | Esophagus | ESCC | Peroxisome | 55/4205 | 82/8465 | 1.04e-03 | 3.27e-03 | 1.68e-03 | 55 |
| hsa0414612 | Esophagus | ESCC | Peroxisome | 55/4205 | 82/8465 | 1.04e-03 | 3.27e-03 | 1.68e-03 | 55 |
| hsa041466 | Oral cavity | OSCC | Peroxisome | 47/3704 | 82/8465 | 9.01e-03 | 2.01e-02 | 1.03e-02 | 47 |
| hsa0414611 | Oral cavity | OSCC | Peroxisome | 47/3704 | 82/8465 | 9.01e-03 | 2.01e-02 | 1.03e-02 | 47 |
| hsa0414621 | Oral cavity | LP | Peroxisome | 33/2418 | 82/8465 | 1.48e-02 | 4.69e-02 | 3.03e-02 | 33 |
| hsa0414631 | Oral cavity | LP | Peroxisome | 33/2418 | 82/8465 | 1.48e-02 | 4.69e-02 | 3.03e-02 | 33 |
| Page: 1 |
Top |
Cell-cell communication analysis |
| Identification of potential cell-cell interactions between two cell types and their ligand-receptor pairs for different disease states |
| Ligand | Receptor | LRpair | Pathway | Tissue | Disease Stage |
| Page: 1 |
Top |
Single-cell gene regulatory network inference analysis |
| Find out the significant the regulons (TFs) and the target genes of each regulon across cell types for different disease states |
| TF | Cell Type | Tissue | Disease Stage | Target Gene | RSS | Regulon Activity |
| ∗The dot plots of a searched regulon are shown for all cell subpopulations in each disease state of each tissue based on the regulon specific score inferred using pySCENIC and by calculating the average expression. |
| Page: 1 |
Top |
Somatic mutation of malignant transformation related genes |
| Annotation of somatic variants for genes involved in malignant transformation |
| Hugo Symbol | Variant Class | Variant Classification | dbSNP RS | HGVSc | HGVSp | HGVSp Short | SWISSPROT | BIOTYPE | SIFT | PolyPhen | Tumor Sample Barcode | Tissue | Histology | Sex | Age | Stage | Therapy Types | Drugs | Outcome |
| PEX14 | SNV | Missense_Mutation | novel | c.228N>T | p.Glu76Asp | p.E76D | O75381 | protein_coding | tolerated(0.07) | benign(0.111) | TCGA-AO-A1KT-01 | Breast | breast invasive carcinoma | Female | >=65 | I/II | Chemotherapy | fluorouracil | SD |
| PEX14 | SNV | Missense_Mutation | rs758492014 | c.331N>A | p.Ala111Thr | p.A111T | O75381 | protein_coding | deleterious(0.03) | possibly_damaging(0.789) | TCGA-EW-A1IZ-01 | Breast | breast invasive carcinoma | Female | <65 | III/IV | Chemotherapy | taxotere | SD |
| PEX14 | SNV | Missense_Mutation | c.898N>A | p.Glu300Lys | p.E300K | O75381 | protein_coding | tolerated_low_confidence(0.73) | benign(0) | TCGA-EK-A2PL-01 | Cervix | cervical & endocervical cancer | Female | <65 | III/IV | Unknown | Unknown | SD | |
| PEX14 | SNV | Missense_Mutation | rs778315559 | c.233C>T | p.Ser78Leu | p.S78L | O75381 | protein_coding | tolerated(0.41) | benign(0) | TCGA-MA-AA3Y-01 | Cervix | cervical & endocervical cancer | Female | <65 | I/II | Unknown | Unknown | SD |
| PEX14 | SNV | Missense_Mutation | c.901G>C | p.Gly301Arg | p.G301R | O75381 | protein_coding | deleterious_low_confidence(0.03) | benign(0) | TCGA-Q1-A73O-01 | Cervix | cervical & endocervical cancer | Female | <65 | I/II | Chemotherapy | cisplatin | CR | |
| PEX14 | SNV | Missense_Mutation | rs149265608 | c.761C>T | p.Ala254Val | p.A254V | O75381 | protein_coding | tolerated(0.38) | benign(0.003) | TCGA-VS-A9V4-01 | Cervix | cervical & endocervical cancer | Female | <65 | I/II | Chemotherapy | cisplatin | PD |
| PEX14 | SNV | Missense_Mutation | rs758492014 | c.331N>A | p.Ala111Thr | p.A111T | O75381 | protein_coding | deleterious(0.03) | possibly_damaging(0.789) | TCGA-AA-3672-01 | Colorectum | colon adenocarcinoma | Female | >=65 | III/IV | Unknown | Unknown | SD |
| PEX14 | SNV | Missense_Mutation | novel | c.265G>A | p.Val89Ile | p.V89I | O75381 | protein_coding | tolerated(0.21) | benign(0.059) | TCGA-AA-3949-01 | Colorectum | colon adenocarcinoma | Female | >=65 | III/IV | Unknown | Unknown | SD |
| PEX14 | SNV | Missense_Mutation | rs778315559 | c.233N>T | p.Ser78Leu | p.S78L | O75381 | protein_coding | tolerated(0.41) | benign(0) | TCGA-G4-6628-01 | Colorectum | colon adenocarcinoma | Male | >=65 | I/II | Unknown | Unknown | SD |
| PEX14 | SNV | Missense_Mutation | novel | c.279N>A | p.His93Gln | p.H93Q | O75381 | protein_coding | tolerated(0.65) | benign(0.003) | TCGA-A5-A0G2-01 | Endometrium | uterine corpus endometrioid carcinoma | Female | <65 | III/IV | Unknown | Unknown | SD |
| Page: 1 2 3 |
Top |
Related drugs of malignant transformation related genes |
| Identification of chemicals and drugs interact with genes involved in malignant transfromation |
| (DGIdb 4.0) |
| Entrez ID | Symbol | Category | Interaction Types | Drug Claim Name | Drug Name | PMIDs |
| Page: 1 |

Copyright 2023-Present -The University of Texas Health Science Center at Houston |