
|
|||||
|
 | |
| |
| |
| |
| |
| |
|
Gene: PEX13 |
Gene summary for PEX13 |
| Gene information | Species | Human | Gene symbol | PEX13 | Gene ID | 5194 |
| Gene name | peroxisomal biogenesis factor 13 | |
| Gene Alias | NALD | |
| Cytomap | 2p15 | |
| Gene Type | protein-coding | GO ID | GO:0001561 | UniProtAcc | Q92968 |
Top |
Malignant transformation analysis |
| Identification of the aberrant gene expression in precancerous and cancerous lesions by comparing the gene expression of stem-like cells in diseased tissues with normal stem cells |
| Entrez ID | Symbol | Replicates | Species | Organ | Tissue | Adj P-value | Log2FC | Malignancy |
| 5194 | PEX13 | LZE2T | Human | Esophagus | ESCC | 1.94e-03 | 4.83e-01 | 0.082 |
| 5194 | PEX13 | LZE4T | Human | Esophagus | ESCC | 1.14e-20 | 7.06e-01 | 0.0811 |
| 5194 | PEX13 | LZE7T | Human | Esophagus | ESCC | 1.43e-04 | 2.10e-01 | 0.0667 |
| 5194 | PEX13 | LZE20T | Human | Esophagus | ESCC | 9.97e-10 | 2.66e-01 | 0.0662 |
| 5194 | PEX13 | LZE24T | Human | Esophagus | ESCC | 3.65e-19 | 4.89e-01 | 0.0596 |
| 5194 | PEX13 | LZE21T | Human | Esophagus | ESCC | 3.45e-06 | 3.25e-01 | 0.0655 |
| 5194 | PEX13 | LZE6T | Human | Esophagus | ESCC | 1.62e-07 | 9.54e-02 | 0.0845 |
| 5194 | PEX13 | P1T-E | Human | Esophagus | ESCC | 3.52e-05 | 3.86e-01 | 0.0875 |
| 5194 | PEX13 | P2T-E | Human | Esophagus | ESCC | 1.74e-30 | 5.17e-01 | 0.1177 |
| 5194 | PEX13 | P4T-E | Human | Esophagus | ESCC | 3.68e-26 | 5.85e-01 | 0.1323 |
| 5194 | PEX13 | P5T-E | Human | Esophagus | ESCC | 7.32e-16 | 2.15e-01 | 0.1327 |
| 5194 | PEX13 | P8T-E | Human | Esophagus | ESCC | 4.57e-25 | 4.01e-01 | 0.0889 |
| 5194 | PEX13 | P9T-E | Human | Esophagus | ESCC | 2.18e-12 | 3.11e-01 | 0.1131 |
| 5194 | PEX13 | P10T-E | Human | Esophagus | ESCC | 4.38e-29 | 3.65e-01 | 0.116 |
| 5194 | PEX13 | P11T-E | Human | Esophagus | ESCC | 1.18e-18 | 9.26e-01 | 0.1426 |
| 5194 | PEX13 | P12T-E | Human | Esophagus | ESCC | 2.01e-20 | 4.25e-01 | 0.1122 |
| 5194 | PEX13 | P15T-E | Human | Esophagus | ESCC | 2.82e-35 | 7.55e-01 | 0.1149 |
| 5194 | PEX13 | P16T-E | Human | Esophagus | ESCC | 9.96e-35 | 4.59e-01 | 0.1153 |
| 5194 | PEX13 | P17T-E | Human | Esophagus | ESCC | 7.90e-03 | 2.20e-01 | 0.1278 |
| 5194 | PEX13 | P19T-E | Human | Esophagus | ESCC | 5.81e-04 | 4.74e-01 | 0.1662 |
| Page: 1 2 3 4 5 6 |
| Tissue | Expression Dynamics | Abbreviation |
| Esophagus | 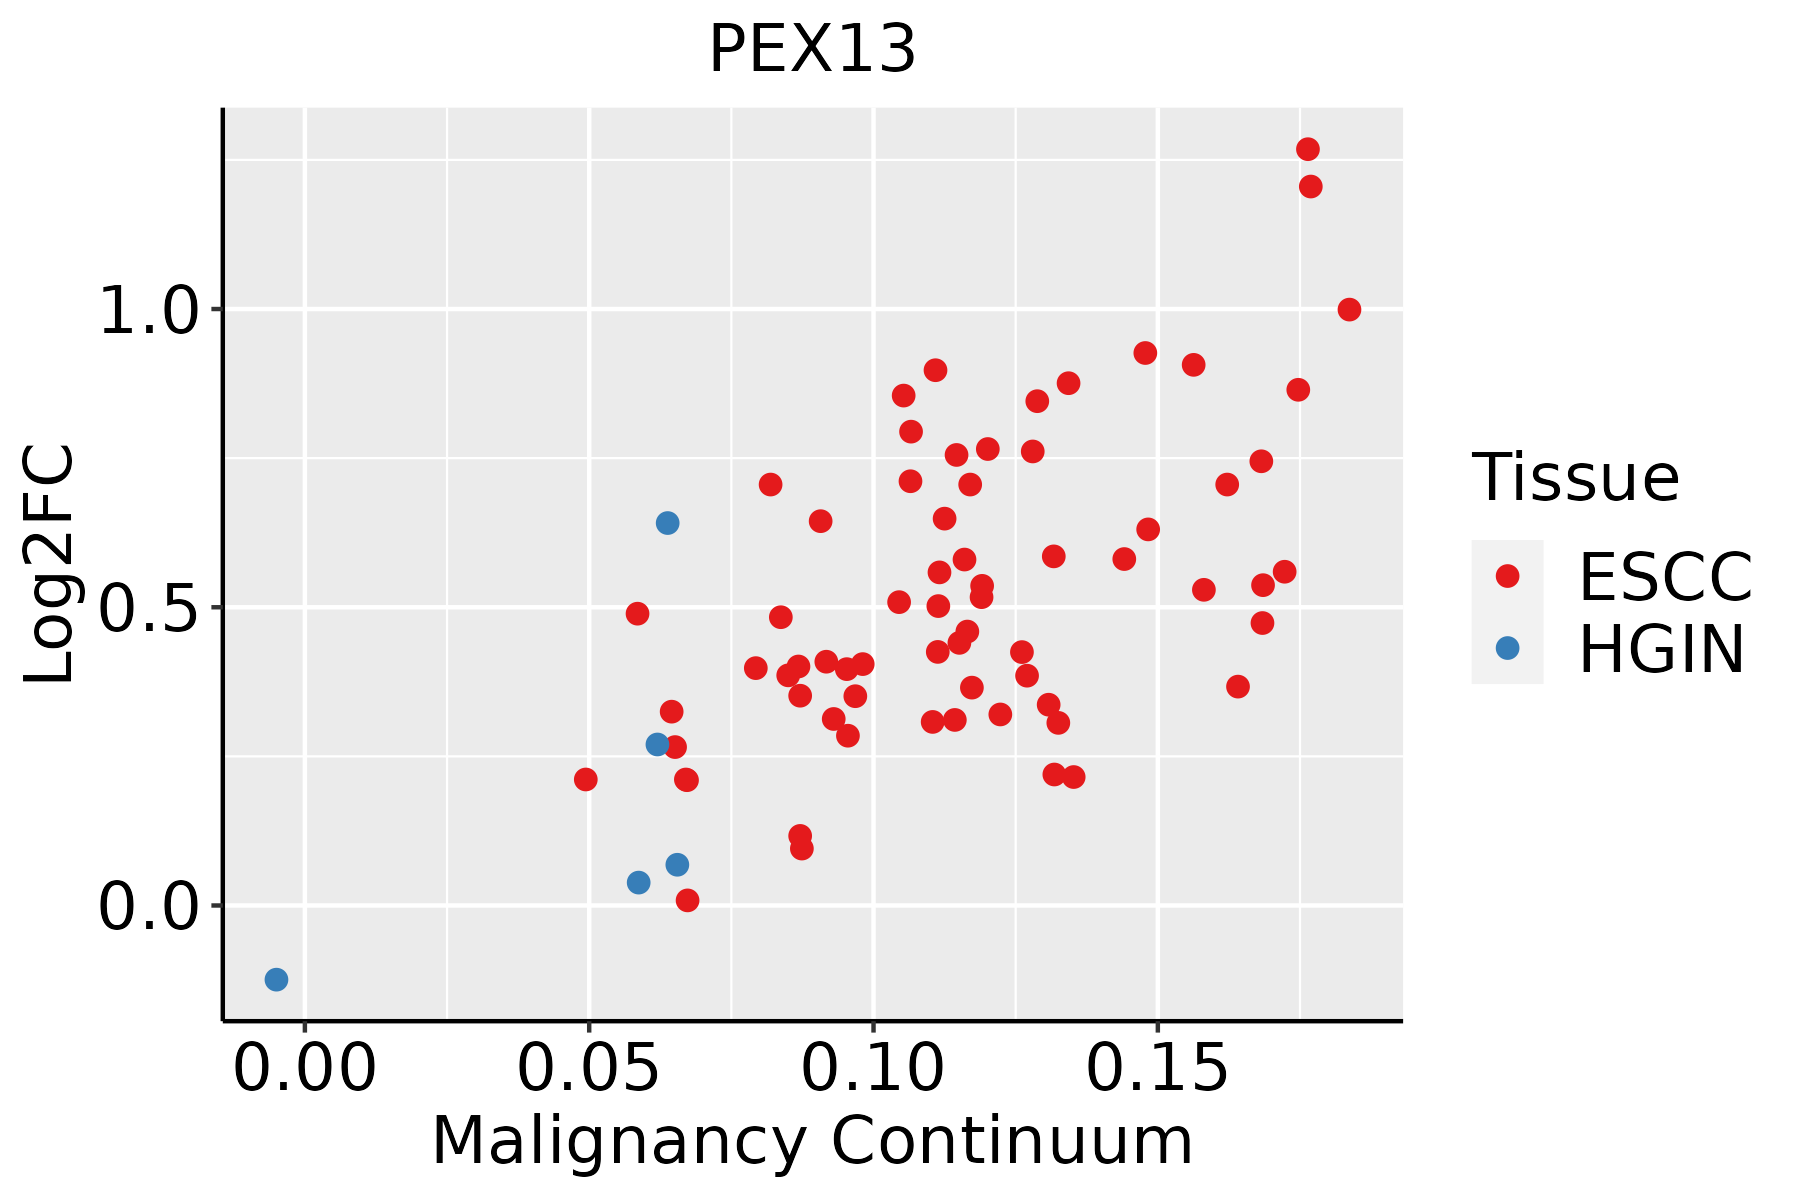 | ESCC: Esophageal squamous cell carcinoma |
| HGIN: High-grade intraepithelial neoplasias | ||
| LGIN: Low-grade intraepithelial neoplasias | ||
| Liver | 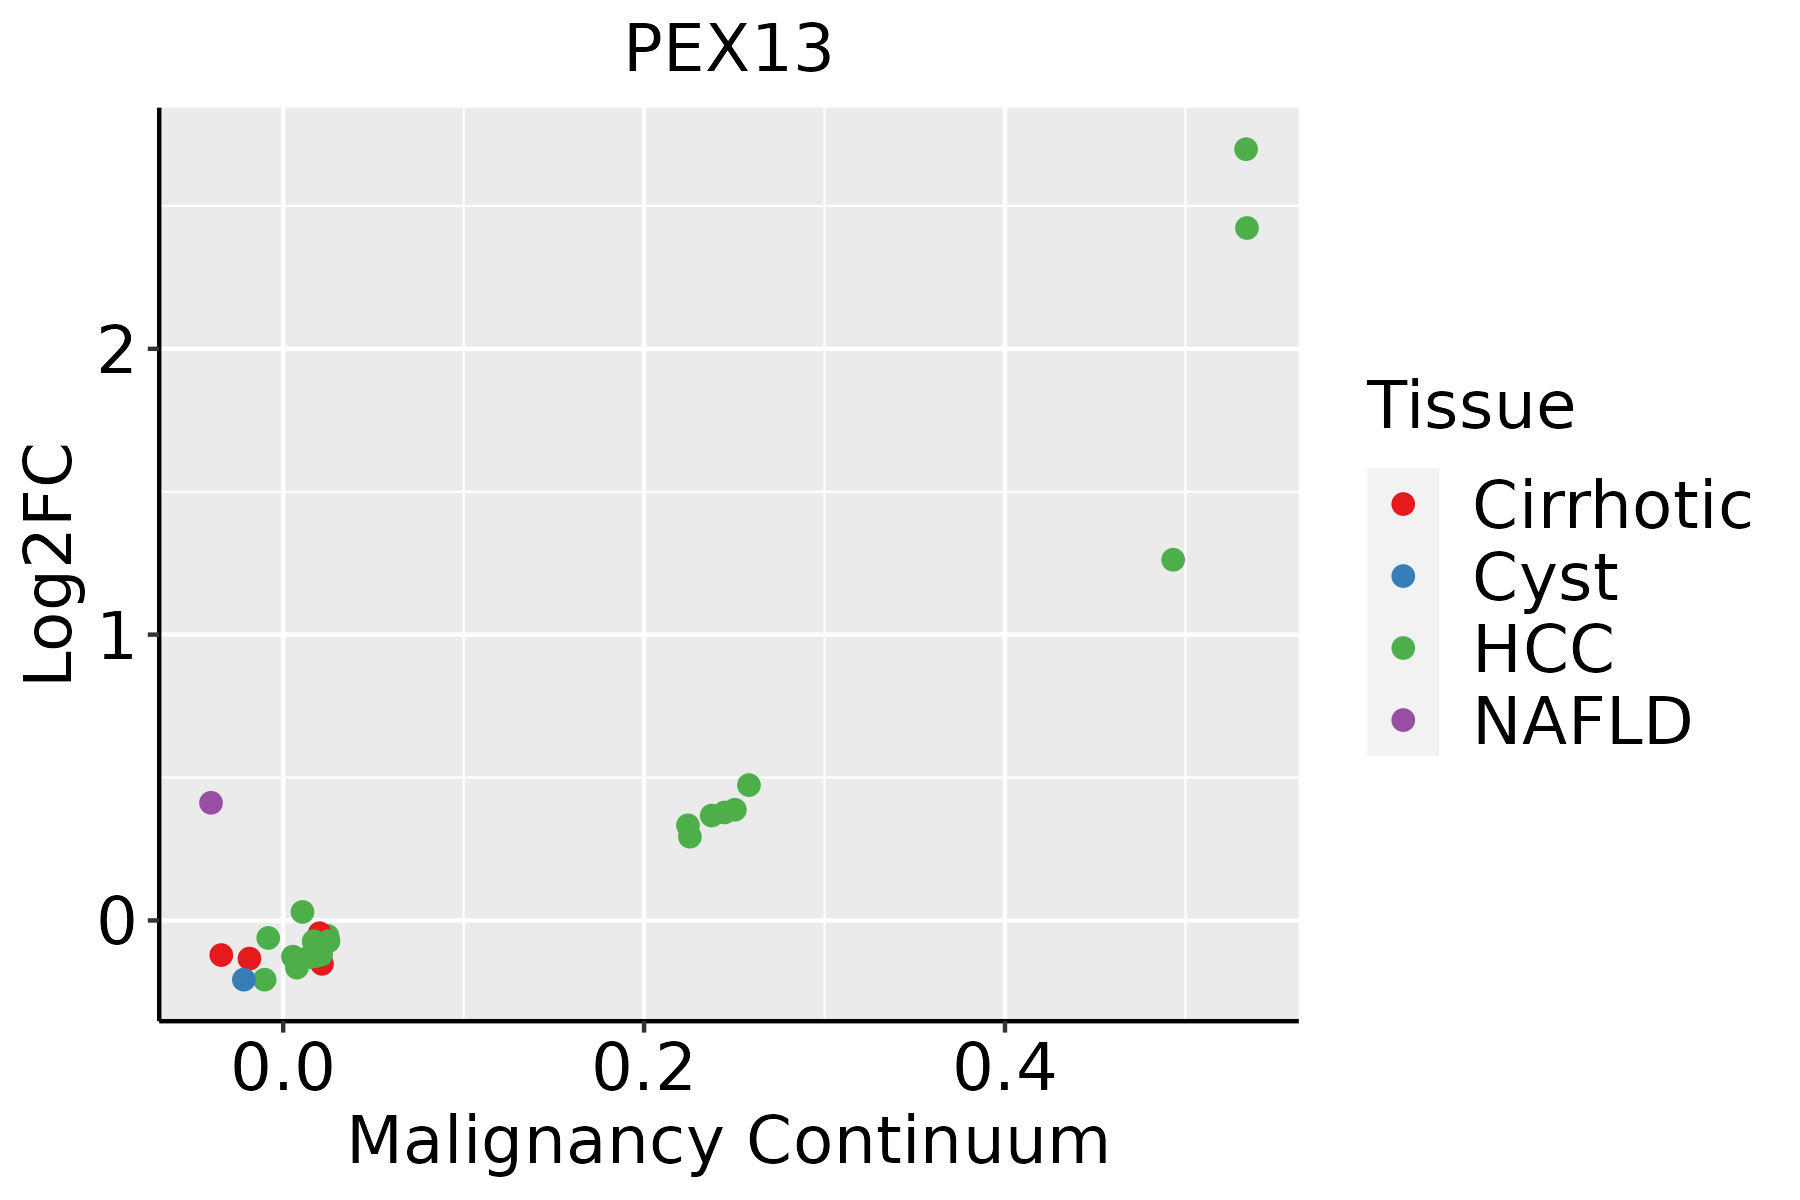 | HCC: Hepatocellular carcinoma |
| NAFLD: Non-alcoholic fatty liver disease | ||
| Oral Cavity | 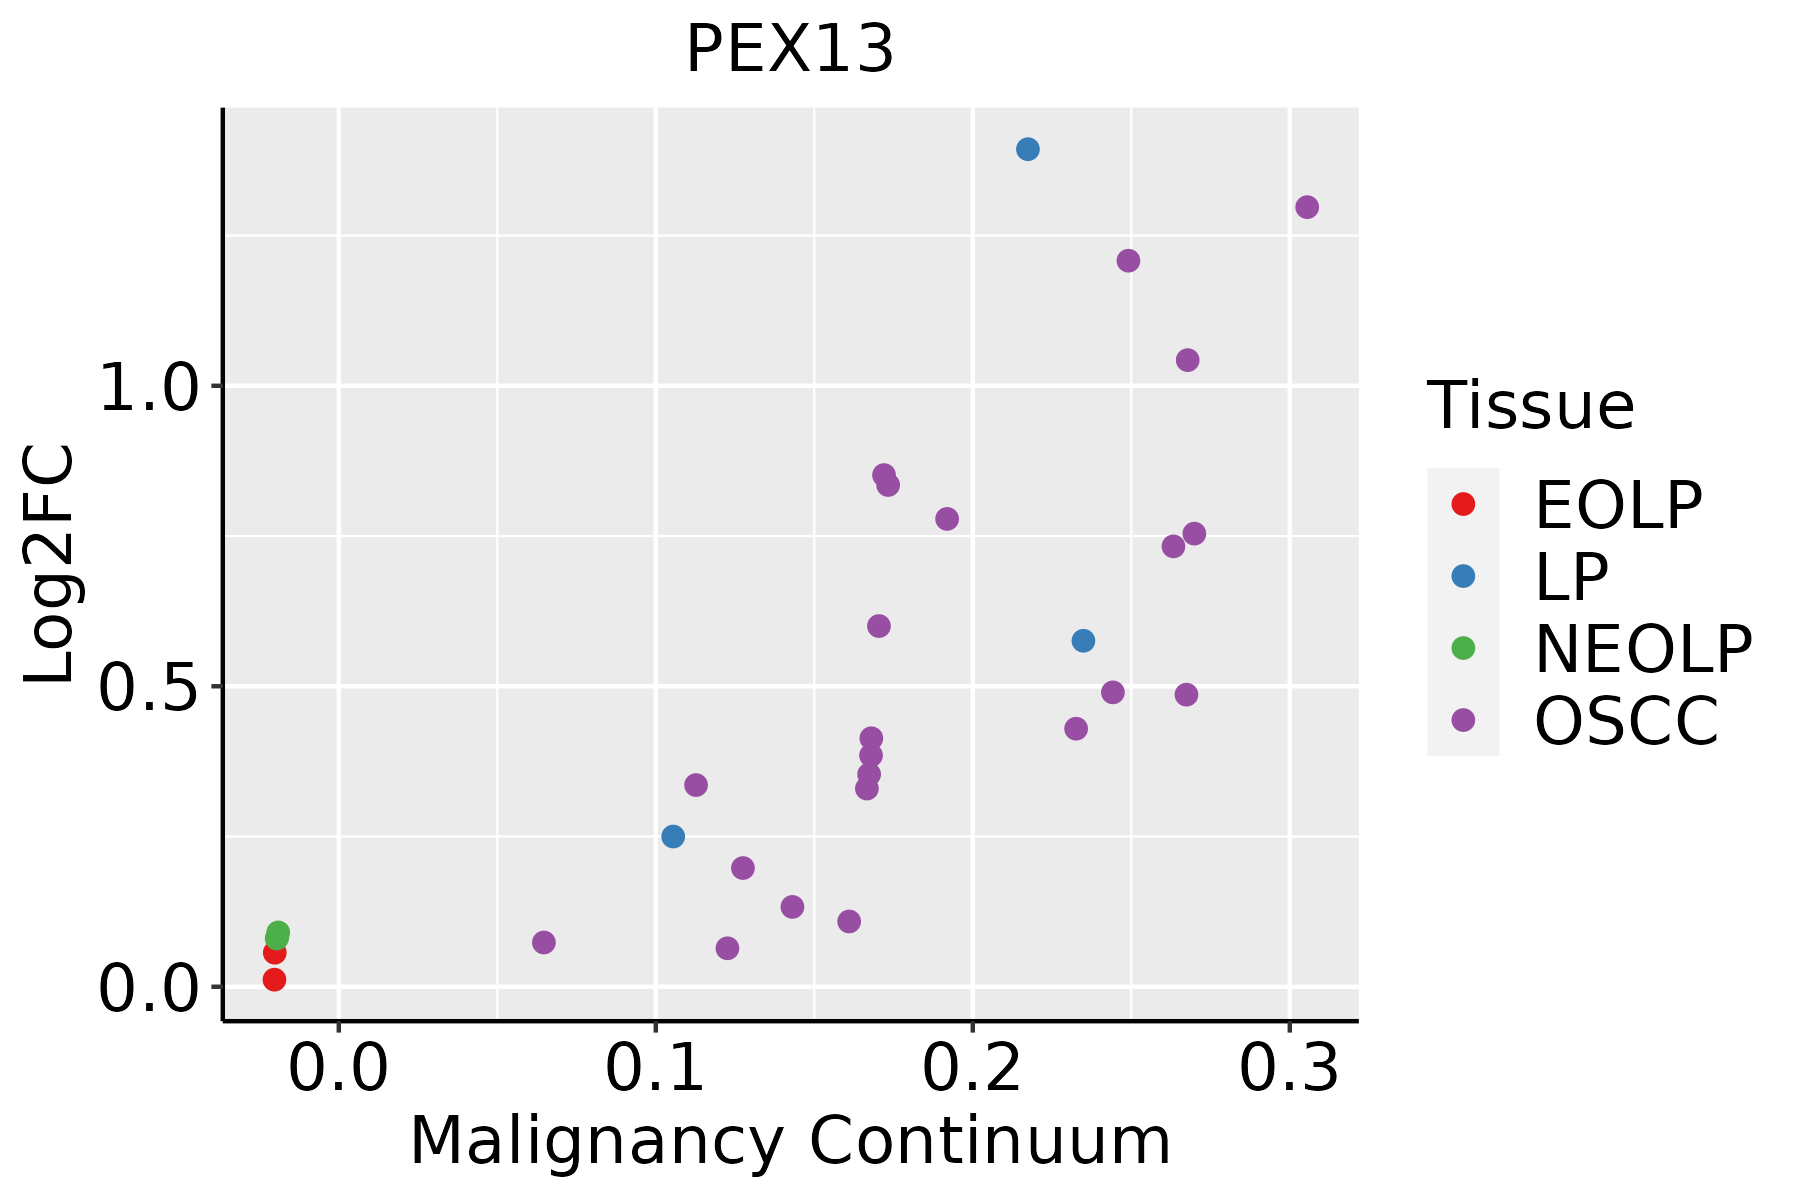 | EOLP: Erosive Oral lichen planus |
| LP: leukoplakia | ||
| NEOLP: Non-erosive oral lichen planus | ||
| OSCC: Oral squamous cell carcinoma | ||
| Skin |  | AK: Actinic keratosis |
| cSCC: Cutaneous squamous cell carcinoma | ||
| SCCIS:squamous cell carcinoma in situ |
| ∗log2FC in expression of this searched gene in stem-like cells from each diseased tissue sample relative to stem-like cells in normal samples in each tissue plotted against the malignancy continuum. Samples are colored based on if they are from different disease stage. |
Top |
Malignant transformation related pathway analysis |
| Find out the enriched GO biological processes and KEGG pathways involved in transition from healthy to precancer to cancer |
| Tissue | Disease Stage | Enriched GO biological Processes |
| Colorectum | AD |  |
| Colorectum | SER |  |
| Colorectum | MSS |  |
| Colorectum | MSI-H |  |
| Colorectum | FAP |  |
| ∗Top 15 enriched GO BP terms are showed in the bar plot of each disease state in each tissue. Each row represents a significant GO biological process which is colored according to the -log10(p.adjust). |
| Page: 1 2 3 4 5 6 7 8 9 |
| GO ID | Tissue | Disease Stage | Description | Gene Ratio | Bg Ratio | pvalue | p.adjust | Count |
| GO:0072594110 | Esophagus | ESCC | establishment of protein localization to organelle | 311/8552 | 422/18723 | 3.02e-32 | 2.13e-29 | 311 |
| GO:0006605111 | Esophagus | ESCC | protein targeting | 229/8552 | 314/18723 | 4.93e-23 | 1.01e-20 | 229 |
| GO:001703818 | Esophagus | ESCC | protein import | 149/8552 | 206/18723 | 5.90e-15 | 3.31e-13 | 149 |
| GO:00718069 | Esophagus | ESCC | protein transmembrane transport | 47/8552 | 59/18723 | 9.02e-08 | 1.51e-06 | 47 |
| GO:00650026 | Esophagus | ESCC | intracellular protein transmembrane transport | 40/8552 | 51/18723 | 1.76e-06 | 2.08e-05 | 40 |
| GO:00193958 | Esophagus | ESCC | fatty acid oxidation | 69/8552 | 103/18723 | 9.95e-06 | 9.44e-05 | 69 |
| GO:00447433 | Esophagus | ESCC | protein transmembrane import into intracellular organelle | 29/8552 | 36/18723 | 1.91e-05 | 1.67e-04 | 29 |
| GO:00344407 | Esophagus | ESCC | lipid oxidation | 71/8552 | 108/18723 | 2.00e-05 | 1.74e-04 | 71 |
| GO:00090628 | Esophagus | ESCC | fatty acid catabolic process | 66/8552 | 100/18723 | 3.21e-05 | 2.66e-04 | 66 |
| GO:00066318 | Esophagus | ESCC | fatty acid metabolic process | 217/8552 | 390/18723 | 4.21e-05 | 3.39e-04 | 217 |
| GO:00723297 | Esophagus | ESCC | monocarboxylic acid catabolic process | 74/8552 | 122/18723 | 6.03e-04 | 3.27e-03 | 74 |
| GO:00442427 | Esophagus | ESCC | cellular lipid catabolic process | 121/8552 | 214/18723 | 8.63e-04 | 4.43e-03 | 121 |
| GO:00442827 | Esophagus | ESCC | small molecule catabolic process | 201/8552 | 376/18723 | 1.35e-03 | 6.41e-03 | 201 |
| GO:00302586 | Esophagus | ESCC | lipid modification | 116/8552 | 212/18723 | 4.90e-03 | 1.89e-02 | 116 |
| GO:00066252 | Esophagus | ESCC | protein targeting to peroxisome | 14/8552 | 18/18723 | 5.77e-03 | 2.14e-02 | 14 |
| GO:00726622 | Esophagus | ESCC | protein localization to peroxisome | 14/8552 | 18/18723 | 5.77e-03 | 2.14e-02 | 14 |
| GO:00726632 | Esophagus | ESCC | establishment of protein localization to peroxisome | 14/8552 | 18/18723 | 5.77e-03 | 2.14e-02 | 14 |
| GO:00215436 | Esophagus | ESCC | pallium development | 94/8552 | 169/18723 | 5.79e-03 | 2.14e-02 | 94 |
| GO:00160427 | Esophagus | ESCC | lipid catabolic process | 168/8552 | 320/18723 | 7.97e-03 | 2.84e-02 | 168 |
| GO:00435742 | Esophagus | ESCC | peroxisomal transport | 16/8552 | 22/18723 | 9.46e-03 | 3.28e-02 | 16 |
| Page: 1 2 3 4 5 |
| Pathway ID | Tissue | Disease Stage | Description | Gene Ratio | Bg Ratio | pvalue | p.adjust | qvalue | Count |
| hsa041467 | Esophagus | ESCC | Peroxisome | 55/4205 | 82/8465 | 1.04e-03 | 3.27e-03 | 1.68e-03 | 55 |
| hsa0414612 | Esophagus | ESCC | Peroxisome | 55/4205 | 82/8465 | 1.04e-03 | 3.27e-03 | 1.68e-03 | 55 |
| hsa04146 | Liver | NAFLD | Peroxisome | 19/1043 | 82/8465 | 4.37e-03 | 4.10e-02 | 3.30e-02 | 19 |
| hsa041461 | Liver | NAFLD | Peroxisome | 19/1043 | 82/8465 | 4.37e-03 | 4.10e-02 | 3.30e-02 | 19 |
| hsa041464 | Liver | HCC | Peroxisome | 58/4020 | 82/8465 | 1.57e-05 | 1.05e-04 | 5.85e-05 | 58 |
| hsa041465 | Liver | HCC | Peroxisome | 58/4020 | 82/8465 | 1.57e-05 | 1.05e-04 | 5.85e-05 | 58 |
| hsa041466 | Oral cavity | OSCC | Peroxisome | 47/3704 | 82/8465 | 9.01e-03 | 2.01e-02 | 1.03e-02 | 47 |
| hsa0414611 | Oral cavity | OSCC | Peroxisome | 47/3704 | 82/8465 | 9.01e-03 | 2.01e-02 | 1.03e-02 | 47 |
| hsa0414621 | Oral cavity | LP | Peroxisome | 33/2418 | 82/8465 | 1.48e-02 | 4.69e-02 | 3.03e-02 | 33 |
| hsa0414631 | Oral cavity | LP | Peroxisome | 33/2418 | 82/8465 | 1.48e-02 | 4.69e-02 | 3.03e-02 | 33 |
| Page: 1 |
Top |
Cell-cell communication analysis |
| Identification of potential cell-cell interactions between two cell types and their ligand-receptor pairs for different disease states |
| Ligand | Receptor | LRpair | Pathway | Tissue | Disease Stage |
| Page: 1 |
Top |
Single-cell gene regulatory network inference analysis |
| Find out the significant the regulons (TFs) and the target genes of each regulon across cell types for different disease states |
| TF | Cell Type | Tissue | Disease Stage | Target Gene | RSS | Regulon Activity |
| ∗The dot plots of a searched regulon are shown for all cell subpopulations in each disease state of each tissue based on the regulon specific score inferred using pySCENIC and by calculating the average expression. |
| Page: 1 |
Top |
Somatic mutation of malignant transformation related genes |
| Annotation of somatic variants for genes involved in malignant transformation |
| Hugo Symbol | Variant Class | Variant Classification | dbSNP RS | HGVSc | HGVSp | HGVSp Short | SWISSPROT | BIOTYPE | SIFT | PolyPhen | Tumor Sample Barcode | Tissue | Histology | Sex | Age | Stage | Therapy Types | Drugs | Outcome |
| PEX13 | SNV | Missense_Mutation | novel | c.374N>C | p.Ser125Thr | p.S125T | Q92968 | protein_coding | deleterious(0) | probably_damaging(0.975) | TCGA-A2-A4RW-01 | Breast | breast invasive carcinoma | Female | <65 | III/IV | Unknown | Unknown | SD |
| PEX13 | SNV | Missense_Mutation | c.1114N>A | p.Glu372Lys | p.E372K | Q92968 | protein_coding | tolerated(0.09) | benign(0.021) | TCGA-AC-A23H-01 | Breast | breast invasive carcinoma | Female | >=65 | I/II | Unknown | Unknown | PD | |
| PEX13 | SNV | Missense_Mutation | c.31N>T | p.Pro11Ser | p.P11S | Q92968 | protein_coding | deleterious(0) | probably_damaging(0.968) | TCGA-AN-A0FL-01 | Breast | breast invasive carcinoma | Female | <65 | I/II | Unknown | Unknown | SD | |
| PEX13 | SNV | Missense_Mutation | c.341N>G | p.Pro114Arg | p.P114R | Q92968 | protein_coding | tolerated(0.15) | probably_damaging(0.959) | TCGA-EW-A1IY-01 | Breast | breast invasive carcinoma | Female | <65 | I/II | Chemotherapy | taxotere | SD | |
| PEX13 | insertion | Frame_Shift_Ins | novel | c.304_305insCTGTTATCCTGACATTTTGGGA | p.Gly102AlafsTer18 | p.G102Afs*18 | Q92968 | protein_coding | TCGA-AN-A0FN-01 | Breast | breast invasive carcinoma | Female | <65 | I/II | Unknown | Unknown | SD | ||
| PEX13 | SNV | Missense_Mutation | c.635N>T | p.Ala212Val | p.A212V | Q92968 | protein_coding | tolerated(0.08) | benign(0.068) | TCGA-AY-6197-01 | Colorectum | colon adenocarcinoma | Male | <65 | I/II | Unknown | Unknown | SD | |
| PEX13 | SNV | Missense_Mutation | novel | c.206N>C | p.Asn69Thr | p.N69T | Q92968 | protein_coding | tolerated(0.24) | benign(0.079) | TCGA-CA-6717-01 | Colorectum | colon adenocarcinoma | Male | <65 | I/II | Chemotherapy | oxaliplatin | CR |
| PEX13 | SNV | Missense_Mutation | c.41C>T | p.Thr14Ile | p.T14I | Q92968 | protein_coding | tolerated(0.12) | benign(0.063) | TCGA-F4-6856-01 | Colorectum | colon adenocarcinoma | Male | <65 | I/II | Ancillary | leucovorin | CR | |
| PEX13 | SNV | Missense_Mutation | c.983N>T | p.Ala328Val | p.A328V | Q92968 | protein_coding | deleterious(0.02) | benign(0.209) | TCGA-AG-3591-01 | Colorectum | rectum adenocarcinoma | Female | >=65 | I/II | Unspecific | Complete Response | ||
| PEX13 | SNV | Missense_Mutation | novel | c.110N>A | p.Pro37His | p.P37H | Q92968 | protein_coding | deleterious(0.04) | possibly_damaging(0.628) | TCGA-AG-3726-01 | Colorectum | rectum adenocarcinoma | Female | <65 | I/II | Unknown | Unknown | SD |
| Page: 1 2 3 4 |
Top |
Related drugs of malignant transformation related genes |
| Identification of chemicals and drugs interact with genes involved in malignant transfromation |
| (DGIdb 4.0) |
| Entrez ID | Symbol | Category | Interaction Types | Drug Claim Name | Drug Name | PMIDs |
| Page: 1 |

Copyright 2023-Present -The University of Texas Health Science Center at Houston |