
|
|||||
|
 | |
| |
| |
| |
| |
| |
|
Gene: PEX11B |
Gene summary for PEX11B |
| Gene information | Species | Human | Gene symbol | PEX11B | Gene ID | 8799 |
| Gene name | peroxisomal biogenesis factor 11 beta | |
| Gene Alias | PEX11-BETA | |
| Cytomap | 1q21.1 | |
| Gene Type | protein-coding | GO ID | GO:0006996 | UniProtAcc | O96011 |
Top |
Malignant transformation analysis |
| Identification of the aberrant gene expression in precancerous and cancerous lesions by comparing the gene expression of stem-like cells in diseased tissues with normal stem cells |
| Entrez ID | Symbol | Replicates | Species | Organ | Tissue | Adj P-value | Log2FC | Malignancy |
| 8799 | PEX11B | LZE4T | Human | Esophagus | ESCC | 7.81e-04 | 1.67e-01 | 0.0811 |
| 8799 | PEX11B | LZE7T | Human | Esophagus | ESCC | 1.20e-02 | 2.72e-01 | 0.0667 |
| 8799 | PEX11B | LZE8T | Human | Esophagus | ESCC | 1.17e-02 | 1.77e-01 | 0.067 |
| 8799 | PEX11B | LZE20T | Human | Esophagus | ESCC | 3.21e-04 | 1.84e-01 | 0.0662 |
| 8799 | PEX11B | LZE22D1 | Human | Esophagus | HGIN | 3.07e-02 | 1.74e-01 | 0.0595 |
| 8799 | PEX11B | LZE22T | Human | Esophagus | ESCC | 1.02e-05 | 4.93e-01 | 0.068 |
| 8799 | PEX11B | LZE24T | Human | Esophagus | ESCC | 1.46e-15 | 5.26e-01 | 0.0596 |
| 8799 | PEX11B | LZE6T | Human | Esophagus | ESCC | 1.17e-02 | 1.59e-01 | 0.0845 |
| 8799 | PEX11B | P1T-E | Human | Esophagus | ESCC | 5.93e-07 | 4.18e-01 | 0.0875 |
| 8799 | PEX11B | P2T-E | Human | Esophagus | ESCC | 2.97e-28 | 4.50e-01 | 0.1177 |
| 8799 | PEX11B | P4T-E | Human | Esophagus | ESCC | 1.96e-14 | 3.70e-01 | 0.1323 |
| 8799 | PEX11B | P5T-E | Human | Esophagus | ESCC | 2.63e-13 | 2.39e-01 | 0.1327 |
| 8799 | PEX11B | P8T-E | Human | Esophagus | ESCC | 2.54e-19 | 3.44e-01 | 0.0889 |
| 8799 | PEX11B | P9T-E | Human | Esophagus | ESCC | 1.04e-14 | 3.90e-01 | 0.1131 |
| 8799 | PEX11B | P10T-E | Human | Esophagus | ESCC | 5.99e-19 | 3.46e-01 | 0.116 |
| 8799 | PEX11B | P11T-E | Human | Esophagus | ESCC | 1.31e-12 | 5.16e-01 | 0.1426 |
| 8799 | PEX11B | P12T-E | Human | Esophagus | ESCC | 4.37e-20 | 3.76e-01 | 0.1122 |
| 8799 | PEX11B | P15T-E | Human | Esophagus | ESCC | 2.15e-21 | 4.85e-01 | 0.1149 |
| 8799 | PEX11B | P16T-E | Human | Esophagus | ESCC | 1.83e-20 | 3.54e-01 | 0.1153 |
| 8799 | PEX11B | P17T-E | Human | Esophagus | ESCC | 3.98e-04 | 2.84e-01 | 0.1278 |
| Page: 1 2 3 4 5 |
| Tissue | Expression Dynamics | Abbreviation |
| Esophagus | 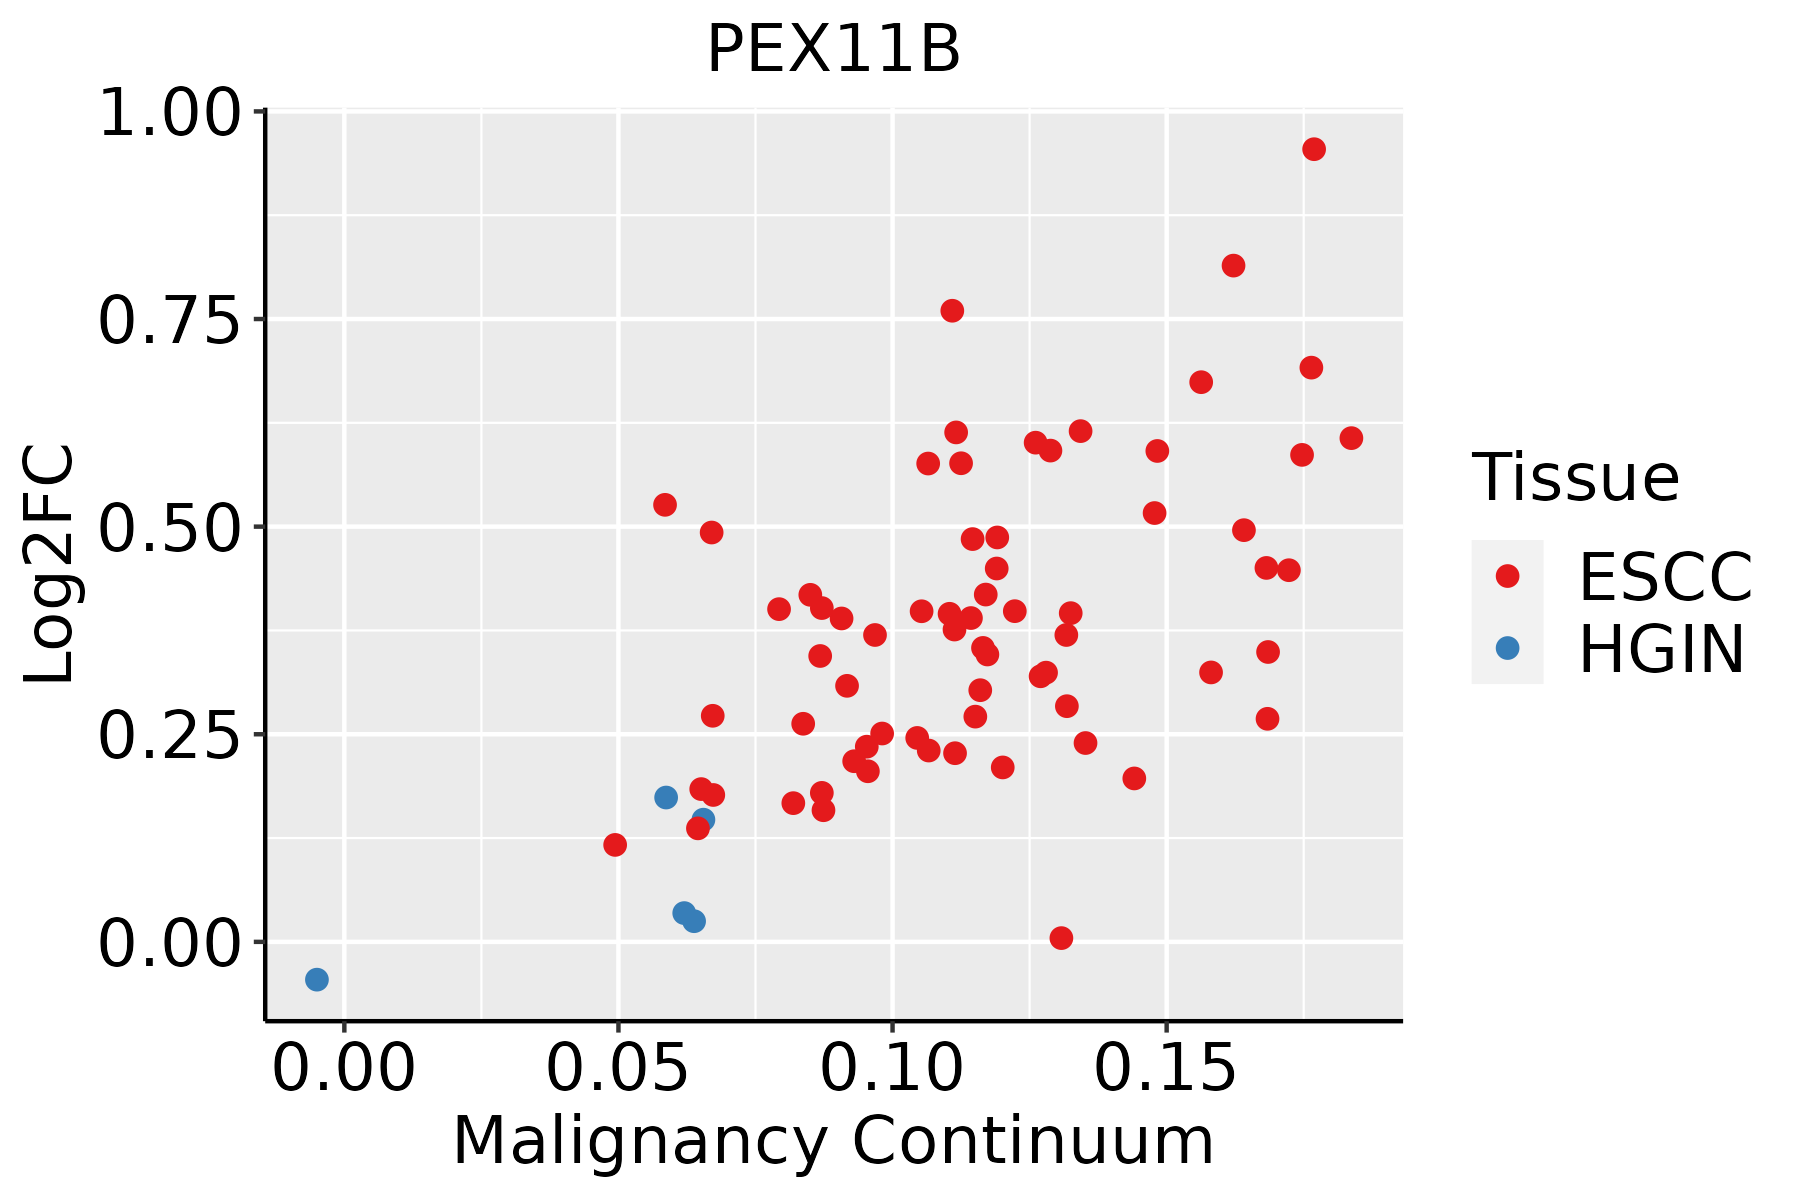 | ESCC: Esophageal squamous cell carcinoma |
| HGIN: High-grade intraepithelial neoplasias | ||
| LGIN: Low-grade intraepithelial neoplasias | ||
| Liver | 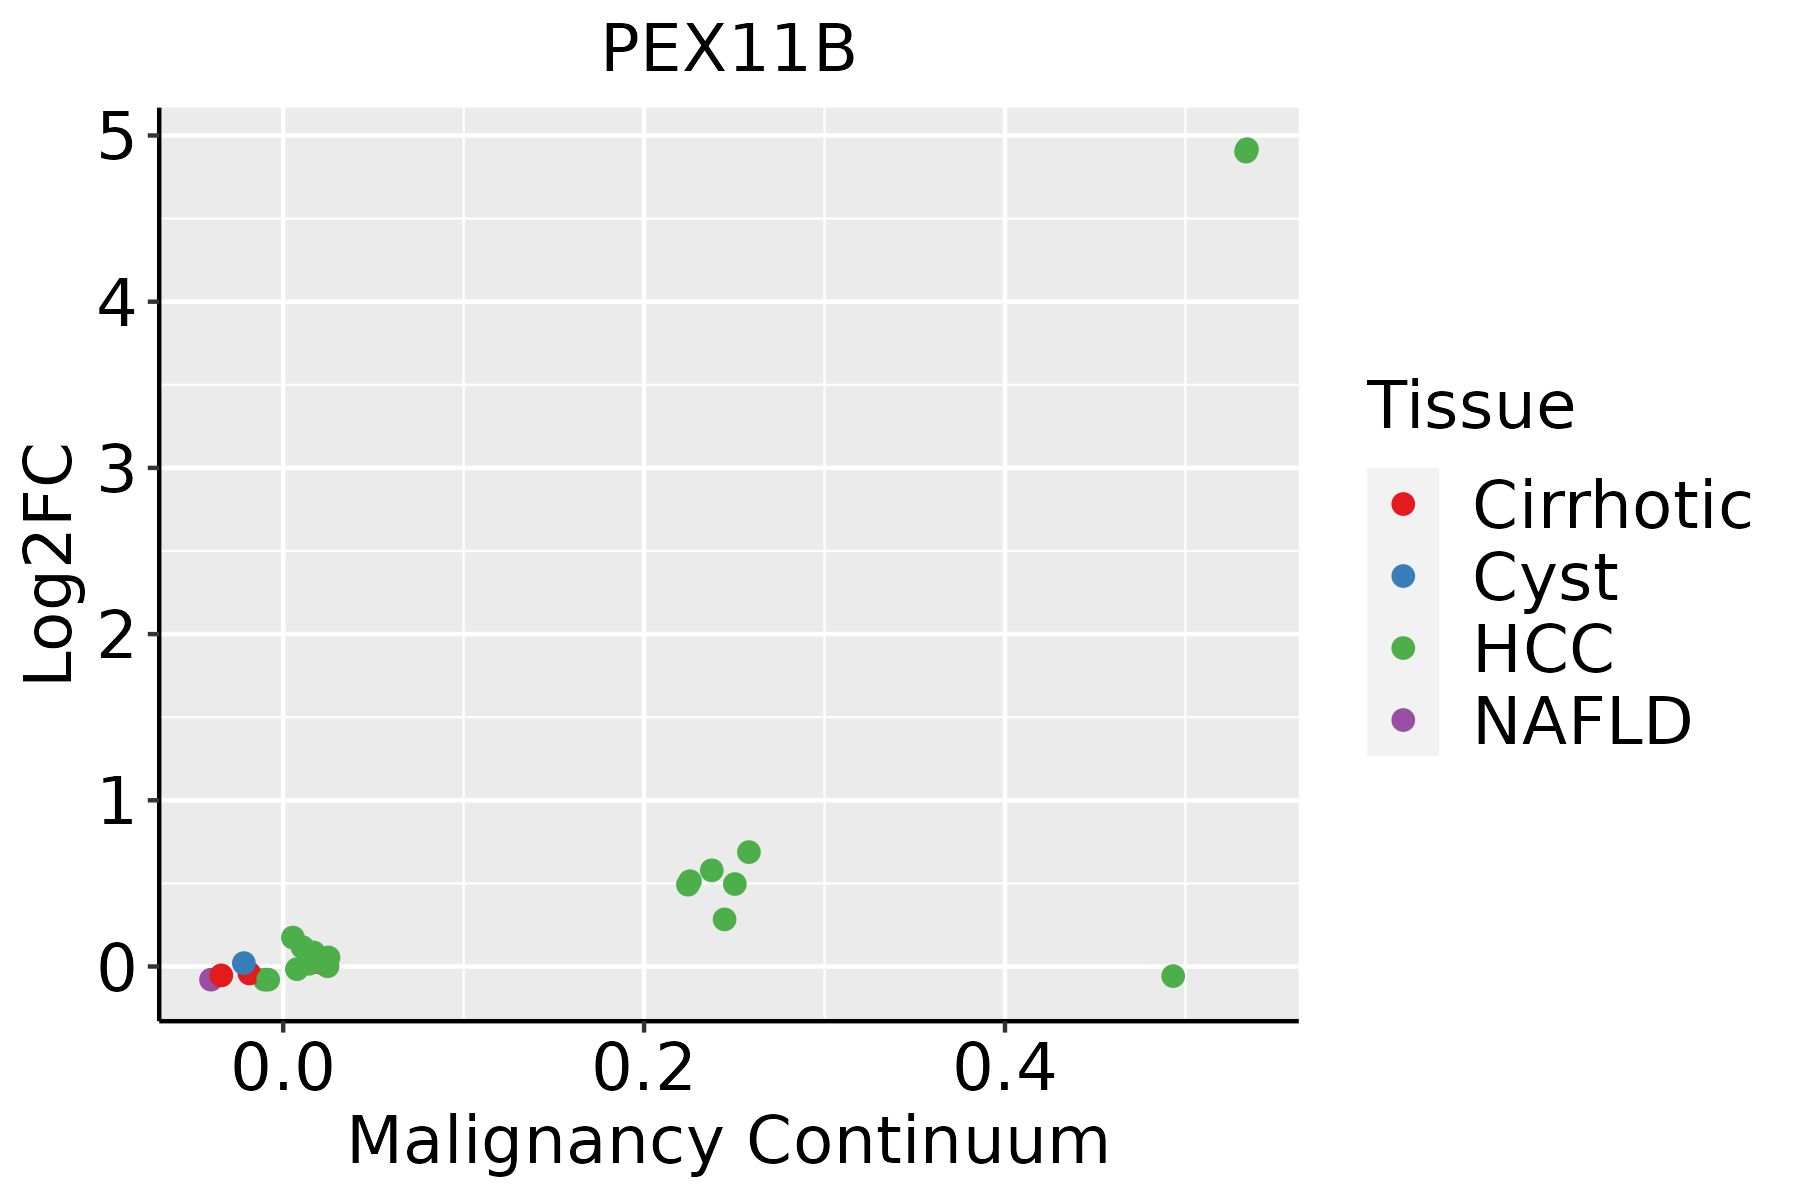 | HCC: Hepatocellular carcinoma |
| NAFLD: Non-alcoholic fatty liver disease | ||
| Oral Cavity | 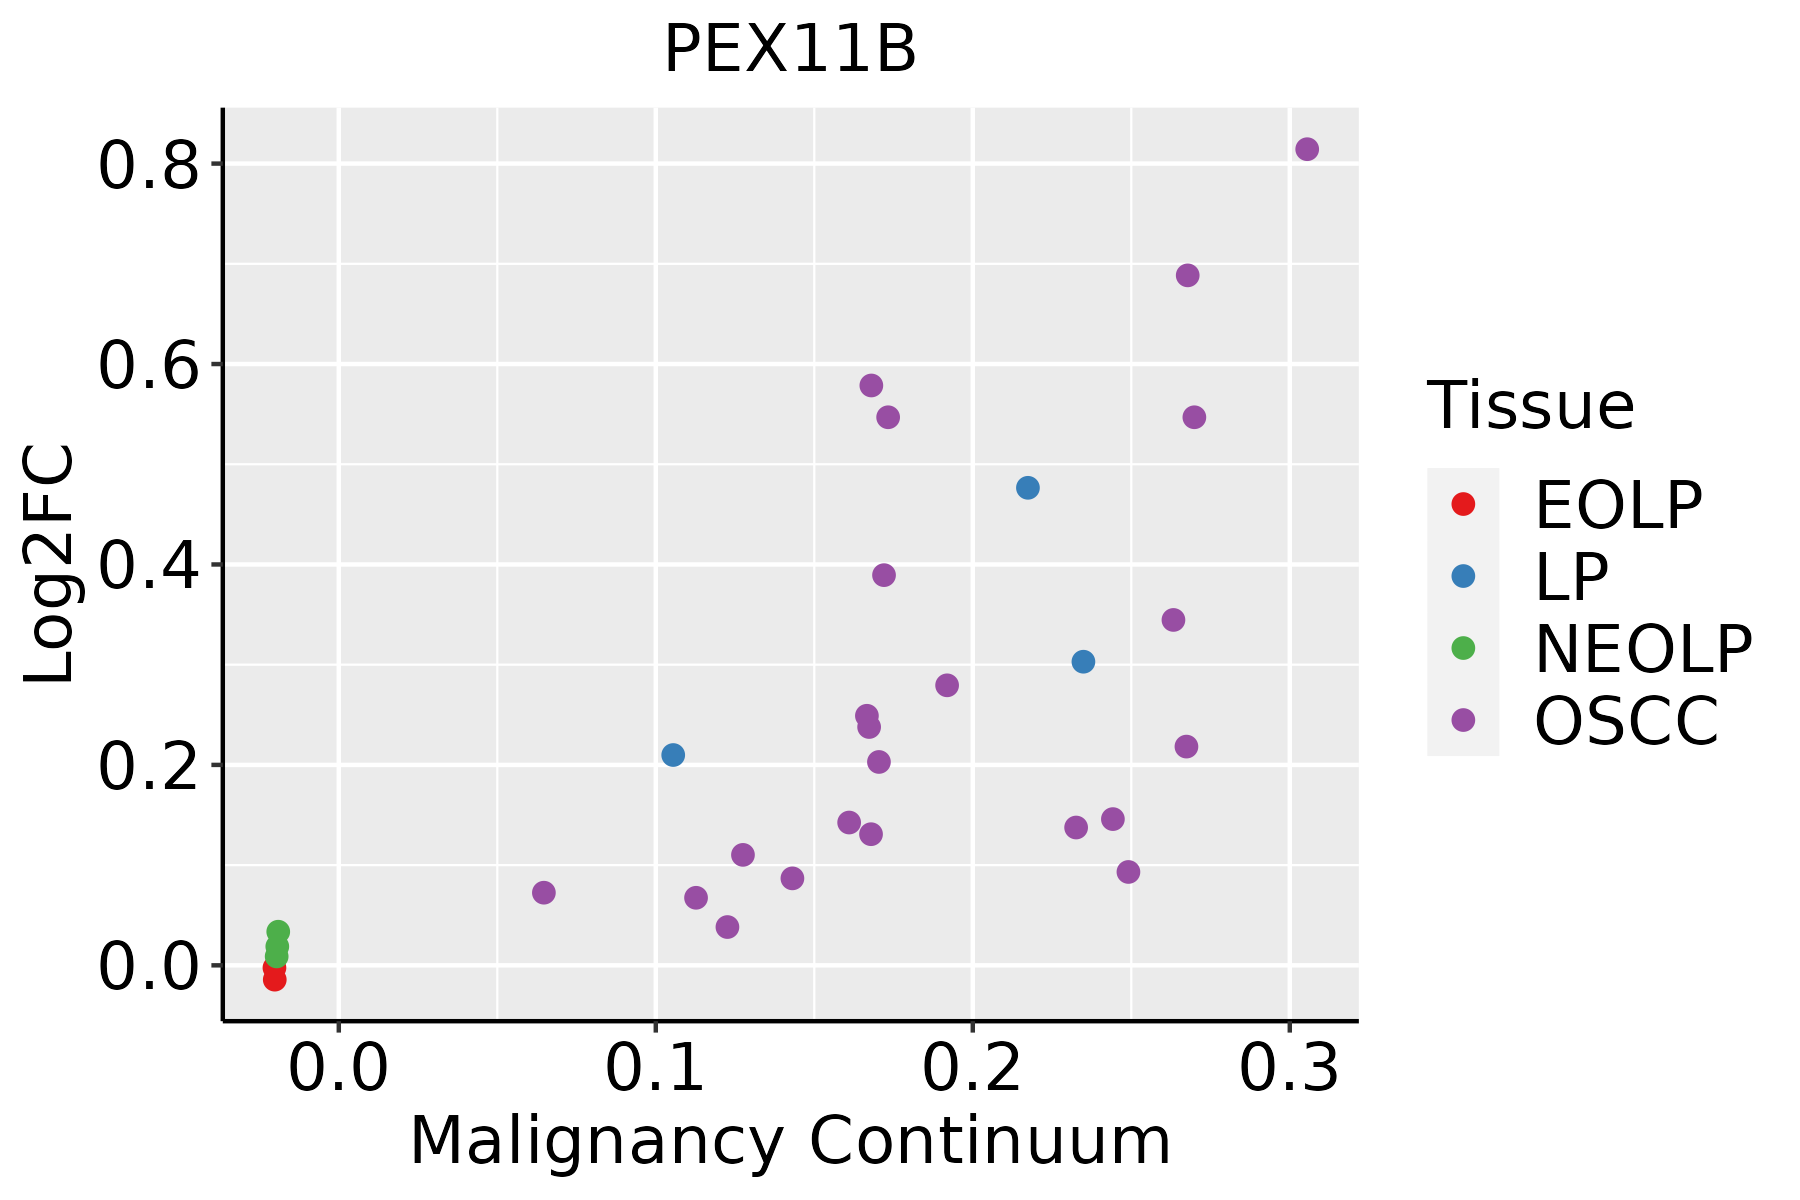 | EOLP: Erosive Oral lichen planus |
| LP: leukoplakia | ||
| NEOLP: Non-erosive oral lichen planus | ||
| OSCC: Oral squamous cell carcinoma |
| ∗log2FC in expression of this searched gene in stem-like cells from each diseased tissue sample relative to stem-like cells in normal samples in each tissue plotted against the malignancy continuum. Samples are colored based on if they are from different disease stage. |
Top |
Malignant transformation related pathway analysis |
| Find out the enriched GO biological processes and KEGG pathways involved in transition from healthy to precancer to cancer |
| Tissue | Disease Stage | Enriched GO biological Processes |
| Colorectum | AD |  |
| Colorectum | SER |  |
| Colorectum | MSS |  |
| Colorectum | MSI-H |  |
| Colorectum | FAP |  |
| ∗Top 15 enriched GO BP terms are showed in the bar plot of each disease state in each tissue. Each row represents a significant GO biological process which is colored according to the -log10(p.adjust). |
| Page: 1 2 3 4 5 6 7 8 9 |
| GO ID | Tissue | Disease Stage | Description | Gene Ratio | Bg Ratio | pvalue | p.adjust | Count |
| GO:00482853 | Esophagus | ESCC | organelle fission | 301/8552 | 488/18723 | 4.64e-13 | 2.12e-11 | 301 |
| GO:003253520 | Esophagus | ESCC | regulation of cellular component size | 227/8552 | 383/18723 | 4.77e-08 | 8.60e-07 | 227 |
| GO:003253512 | Liver | Cirrhotic | regulation of cellular component size | 135/4634 | 383/18723 | 2.32e-06 | 4.26e-05 | 135 |
| GO:003253522 | Liver | HCC | regulation of cellular component size | 217/7958 | 383/18723 | 1.28e-08 | 3.14e-07 | 217 |
| GO:0048285 | Liver | HCC | organelle fission | 254/7958 | 488/18723 | 1.07e-05 | 1.23e-04 | 254 |
| GO:0007031 | Liver | HCC | peroxisome organization | 23/7958 | 36/18723 | 7.85e-03 | 3.11e-02 | 23 |
| GO:00482852 | Oral cavity | OSCC | organelle fission | 265/7305 | 488/18723 | 3.22e-12 | 1.27e-10 | 265 |
| GO:003253519 | Oral cavity | OSCC | regulation of cellular component size | 201/7305 | 383/18723 | 4.80e-08 | 8.88e-07 | 201 |
| GO:00070312 | Oral cavity | OSCC | peroxisome organization | 23/7305 | 36/18723 | 2.19e-03 | 9.95e-03 | 23 |
| GO:0032535110 | Oral cavity | LP | regulation of cellular component size | 128/4623 | 383/18723 | 6.56e-05 | 8.80e-04 | 128 |
| GO:00070311 | Oral cavity | LP | peroxisome organization | 17/4623 | 36/18723 | 2.74e-03 | 1.92e-02 | 17 |
| GO:004828511 | Oral cavity | LP | organelle fission | 145/4623 | 488/18723 | 6.02e-03 | 3.57e-02 | 145 |
| Page: 1 |
| Pathway ID | Tissue | Disease Stage | Description | Gene Ratio | Bg Ratio | pvalue | p.adjust | qvalue | Count |
| hsa041467 | Esophagus | ESCC | Peroxisome | 55/4205 | 82/8465 | 1.04e-03 | 3.27e-03 | 1.68e-03 | 55 |
| hsa0414612 | Esophagus | ESCC | Peroxisome | 55/4205 | 82/8465 | 1.04e-03 | 3.27e-03 | 1.68e-03 | 55 |
| hsa041464 | Liver | HCC | Peroxisome | 58/4020 | 82/8465 | 1.57e-05 | 1.05e-04 | 5.85e-05 | 58 |
| hsa041465 | Liver | HCC | Peroxisome | 58/4020 | 82/8465 | 1.57e-05 | 1.05e-04 | 5.85e-05 | 58 |
| hsa041466 | Oral cavity | OSCC | Peroxisome | 47/3704 | 82/8465 | 9.01e-03 | 2.01e-02 | 1.03e-02 | 47 |
| hsa0414611 | Oral cavity | OSCC | Peroxisome | 47/3704 | 82/8465 | 9.01e-03 | 2.01e-02 | 1.03e-02 | 47 |
| hsa0414621 | Oral cavity | LP | Peroxisome | 33/2418 | 82/8465 | 1.48e-02 | 4.69e-02 | 3.03e-02 | 33 |
| hsa0414631 | Oral cavity | LP | Peroxisome | 33/2418 | 82/8465 | 1.48e-02 | 4.69e-02 | 3.03e-02 | 33 |
| Page: 1 |
Top |
Cell-cell communication analysis |
| Identification of potential cell-cell interactions between two cell types and their ligand-receptor pairs for different disease states |
| Ligand | Receptor | LRpair | Pathway | Tissue | Disease Stage |
| Page: 1 |
Top |
Single-cell gene regulatory network inference analysis |
| Find out the significant the regulons (TFs) and the target genes of each regulon across cell types for different disease states |
| TF | Cell Type | Tissue | Disease Stage | Target Gene | RSS | Regulon Activity |
| ∗The dot plots of a searched regulon are shown for all cell subpopulations in each disease state of each tissue based on the regulon specific score inferred using pySCENIC and by calculating the average expression. |
| Page: 1 |
Top |
Somatic mutation of malignant transformation related genes |
| Annotation of somatic variants for genes involved in malignant transformation |
| Hugo Symbol | Variant Class | Variant Classification | dbSNP RS | HGVSc | HGVSp | HGVSp Short | SWISSPROT | BIOTYPE | SIFT | PolyPhen | Tumor Sample Barcode | Tissue | Histology | Sex | Age | Stage | Therapy Types | Drugs | Outcome |
| PEX11B | SNV | Missense_Mutation | c.436N>G | p.Met146Val | p.M146V | O96011 | protein_coding | deleterious(0.03) | benign(0.081) | TCGA-A2-A0ST-01 | Breast | breast invasive carcinoma | Female | <65 | I/II | Chemotherapy | adriamycin | SD | |
| PEX11B | SNV | Missense_Mutation | c.175C>G | p.Leu59Val | p.L59V | O96011 | protein_coding | deleterious(0.01) | possibly_damaging(0.629) | TCGA-AC-A23H-01 | Breast | breast invasive carcinoma | Female | >=65 | I/II | Unknown | Unknown | PD | |
| PEX11B | SNV | Missense_Mutation | c.649G>T | p.Asp217Tyr | p.D217Y | O96011 | protein_coding | deleterious(0) | probably_damaging(0.966) | TCGA-AA-3977-01 | Colorectum | colon adenocarcinoma | Male | >=65 | I/II | Unknown | Unknown | SD | |
| PEX11B | SNV | Missense_Mutation | c.292G>A | p.Ala98Thr | p.A98T | O96011 | protein_coding | tolerated(0.17) | benign(0.223) | TCGA-AA-A00N-01 | Colorectum | colon adenocarcinoma | Male | >=65 | I/II | Unknown | Unknown | PD | |
| PEX11B | SNV | Missense_Mutation | novel | c.724N>C | p.Ser242Pro | p.S242P | O96011 | protein_coding | deleterious(0) | possibly_damaging(0.856) | TCGA-AA-A010-01 | Colorectum | colon adenocarcinoma | Female | <65 | I/II | Chemotherapy | folinic | CR |
| PEX11B | SNV | Missense_Mutation | c.340N>A | p.Val114Met | p.V114M | O96011 | protein_coding | tolerated(0.13) | possibly_damaging(0.744) | TCGA-G4-6302-01 | Colorectum | colon adenocarcinoma | Female | >=65 | I/II | Unknown | Unknown | SD | |
| PEX11B | SNV | Missense_Mutation | novel | c.500N>A | p.Gly167Glu | p.G167E | O96011 | protein_coding | tolerated(0.99) | possibly_damaging(0.741) | TCGA-A5-A0G2-01 | Endometrium | uterine corpus endometrioid carcinoma | Female | <65 | III/IV | Unknown | Unknown | SD |
| PEX11B | SNV | Missense_Mutation | novel | c.469C>A | p.Leu157Met | p.L157M | O96011 | protein_coding | tolerated(0.14) | benign(0.001) | TCGA-A5-A1OF-01 | Endometrium | uterine corpus endometrioid carcinoma | Female | <65 | I/II | Unknown | Unknown | SD |
| PEX11B | SNV | Missense_Mutation | novel | c.235N>A | p.Asp79Asn | p.D79N | O96011 | protein_coding | deleterious(0.02) | probably_damaging(0.944) | TCGA-AX-A06F-01 | Endometrium | uterine corpus endometrioid carcinoma | Female | <65 | III/IV | Chemotherapy | carboplatin | SD |
| PEX11B | SNV | Missense_Mutation | c.649N>A | p.Asp217Asn | p.D217N | O96011 | protein_coding | deleterious(0) | possibly_damaging(0.874) | TCGA-AX-A0J0-01 | Endometrium | uterine corpus endometrioid carcinoma | Female | <65 | I/II | Unknown | Unknown | SD |
| Page: 1 2 3 |
Top |
Related drugs of malignant transformation related genes |
| Identification of chemicals and drugs interact with genes involved in malignant transfromation |
| (DGIdb 4.0) |
| Entrez ID | Symbol | Category | Interaction Types | Drug Claim Name | Drug Name | PMIDs |
| Page: 1 |

Copyright 2023-Present -The University of Texas Health Science Center at Houston |