
|
|||||
|
 | |
| |
| |
| |
| |
| |
|
Gene: PEX11A |
Gene summary for PEX11A |
| Gene information | Species | Human | Gene symbol | PEX11A | Gene ID | 8800 |
| Gene name | peroxisomal biogenesis factor 11 alpha | |
| Gene Alias | PEX11-ALPHA | |
| Cytomap | 15q26.1 | |
| Gene Type | protein-coding | GO ID | GO:0006996 | UniProtAcc | B2R8C6 |
Top |
Malignant transformation analysis |
| Identification of the aberrant gene expression in precancerous and cancerous lesions by comparing the gene expression of stem-like cells in diseased tissues with normal stem cells |
| Entrez ID | Symbol | Replicates | Species | Organ | Tissue | Adj P-value | Log2FC | Malignancy |
| 8800 | PEX11A | HCC1_Meng | Human | Liver | HCC | 1.20e-28 | 2.75e-02 | 0.0246 |
| 8800 | PEX11A | S014 | Human | Liver | HCC | 1.26e-13 | 5.46e-01 | 0.2254 |
| 8800 | PEX11A | S015 | Human | Liver | HCC | 2.93e-09 | 7.01e-01 | 0.2375 |
| 8800 | PEX11A | S016 | Human | Liver | HCC | 5.32e-21 | 7.47e-01 | 0.2243 |
| 8800 | PEX11A | S028 | Human | Liver | HCC | 1.95e-04 | 2.70e-01 | 0.2503 |
| 8800 | PEX11A | S029 | Human | Liver | HCC | 4.39e-12 | 5.20e-01 | 0.2581 |
| Page: 1 |
| Tissue | Expression Dynamics | Abbreviation |
| Liver | 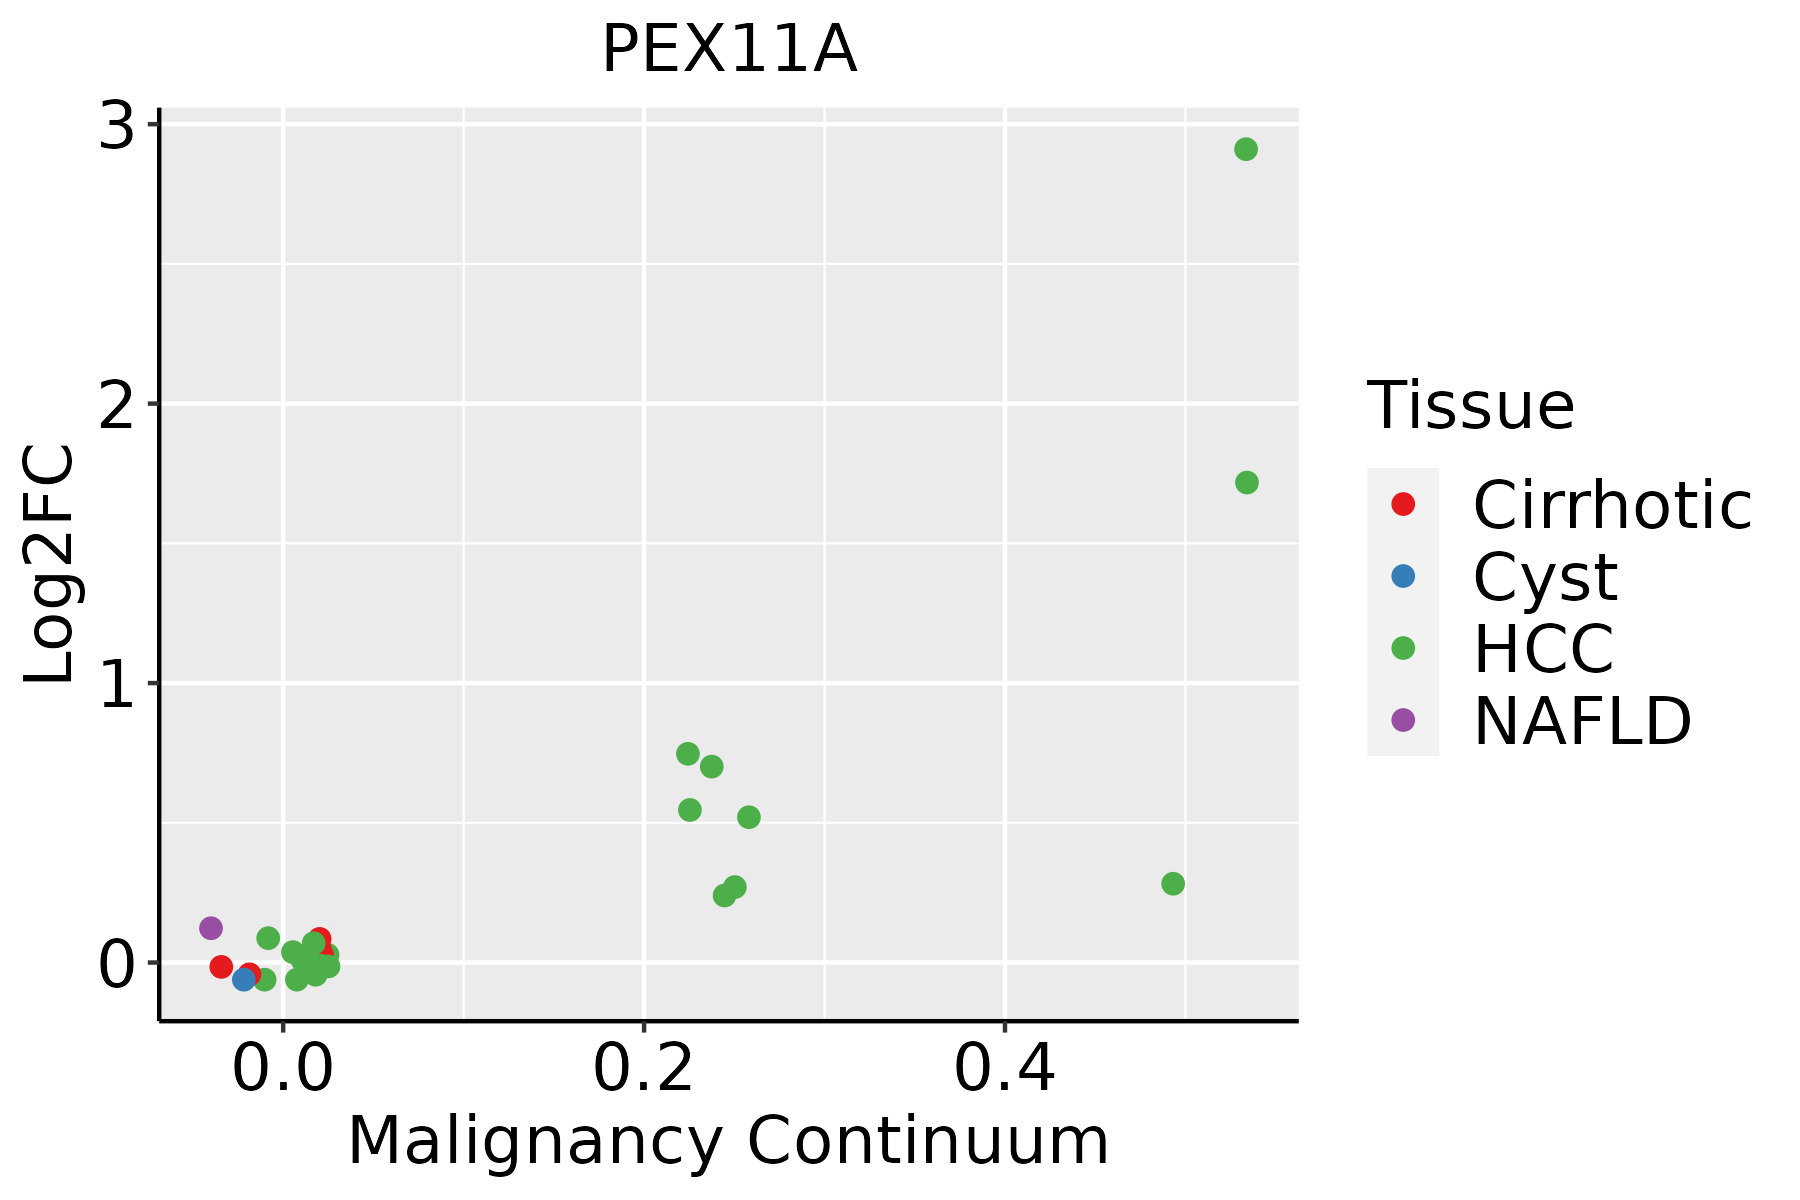 | HCC: Hepatocellular carcinoma |
| NAFLD: Non-alcoholic fatty liver disease |
| ∗log2FC in expression of this searched gene in stem-like cells from each diseased tissue sample relative to stem-like cells in normal samples in each tissue plotted against the malignancy continuum. Samples are colored based on if they are from different disease stage. |
Top |
Malignant transformation related pathway analysis |
| Find out the enriched GO biological processes and KEGG pathways involved in transition from healthy to precancer to cancer |
| Tissue | Disease Stage | Enriched GO biological Processes |
| Colorectum | AD |  |
| Colorectum | SER |  |
| Colorectum | MSS |  |
| Colorectum | MSI-H |  |
| Colorectum | FAP |  |
| ∗Top 15 enriched GO BP terms are showed in the bar plot of each disease state in each tissue. Each row represents a significant GO biological process which is colored according to the -log10(p.adjust). |
| Page: 1 2 3 4 5 6 7 8 9 |
| GO ID | Tissue | Disease Stage | Description | Gene Ratio | Bg Ratio | pvalue | p.adjust | Count |
| GO:003253522 | Liver | HCC | regulation of cellular component size | 217/7958 | 383/18723 | 1.28e-08 | 3.14e-07 | 217 |
| GO:0048285 | Liver | HCC | organelle fission | 254/7958 | 488/18723 | 1.07e-05 | 1.23e-04 | 254 |
| GO:004409111 | Liver | HCC | membrane biogenesis | 37/7958 | 55/18723 | 1.79e-04 | 1.41e-03 | 37 |
| GO:00454441 | Liver | HCC | fat cell differentiation | 120/7958 | 229/18723 | 1.52e-03 | 8.05e-03 | 120 |
| GO:0007031 | Liver | HCC | peroxisome organization | 23/7958 | 36/18723 | 7.85e-03 | 3.11e-02 | 23 |
| Page: 1 |
| Pathway ID | Tissue | Disease Stage | Description | Gene Ratio | Bg Ratio | pvalue | p.adjust | qvalue | Count |
| hsa041464 | Liver | HCC | Peroxisome | 58/4020 | 82/8465 | 1.57e-05 | 1.05e-04 | 5.85e-05 | 58 |
| hsa041465 | Liver | HCC | Peroxisome | 58/4020 | 82/8465 | 1.57e-05 | 1.05e-04 | 5.85e-05 | 58 |
| Page: 1 |
Top |
Cell-cell communication analysis |
| Identification of potential cell-cell interactions between two cell types and their ligand-receptor pairs for different disease states |
| Ligand | Receptor | LRpair | Pathway | Tissue | Disease Stage |
| Page: 1 |
Top |
Single-cell gene regulatory network inference analysis |
| Find out the significant the regulons (TFs) and the target genes of each regulon across cell types for different disease states |
| TF | Cell Type | Tissue | Disease Stage | Target Gene | RSS | Regulon Activity |
| ∗The dot plots of a searched regulon are shown for all cell subpopulations in each disease state of each tissue based on the regulon specific score inferred using pySCENIC and by calculating the average expression. |
| Page: 1 |
Top |
Somatic mutation of malignant transformation related genes |
| Annotation of somatic variants for genes involved in malignant transformation |
| Hugo Symbol | Variant Class | Variant Classification | dbSNP RS | HGVSc | HGVSp | HGVSp Short | SWISSPROT | BIOTYPE | SIFT | PolyPhen | Tumor Sample Barcode | Tissue | Histology | Sex | Age | Stage | Therapy Types | Drugs | Outcome |
| PEX11A | SNV | Missense_Mutation | c.721C>G | p.Gln241Glu | p.Q241E | O75192 | protein_coding | tolerated(0.23) | benign(0.026) | TCGA-AC-A23H-01 | Breast | breast invasive carcinoma | Female | >=65 | I/II | Unknown | Unknown | PD | |
| PEX11A | SNV | Missense_Mutation | novel | c.563N>C | p.Leu188Pro | p.L188P | O75192 | protein_coding | deleterious(0.01) | probably_damaging(0.997) | TCGA-C5-A7CK-01 | Cervix | cervical & endocervical cancer | Female | <65 | I/II | Chemotherapy | cisplatin | SD |
| PEX11A | SNV | Missense_Mutation | c.283N>T | p.Ile95Phe | p.I95F | O75192 | protein_coding | deleterious(0.04) | benign(0.007) | TCGA-AA-3956-01 | Colorectum | colon adenocarcinoma | Male | >=65 | I/II | Unknown | Unknown | SD | |
| PEX11A | SNV | Missense_Mutation | novel | c.170N>C | p.Lys57Thr | p.K57T | O75192 | protein_coding | deleterious(0.01) | probably_damaging(0.999) | TCGA-AP-A1DV-01 | Endometrium | uterine corpus endometrioid carcinoma | Female | <65 | I/II | Unknown | Unknown | SD |
| PEX11A | SNV | Missense_Mutation | rs146767422 | c.278N>A | p.Arg93His | p.R93H | O75192 | protein_coding | deleterious(0.03) | probably_damaging(1) | TCGA-B5-A11E-01 | Endometrium | uterine corpus endometrioid carcinoma | Female | <65 | I/II | Unknown | Unknown | SD |
| PEX11A | SNV | Missense_Mutation | novel | c.647N>C | p.Lys216Thr | p.K216T | O75192 | protein_coding | deleterious(0.01) | possibly_damaging(0.651) | TCGA-B5-A11N-01 | Endometrium | uterine corpus endometrioid carcinoma | Female | >=65 | I/II | Unknown | Unknown | SD |
| PEX11A | SNV | Missense_Mutation | rs531108695 | c.248N>A | p.Arg83His | p.R83H | O75192 | protein_coding | deleterious(0) | probably_damaging(0.95) | TCGA-B5-A11Y-01 | Endometrium | uterine corpus endometrioid carcinoma | Female | <65 | I/II | Unknown | Unknown | SD |
| PEX11A | SNV | Missense_Mutation | rs146767422 | c.278N>A | p.Arg93His | p.R93H | O75192 | protein_coding | deleterious(0.03) | probably_damaging(1) | TCGA-B5-A3FC-01 | Endometrium | uterine corpus endometrioid carcinoma | Female | <65 | I/II | Unknown | Unknown | SD |
| PEX11A | SNV | Missense_Mutation | c.465G>T | p.Lys155Asn | p.K155N | O75192 | protein_coding | tolerated(0.35) | possibly_damaging(0.448) | TCGA-BS-A0UF-01 | Endometrium | uterine corpus endometrioid carcinoma | Female | >=65 | I/II | Unknown | Unknown | SD | |
| PEX11A | SNV | Missense_Mutation | c.529N>T | p.Leu177Phe | p.L177F | O75192 | protein_coding | deleterious(0.02) | possibly_damaging(0.682) | TCGA-BS-A0UV-01 | Endometrium | uterine corpus endometrioid carcinoma | Female | <65 | III/IV | Unknown | Unknown | SD |
| Page: 1 2 3 |
Top |
Related drugs of malignant transformation related genes |
| Identification of chemicals and drugs interact with genes involved in malignant transfromation |
| (DGIdb 4.0) |
| Entrez ID | Symbol | Category | Interaction Types | Drug Claim Name | Drug Name | PMIDs |
| Page: 1 |

Copyright 2023-Present -The University of Texas Health Science Center at Houston |