
|
|||||
|
 | |
| |
| |
| |
| |
| |
|
Gene: PEX10 |
Gene summary for PEX10 |
| Gene information | Species | Human | Gene symbol | PEX10 | Gene ID | 5192 |
| Gene name | peroxisomal biogenesis factor 10 | |
| Gene Alias | NALD | |
| Cytomap | 1p36.32 | |
| Gene Type | protein-coding | GO ID | GO:0006605 | UniProtAcc | A0A024R068 |
Top |
Malignant transformation analysis |
| Identification of the aberrant gene expression in precancerous and cancerous lesions by comparing the gene expression of stem-like cells in diseased tissues with normal stem cells |
| Entrez ID | Symbol | Replicates | Species | Organ | Tissue | Adj P-value | Log2FC | Malignancy |
| 5192 | PEX10 | LZE4T | Human | Esophagus | ESCC | 1.00e-04 | 1.29e-01 | 0.0811 |
| 5192 | PEX10 | LZE20T | Human | Esophagus | ESCC | 1.44e-04 | 2.07e-01 | 0.0662 |
| 5192 | PEX10 | LZE22T | Human | Esophagus | ESCC | 2.78e-04 | 3.35e-01 | 0.068 |
| 5192 | PEX10 | LZE24T | Human | Esophagus | ESCC | 6.97e-26 | 6.25e-01 | 0.0596 |
| 5192 | PEX10 | LZE21T | Human | Esophagus | ESCC | 2.54e-02 | 3.75e-01 | 0.0655 |
| 5192 | PEX10 | P1T-E | Human | Esophagus | ESCC | 1.06e-19 | 6.30e-01 | 0.0875 |
| 5192 | PEX10 | P2T-E | Human | Esophagus | ESCC | 1.28e-41 | 6.85e-01 | 0.1177 |
| 5192 | PEX10 | P4T-E | Human | Esophagus | ESCC | 1.65e-41 | 9.61e-01 | 0.1323 |
| 5192 | PEX10 | P5T-E | Human | Esophagus | ESCC | 2.37e-17 | 3.55e-01 | 0.1327 |
| 5192 | PEX10 | P8T-E | Human | Esophagus | ESCC | 3.67e-23 | 5.33e-01 | 0.0889 |
| 5192 | PEX10 | P9T-E | Human | Esophagus | ESCC | 1.07e-10 | 2.43e-01 | 0.1131 |
| 5192 | PEX10 | P10T-E | Human | Esophagus | ESCC | 1.90e-30 | 5.29e-01 | 0.116 |
| 5192 | PEX10 | P11T-E | Human | Esophagus | ESCC | 2.49e-12 | 5.65e-01 | 0.1426 |
| 5192 | PEX10 | P12T-E | Human | Esophagus | ESCC | 9.32e-27 | 5.22e-01 | 0.1122 |
| 5192 | PEX10 | P15T-E | Human | Esophagus | ESCC | 1.36e-16 | 3.99e-01 | 0.1149 |
| 5192 | PEX10 | P16T-E | Human | Esophagus | ESCC | 6.10e-21 | 4.61e-01 | 0.1153 |
| 5192 | PEX10 | P17T-E | Human | Esophagus | ESCC | 1.73e-09 | 3.47e-01 | 0.1278 |
| 5192 | PEX10 | P19T-E | Human | Esophagus | ESCC | 8.61e-12 | 9.85e-01 | 0.1662 |
| 5192 | PEX10 | P20T-E | Human | Esophagus | ESCC | 3.82e-26 | 6.00e-01 | 0.1124 |
| 5192 | PEX10 | P21T-E | Human | Esophagus | ESCC | 4.20e-39 | 7.73e-01 | 0.1617 |
| Page: 1 2 3 4 5 |
| Tissue | Expression Dynamics | Abbreviation |
| Esophagus | 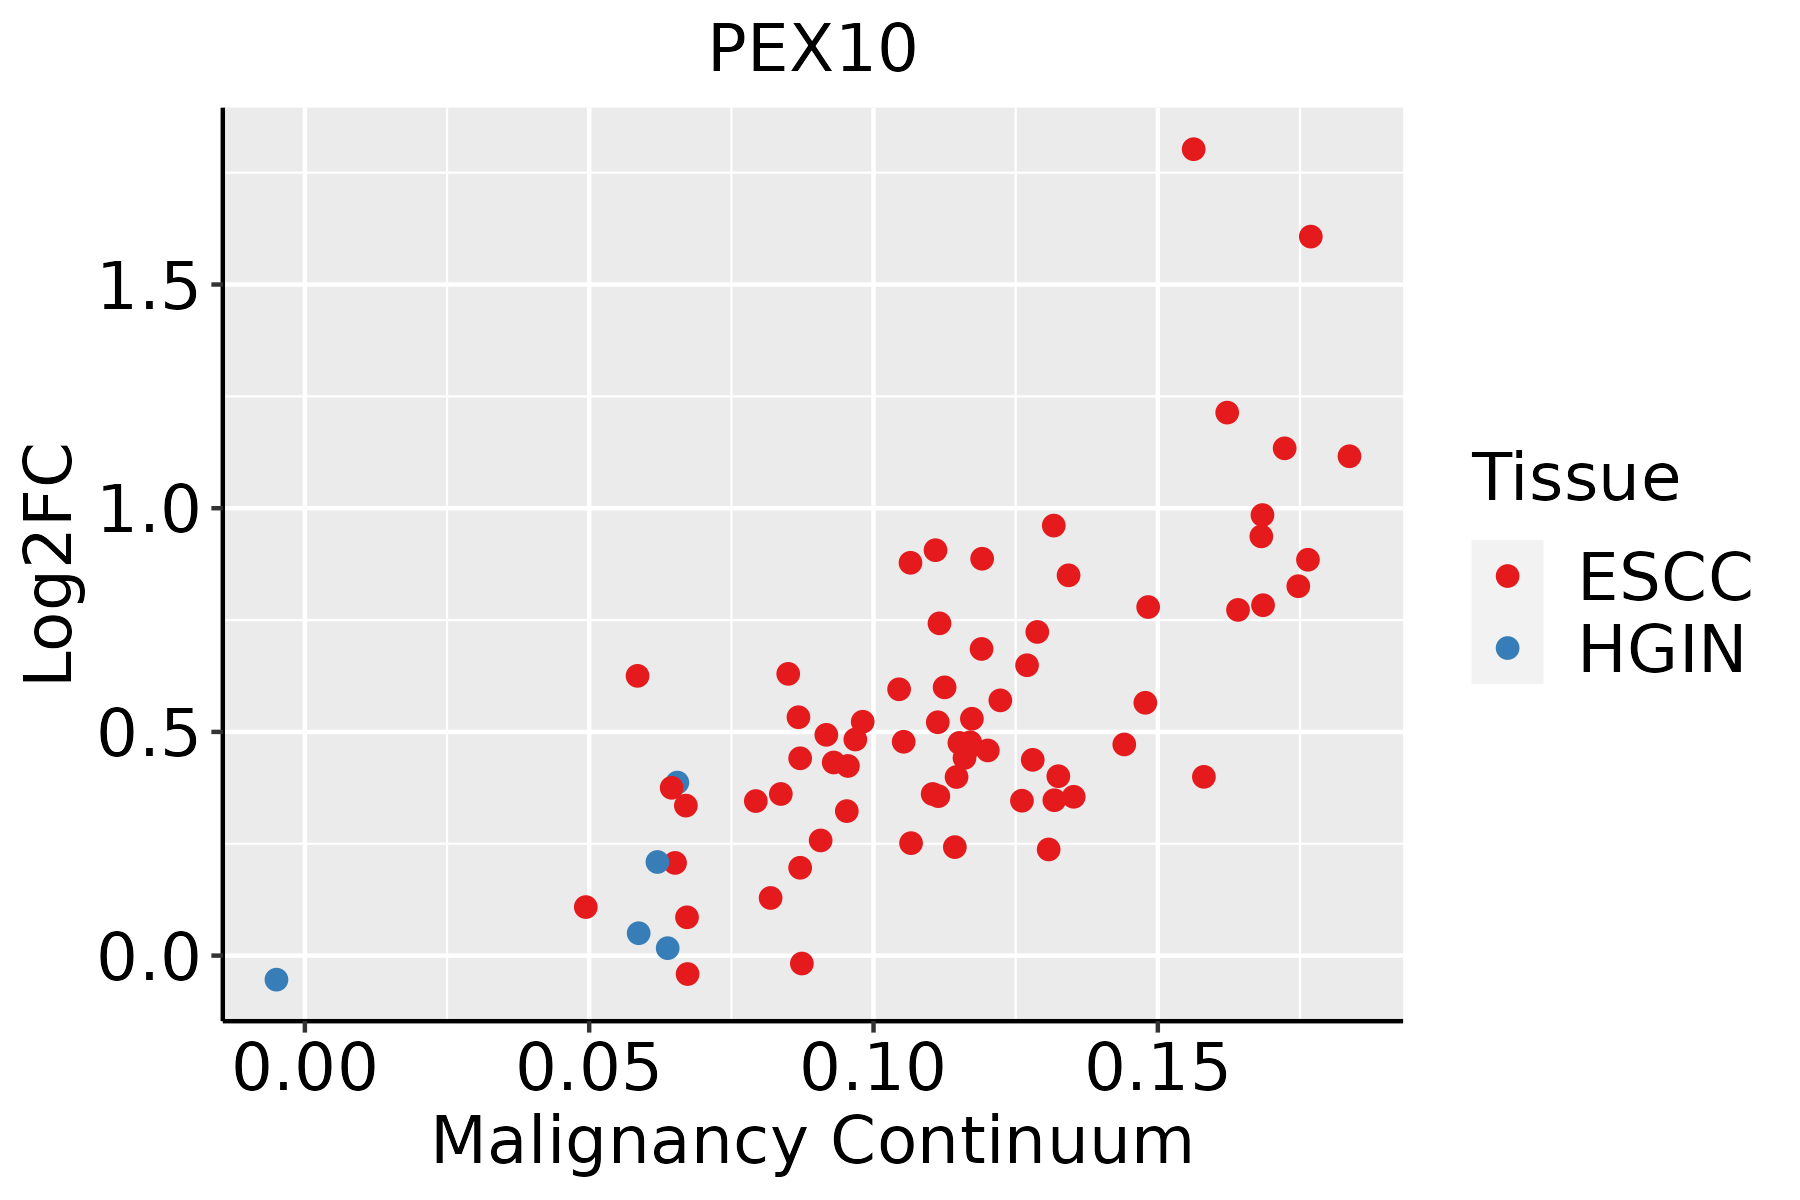 | ESCC: Esophageal squamous cell carcinoma |
| HGIN: High-grade intraepithelial neoplasias | ||
| LGIN: Low-grade intraepithelial neoplasias | ||
| Liver |  | HCC: Hepatocellular carcinoma |
| NAFLD: Non-alcoholic fatty liver disease | ||
| Oral Cavity |  | EOLP: Erosive Oral lichen planus |
| LP: leukoplakia | ||
| NEOLP: Non-erosive oral lichen planus | ||
| OSCC: Oral squamous cell carcinoma |
| ∗log2FC in expression of this searched gene in stem-like cells from each diseased tissue sample relative to stem-like cells in normal samples in each tissue plotted against the malignancy continuum. Samples are colored based on if they are from different disease stage. |
Top |
Malignant transformation related pathway analysis |
| Find out the enriched GO biological processes and KEGG pathways involved in transition from healthy to precancer to cancer |
| Tissue | Disease Stage | Enriched GO biological Processes |
| Colorectum | AD |  |
| Colorectum | SER |  |
| Colorectum | MSS |  |
| Colorectum | MSI-H |  |
| Colorectum | FAP |  |
| ∗Top 15 enriched GO BP terms are showed in the bar plot of each disease state in each tissue. Each row represents a significant GO biological process which is colored according to the -log10(p.adjust). |
| Page: 1 2 3 4 5 6 7 8 9 |
| GO ID | Tissue | Disease Stage | Description | Gene Ratio | Bg Ratio | pvalue | p.adjust | Count |
| GO:0072594110 | Esophagus | ESCC | establishment of protein localization to organelle | 311/8552 | 422/18723 | 3.02e-32 | 2.13e-29 | 311 |
| GO:0006605111 | Esophagus | ESCC | protein targeting | 229/8552 | 314/18723 | 4.93e-23 | 1.01e-20 | 229 |
| GO:001703818 | Esophagus | ESCC | protein import | 149/8552 | 206/18723 | 5.90e-15 | 3.31e-13 | 149 |
| GO:00718069 | Esophagus | ESCC | protein transmembrane transport | 47/8552 | 59/18723 | 9.02e-08 | 1.51e-06 | 47 |
| GO:00650026 | Esophagus | ESCC | intracellular protein transmembrane transport | 40/8552 | 51/18723 | 1.76e-06 | 2.08e-05 | 40 |
| GO:00447433 | Esophagus | ESCC | protein transmembrane import into intracellular organelle | 29/8552 | 36/18723 | 1.91e-05 | 1.67e-04 | 29 |
| GO:00066252 | Esophagus | ESCC | protein targeting to peroxisome | 14/8552 | 18/18723 | 5.77e-03 | 2.14e-02 | 14 |
| GO:00726622 | Esophagus | ESCC | protein localization to peroxisome | 14/8552 | 18/18723 | 5.77e-03 | 2.14e-02 | 14 |
| GO:00726632 | Esophagus | ESCC | establishment of protein localization to peroxisome | 14/8552 | 18/18723 | 5.77e-03 | 2.14e-02 | 14 |
| GO:00435742 | Esophagus | ESCC | peroxisomal transport | 16/8552 | 22/18723 | 9.46e-03 | 3.28e-02 | 16 |
| GO:007259422 | Liver | HCC | establishment of protein localization to organelle | 299/7958 | 422/18723 | 1.06e-32 | 6.10e-30 | 299 |
| GO:000660512 | Liver | HCC | protein targeting | 219/7958 | 314/18723 | 7.74e-23 | 1.49e-20 | 219 |
| GO:001703811 | Liver | HCC | protein import | 140/7958 | 206/18723 | 1.12e-13 | 6.46e-12 | 140 |
| GO:007180611 | Liver | HCC | protein transmembrane transport | 47/7958 | 59/18723 | 5.82e-09 | 1.51e-07 | 47 |
| GO:006500211 | Liver | HCC | intracellular protein transmembrane transport | 41/7958 | 51/18723 | 3.41e-08 | 7.61e-07 | 41 |
| GO:00447431 | Liver | HCC | protein transmembrane import into intracellular organelle | 29/7958 | 36/18723 | 3.42e-06 | 4.49e-05 | 29 |
| GO:0007031 | Liver | HCC | peroxisome organization | 23/7958 | 36/18723 | 7.85e-03 | 3.11e-02 | 23 |
| GO:007259418 | Oral cavity | OSCC | establishment of protein localization to organelle | 284/7305 | 422/18723 | 1.50e-32 | 1.35e-29 | 284 |
| GO:000660520 | Oral cavity | OSCC | protein targeting | 204/7305 | 314/18723 | 6.78e-21 | 1.13e-18 | 204 |
| GO:001703815 | Oral cavity | OSCC | protein import | 136/7305 | 206/18723 | 3.15e-15 | 2.08e-13 | 136 |
| Page: 1 2 3 |
| Pathway ID | Tissue | Disease Stage | Description | Gene Ratio | Bg Ratio | pvalue | p.adjust | qvalue | Count |
| hsa041467 | Esophagus | ESCC | Peroxisome | 55/4205 | 82/8465 | 1.04e-03 | 3.27e-03 | 1.68e-03 | 55 |
| hsa0414612 | Esophagus | ESCC | Peroxisome | 55/4205 | 82/8465 | 1.04e-03 | 3.27e-03 | 1.68e-03 | 55 |
| hsa041464 | Liver | HCC | Peroxisome | 58/4020 | 82/8465 | 1.57e-05 | 1.05e-04 | 5.85e-05 | 58 |
| hsa041465 | Liver | HCC | Peroxisome | 58/4020 | 82/8465 | 1.57e-05 | 1.05e-04 | 5.85e-05 | 58 |
| hsa041466 | Oral cavity | OSCC | Peroxisome | 47/3704 | 82/8465 | 9.01e-03 | 2.01e-02 | 1.03e-02 | 47 |
| hsa0414611 | Oral cavity | OSCC | Peroxisome | 47/3704 | 82/8465 | 9.01e-03 | 2.01e-02 | 1.03e-02 | 47 |
| hsa0414621 | Oral cavity | LP | Peroxisome | 33/2418 | 82/8465 | 1.48e-02 | 4.69e-02 | 3.03e-02 | 33 |
| hsa0414631 | Oral cavity | LP | Peroxisome | 33/2418 | 82/8465 | 1.48e-02 | 4.69e-02 | 3.03e-02 | 33 |
| Page: 1 |
Top |
Cell-cell communication analysis |
| Identification of potential cell-cell interactions between two cell types and their ligand-receptor pairs for different disease states |
| Ligand | Receptor | LRpair | Pathway | Tissue | Disease Stage |
| Page: 1 |
Top |
Single-cell gene regulatory network inference analysis |
| Find out the significant the regulons (TFs) and the target genes of each regulon across cell types for different disease states |
| TF | Cell Type | Tissue | Disease Stage | Target Gene | RSS | Regulon Activity |
| ∗The dot plots of a searched regulon are shown for all cell subpopulations in each disease state of each tissue based on the regulon specific score inferred using pySCENIC and by calculating the average expression. |
| Page: 1 |
Top |
Somatic mutation of malignant transformation related genes |
| Annotation of somatic variants for genes involved in malignant transformation |
| Hugo Symbol | Variant Class | Variant Classification | dbSNP RS | HGVSc | HGVSp | HGVSp Short | SWISSPROT | BIOTYPE | SIFT | PolyPhen | Tumor Sample Barcode | Tissue | Histology | Sex | Age | Stage | Therapy Types | Drugs | Outcome |
| PEX10 | SNV | Missense_Mutation | rs556603981 | c.925N>A | p.Gly309Ser | p.G309S | O60683 | protein_coding | deleterious(0) | probably_damaging(1) | TCGA-AN-A0AK-01 | Breast | breast invasive carcinoma | Female | >=65 | I/II | Unknown | Unknown | SD |
| PEX10 | SNV | Missense_Mutation | rs769847524 | c.266C>T | p.Ser89Leu | p.S89L | O60683 | protein_coding | tolerated(0.71) | benign(0) | TCGA-E2-A10C-01 | Breast | breast invasive carcinoma | Female | <65 | I/II | Chemotherapy | cytoxan | SD |
| PEX10 | SNV | Missense_Mutation | rs779337517 | c.476C>T | p.Ala159Val | p.A159V | O60683 | protein_coding | tolerated(0.38) | benign(0.015) | TCGA-2W-A8YY-01 | Cervix | cervical & endocervical cancer | Female | <65 | I/II | Chemotherapy | cisplatin | CR |
| PEX10 | SNV | Missense_Mutation | rs778322648 | c.422N>T | p.Ala141Val | p.A141V | O60683 | protein_coding | tolerated(1) | benign(0.001) | TCGA-AD-6895-01 | Colorectum | colon adenocarcinoma | Male | >=65 | III/IV | Unknown | Unknown | SD |
| PEX10 | SNV | Missense_Mutation | c.575N>A | p.Ala192Asp | p.A192D | O60683 | protein_coding | deleterious(0) | probably_damaging(0.971) | TCGA-G4-6586-01 | Colorectum | colon adenocarcinoma | Female | >=65 | I/II | Unknown | Unknown | SD | |
| PEX10 | SNV | Missense_Mutation | rs78620392 | c.956C>T | p.Ala319Val | p.A319V | O60683 | protein_coding | deleterious(0) | benign(0.098) | TCGA-AX-A1CE-01 | Endometrium | uterine corpus endometrioid carcinoma | Female | <65 | I/II | Unspecific | Paclitaxel | SD |
| PEX10 | SNV | Missense_Mutation | rs762111818 | c.245C>T | p.Ser82Leu | p.S82L | O60683 | protein_coding | deleterious(0) | benign(0.355) | TCGA-AX-A2HA-01 | Endometrium | uterine corpus endometrioid carcinoma | Female | <65 | I/II | Unknown | Unknown | SD |
| PEX10 | SNV | Missense_Mutation | rs149421567 | c.116C>T | p.Ala39Val | p.A39V | O60683 | protein_coding | deleterious(0) | benign(0.131) | TCGA-AX-A2HC-01 | Endometrium | uterine corpus endometrioid carcinoma | Female | <65 | III/IV | Chemotherapy | paclitaxel | PD |
| PEX10 | SNV | Missense_Mutation | novel | c.536N>C | p.Val179Ala | p.V179A | O60683 | protein_coding | deleterious(0.03) | benign(0.161) | TCGA-B5-A3FA-01 | Endometrium | uterine corpus endometrioid carcinoma | Female | >=65 | I/II | Unknown | Unknown | SD |
| PEX10 | SNV | Missense_Mutation | rs78620392 | c.956N>T | p.Ala319Val | p.A319V | O60683 | protein_coding | deleterious(0) | benign(0.098) | TCGA-D1-A174-01 | Endometrium | uterine corpus endometrioid carcinoma | Female | <65 | I/II | Unknown | Unknown | SD |
| Page: 1 2 |
Top |
Related drugs of malignant transformation related genes |
| Identification of chemicals and drugs interact with genes involved in malignant transfromation |
| (DGIdb 4.0) |
| Entrez ID | Symbol | Category | Interaction Types | Drug Claim Name | Drug Name | PMIDs |
| Page: 1 |

Copyright 2023-Present -The University of Texas Health Science Center at Houston |