
|
|||||
|
 | |
| |
| |
| |
| |
| |
|
Gene: PET117 |
Gene summary for PET117 |
| Gene information | Species | Human | Gene symbol | PET117 | Gene ID | 100303755 |
| Gene name | PET117 cytochrome c oxidase chaperone | |
| Gene Alias | CSRP2BP | |
| Cytomap | 20p11.23 | |
| Gene Type | protein-coding | GO ID | GO:0006996 | UniProtAcc | L0R6F6 |
Top |
Malignant transformation analysis |
| Identification of the aberrant gene expression in precancerous and cancerous lesions by comparing the gene expression of stem-like cells in diseased tissues with normal stem cells |
| Entrez ID | Symbol | Replicates | Species | Organ | Tissue | Adj P-value | Log2FC | Malignancy |
| 100303755 | PET117 | LZE4T | Human | Esophagus | ESCC | 3.45e-02 | 1.60e-01 | 0.0811 |
| 100303755 | PET117 | LZE24T | Human | Esophagus | ESCC | 1.62e-08 | 2.59e-01 | 0.0596 |
| 100303755 | PET117 | P2T-E | Human | Esophagus | ESCC | 2.01e-08 | 2.57e-01 | 0.1177 |
| 100303755 | PET117 | P4T-E | Human | Esophagus | ESCC | 6.82e-05 | 2.03e-01 | 0.1323 |
| 100303755 | PET117 | P5T-E | Human | Esophagus | ESCC | 6.35e-05 | 1.17e-01 | 0.1327 |
| 100303755 | PET117 | P8T-E | Human | Esophagus | ESCC | 1.55e-06 | 1.09e-01 | 0.0889 |
| 100303755 | PET117 | P9T-E | Human | Esophagus | ESCC | 5.71e-03 | 1.69e-01 | 0.1131 |
| 100303755 | PET117 | P10T-E | Human | Esophagus | ESCC | 3.80e-17 | 3.43e-01 | 0.116 |
| 100303755 | PET117 | P11T-E | Human | Esophagus | ESCC | 2.62e-11 | 5.18e-01 | 0.1426 |
| 100303755 | PET117 | P12T-E | Human | Esophagus | ESCC | 3.30e-15 | 3.18e-01 | 0.1122 |
| 100303755 | PET117 | P15T-E | Human | Esophagus | ESCC | 1.70e-09 | 1.82e-01 | 0.1149 |
| 100303755 | PET117 | P16T-E | Human | Esophagus | ESCC | 9.30e-26 | 4.00e-01 | 0.1153 |
| 100303755 | PET117 | P17T-E | Human | Esophagus | ESCC | 1.88e-04 | 3.11e-01 | 0.1278 |
| 100303755 | PET117 | P20T-E | Human | Esophagus | ESCC | 3.21e-11 | 2.47e-01 | 0.1124 |
| 100303755 | PET117 | P21T-E | Human | Esophagus | ESCC | 1.38e-17 | 4.11e-01 | 0.1617 |
| 100303755 | PET117 | P22T-E | Human | Esophagus | ESCC | 1.08e-19 | 3.43e-01 | 0.1236 |
| 100303755 | PET117 | P23T-E | Human | Esophagus | ESCC | 1.91e-11 | 3.87e-01 | 0.108 |
| 100303755 | PET117 | P24T-E | Human | Esophagus | ESCC | 8.15e-09 | 1.85e-01 | 0.1287 |
| 100303755 | PET117 | P26T-E | Human | Esophagus | ESCC | 1.54e-22 | 4.75e-01 | 0.1276 |
| 100303755 | PET117 | P27T-E | Human | Esophagus | ESCC | 1.93e-07 | 1.68e-01 | 0.1055 |
| Page: 1 2 3 4 |
| Tissue | Expression Dynamics | Abbreviation |
| Esophagus | 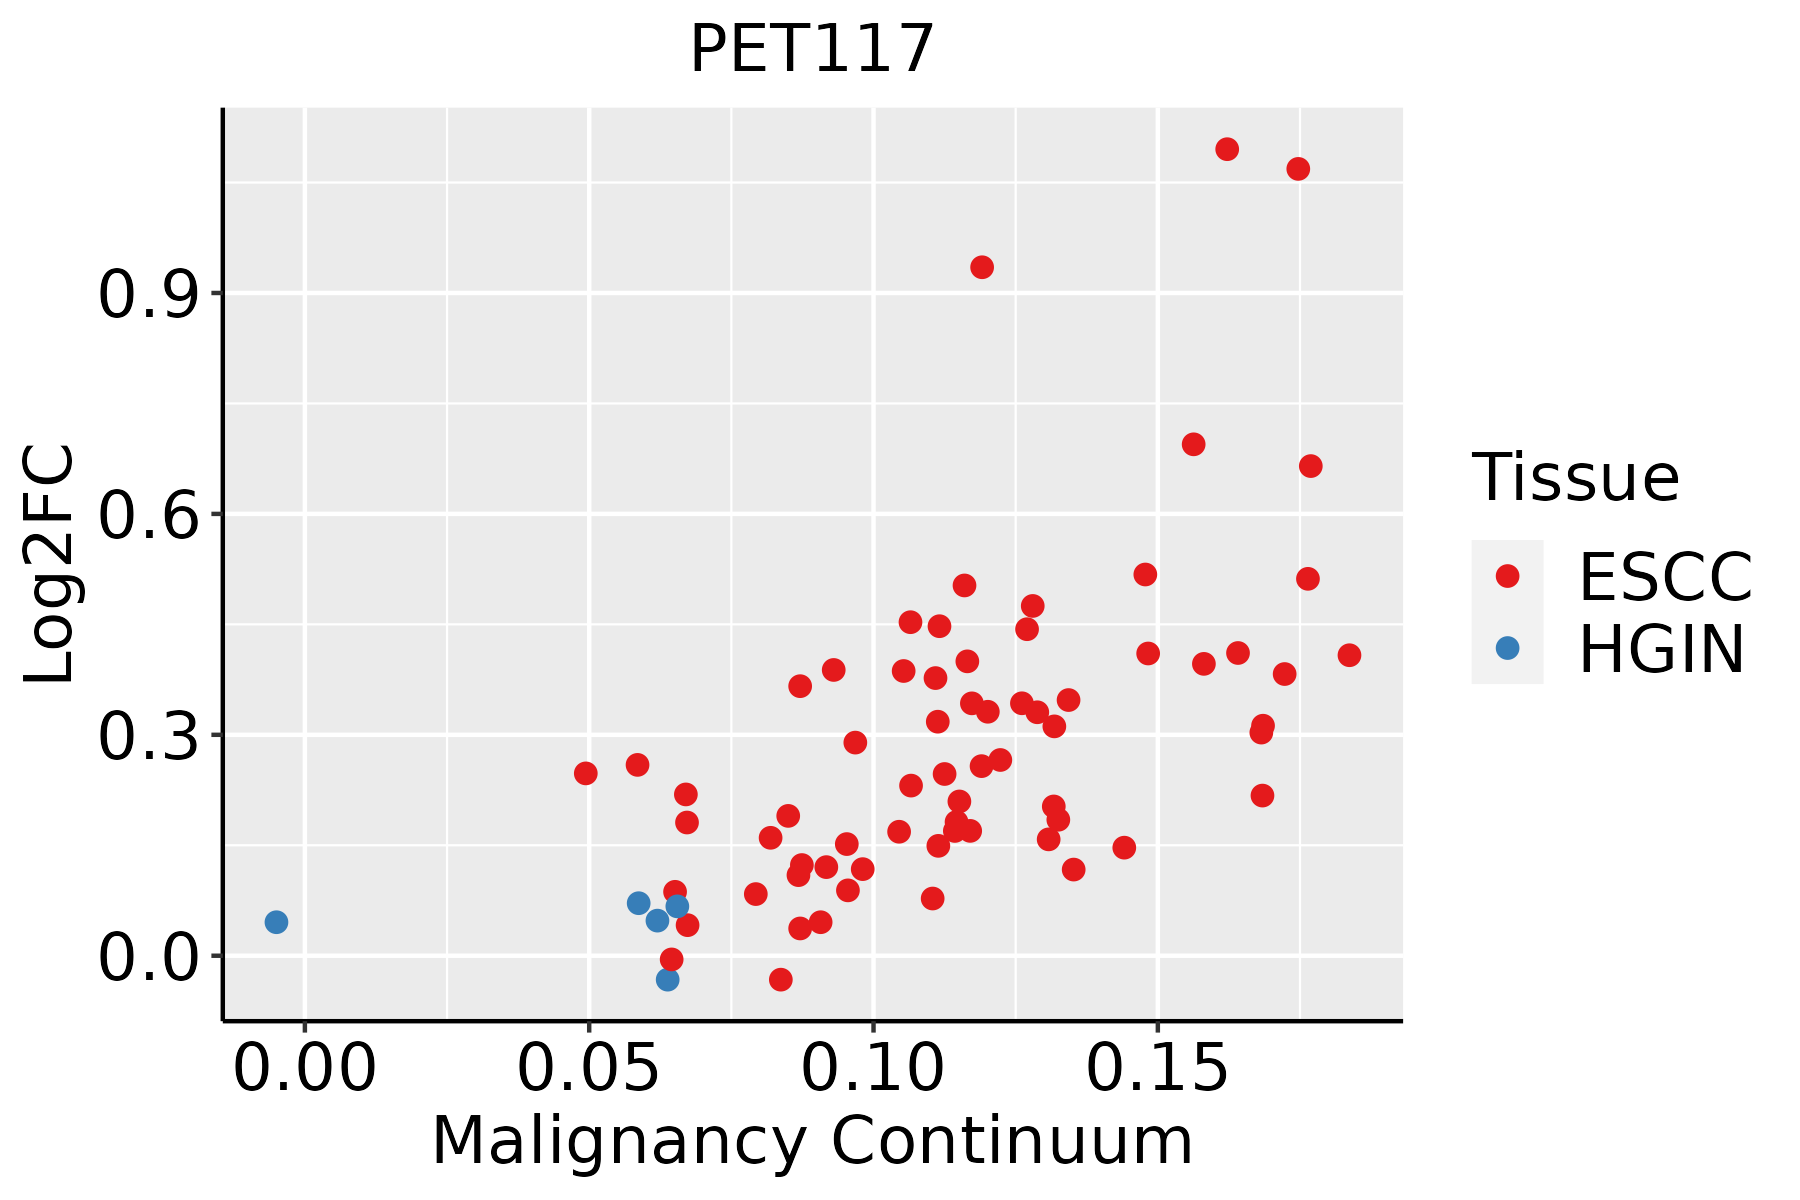 | ESCC: Esophageal squamous cell carcinoma |
| HGIN: High-grade intraepithelial neoplasias | ||
| LGIN: Low-grade intraepithelial neoplasias | ||
| Liver |  | HCC: Hepatocellular carcinoma |
| NAFLD: Non-alcoholic fatty liver disease | ||
| Oral Cavity | 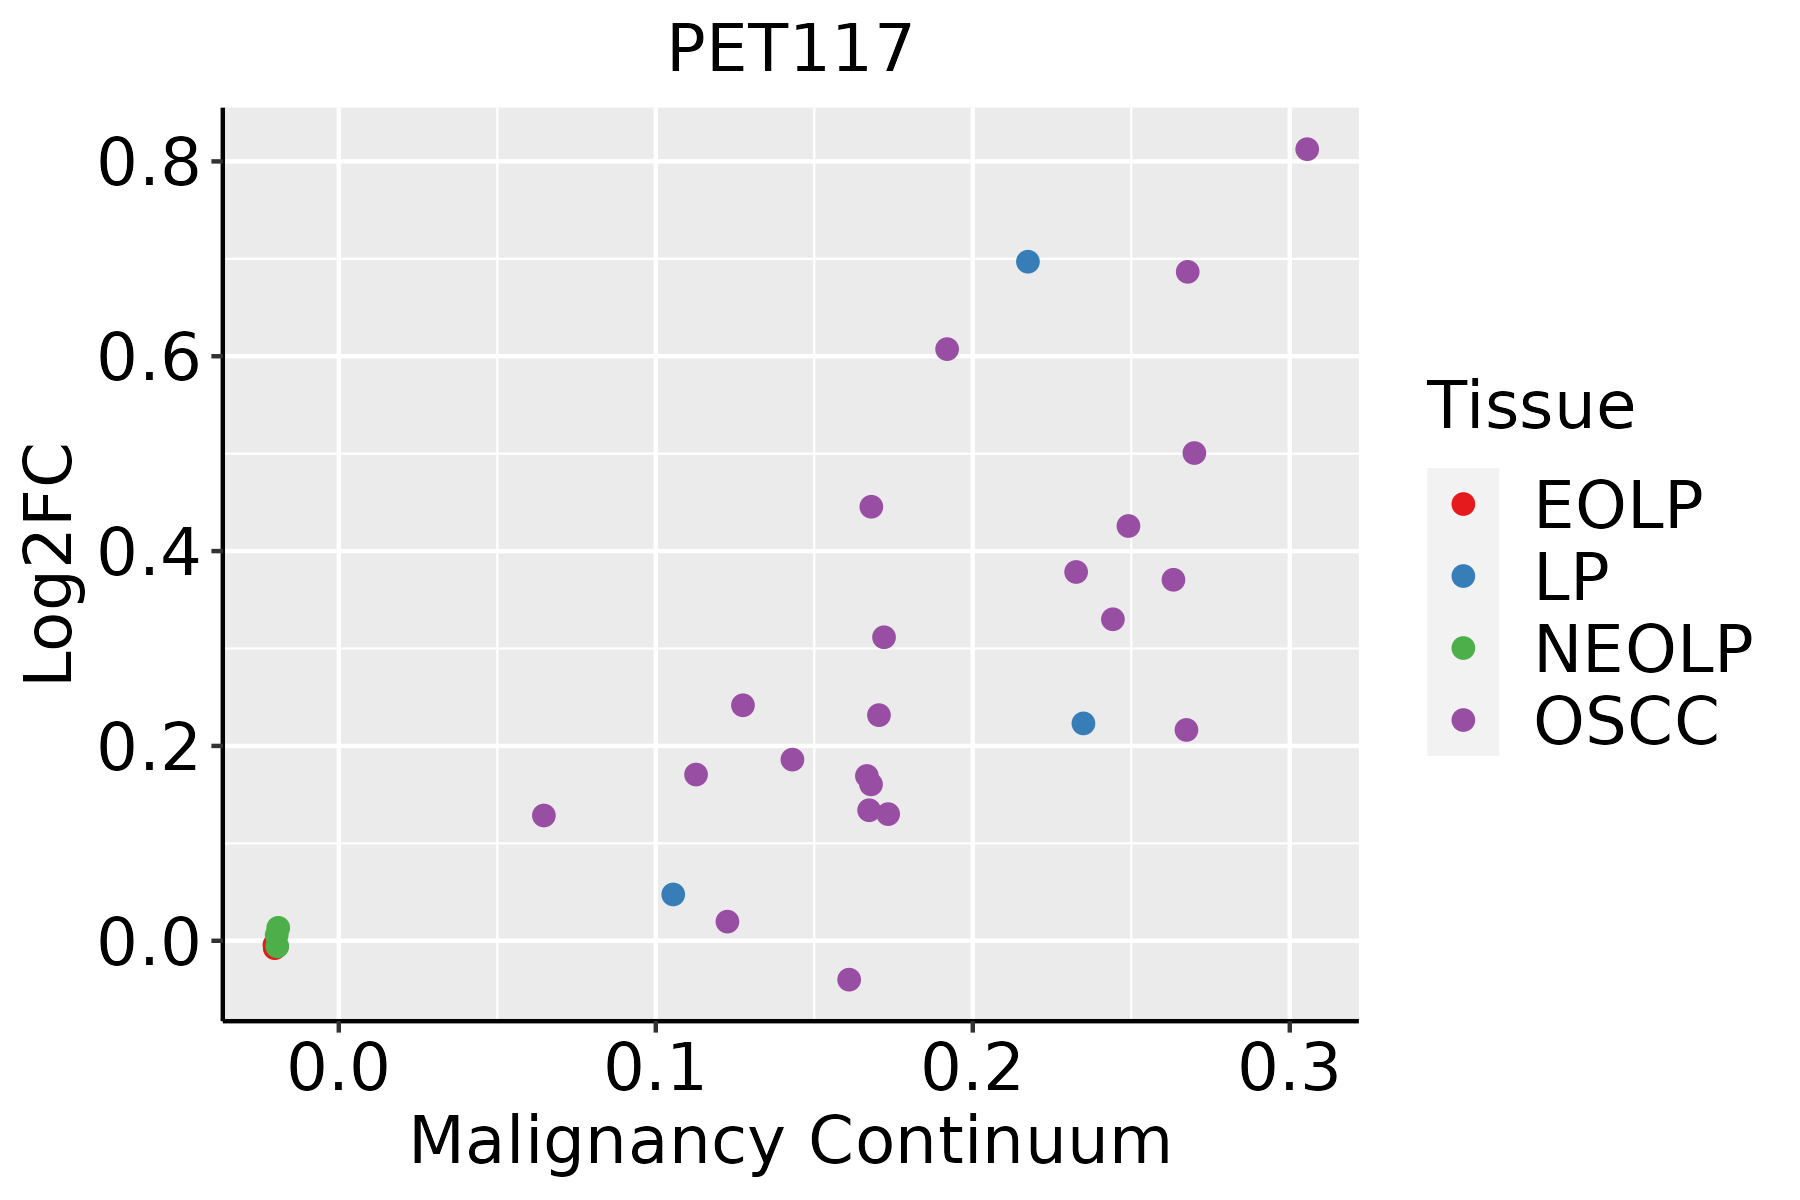 | EOLP: Erosive Oral lichen planus |
| LP: leukoplakia | ||
| NEOLP: Non-erosive oral lichen planus | ||
| OSCC: Oral squamous cell carcinoma |
| ∗log2FC in expression of this searched gene in stem-like cells from each diseased tissue sample relative to stem-like cells in normal samples in each tissue plotted against the malignancy continuum. Samples are colored based on if they are from different disease stage. |
Top |
Malignant transformation related pathway analysis |
| Find out the enriched GO biological processes and KEGG pathways involved in transition from healthy to precancer to cancer |
| Tissue | Disease Stage | Enriched GO biological Processes |
| Colorectum | AD |  |
| Colorectum | SER |  |
| Colorectum | MSS |  |
| Colorectum | MSI-H |  |
| Colorectum | FAP |  |
| ∗Top 15 enriched GO BP terms are showed in the bar plot of each disease state in each tissue. Each row represents a significant GO biological process which is colored according to the -log10(p.adjust). |
| Page: 1 2 3 4 5 6 7 8 9 |
| GO ID | Tissue | Disease Stage | Description | Gene Ratio | Bg Ratio | pvalue | p.adjust | Count |
| GO:0033108110 | Esophagus | ESCC | mitochondrial respiratory chain complex assembly | 83/8552 | 93/18723 | 9.56e-19 | 1.05e-16 | 83 |
| GO:001700413 | Esophagus | ESCC | cytochrome complex assembly | 34/8552 | 36/18723 | 5.08e-10 | 1.31e-08 | 34 |
| GO:000853512 | Esophagus | ESCC | respiratory chain complex IV assembly | 24/8552 | 26/18723 | 6.87e-07 | 8.99e-06 | 24 |
| GO:003361712 | Esophagus | ESCC | mitochondrial cytochrome c oxidase assembly | 21/8552 | 22/18723 | 8.75e-07 | 1.13e-05 | 21 |
| GO:003310812 | Liver | HCC | mitochondrial respiratory chain complex assembly | 80/7958 | 93/18723 | 3.47e-18 | 4.15e-16 | 80 |
| GO:00170041 | Liver | HCC | cytochrome complex assembly | 30/7958 | 36/18723 | 5.69e-07 | 9.03e-06 | 30 |
| GO:00336171 | Liver | HCC | mitochondrial cytochrome c oxidase assembly | 20/7958 | 22/18723 | 3.00e-06 | 3.98e-05 | 20 |
| GO:00085351 | Liver | HCC | respiratory chain complex IV assembly | 22/7958 | 26/18723 | 1.23e-05 | 1.39e-04 | 22 |
| GO:003310818 | Oral cavity | OSCC | mitochondrial respiratory chain complex assembly | 75/7305 | 93/18723 | 2.17e-16 | 1.68e-14 | 75 |
| GO:00170043 | Oral cavity | OSCC | cytochrome complex assembly | 31/7305 | 36/18723 | 7.28e-09 | 1.53e-07 | 31 |
| GO:00336172 | Oral cavity | OSCC | mitochondrial cytochrome c oxidase assembly | 19/7305 | 22/18723 | 6.52e-06 | 7.21e-05 | 19 |
| GO:00085352 | Oral cavity | OSCC | respiratory chain complex IV assembly | 21/7305 | 26/18723 | 1.66e-05 | 1.64e-04 | 21 |
| GO:003310819 | Oral cavity | LP | mitochondrial respiratory chain complex assembly | 63/4623 | 93/18723 | 2.24e-18 | 4.13e-16 | 63 |
| GO:001700412 | Oral cavity | LP | cytochrome complex assembly | 25/4623 | 36/18723 | 1.93e-08 | 7.11e-07 | 25 |
| GO:003361711 | Oral cavity | LP | mitochondrial cytochrome c oxidase assembly | 17/4623 | 22/18723 | 3.24e-07 | 9.53e-06 | 17 |
| GO:000853511 | Oral cavity | LP | respiratory chain complex IV assembly | 18/4623 | 26/18723 | 2.13e-06 | 4.81e-05 | 18 |
| Page: 1 |
| Pathway ID | Tissue | Disease Stage | Description | Gene Ratio | Bg Ratio | pvalue | p.adjust | qvalue | Count |
| Page: 1 |
Top |
Cell-cell communication analysis |
| Identification of potential cell-cell interactions between two cell types and their ligand-receptor pairs for different disease states |
| Ligand | Receptor | LRpair | Pathway | Tissue | Disease Stage |
| Page: 1 |
Top |
Single-cell gene regulatory network inference analysis |
| Find out the significant the regulons (TFs) and the target genes of each regulon across cell types for different disease states |
| TF | Cell Type | Tissue | Disease Stage | Target Gene | RSS | Regulon Activity |
| ∗The dot plots of a searched regulon are shown for all cell subpopulations in each disease state of each tissue based on the regulon specific score inferred using pySCENIC and by calculating the average expression. |
| Page: 1 |
Top |
Somatic mutation of malignant transformation related genes |
| Annotation of somatic variants for genes involved in malignant transformation |
| Hugo Symbol | Variant Class | Variant Classification | dbSNP RS | HGVSc | HGVSp | HGVSp Short | SWISSPROT | BIOTYPE | SIFT | PolyPhen | Tumor Sample Barcode | Tissue | Histology | Sex | Age | Stage | Therapy Types | Drugs | Outcome |
| PET117 | SNV | Missense_Mutation | rs76168870 | c.139N>T | p.Arg47Trp | p.R47W | Q6UWS5 | protein_coding | deleterious(0.03) | possibly_damaging(0.793) | TCGA-BS-A0UV-01 | Endometrium | uterine corpus endometrioid carcinoma | Female | <65 | III/IV | Unknown | Unknown | SD |
| PET117 | insertion | Frame_Shift_Ins | novel | c.141_142insA | p.Glu50ArgfsTer14 | p.E50Rfs*14 | Q6UWS5 | protein_coding | TCGA-EO-A22U-01 | Endometrium | uterine corpus endometrioid carcinoma | Female | >=65 | I/II | Unknown | Unknown | SD |
| Page: 1 |
Top |
Related drugs of malignant transformation related genes |
| Identification of chemicals and drugs interact with genes involved in malignant transfromation |
| (DGIdb 4.0) |
| Entrez ID | Symbol | Category | Interaction Types | Drug Claim Name | Drug Name | PMIDs |
| Page: 1 |

Copyright 2023-Present -The University of Texas Health Science Center at Houston |