
|
|||||
|
 | |
| |
| |
| |
| |
| |
|
Gene: PET100 |
Gene summary for PET100 |
| Gene information | Species | Human | Gene symbol | PET100 | Gene ID | 100131801 |
| Gene name | PET100 cytochrome c oxidase chaperone | |
| Gene Alias | C19orf79 | |
| Cytomap | 19p13.2 | |
| Gene Type | protein-coding | GO ID | GO:0006996 | UniProtAcc | P0DJ07 |
Top |
Malignant transformation analysis |
| Identification of the aberrant gene expression in precancerous and cancerous lesions by comparing the gene expression of stem-like cells in diseased tissues with normal stem cells |
| Entrez ID | Symbol | Replicates | Species | Organ | Tissue | Adj P-value | Log2FC | Malignancy |
| 100131801 | PET100 | GSM4909285 | Human | Breast | IDC | 1.80e-07 | -2.60e-01 | 0.21 |
| 100131801 | PET100 | GSM4909286 | Human | Breast | IDC | 1.12e-02 | -6.51e-02 | 0.1081 |
| 100131801 | PET100 | GSM4909293 | Human | Breast | IDC | 7.31e-08 | 4.04e-01 | 0.1581 |
| 100131801 | PET100 | GSM4909296 | Human | Breast | IDC | 3.29e-13 | 2.96e-01 | 0.1524 |
| 100131801 | PET100 | GSM4909297 | Human | Breast | IDC | 3.29e-12 | -3.55e-02 | 0.1517 |
| 100131801 | PET100 | GSM4909298 | Human | Breast | IDC | 7.29e-03 | 3.18e-01 | 0.1551 |
| 100131801 | PET100 | GSM4909301 | Human | Breast | IDC | 2.52e-29 | 6.97e-01 | 0.1577 |
| 100131801 | PET100 | GSM4909303 | Human | Breast | IDC | 8.08e-08 | 5.32e-01 | 0.0438 |
| 100131801 | PET100 | GSM4909304 | Human | Breast | IDC | 1.68e-21 | 5.85e-01 | 0.1636 |
| 100131801 | PET100 | GSM4909311 | Human | Breast | IDC | 3.80e-50 | 5.05e-01 | 0.1534 |
| 100131801 | PET100 | GSM4909312 | Human | Breast | IDC | 7.92e-17 | 2.29e-01 | 0.1552 |
| 100131801 | PET100 | GSM4909313 | Human | Breast | IDC | 8.04e-09 | 3.13e-01 | 0.0391 |
| 100131801 | PET100 | GSM4909315 | Human | Breast | IDC | 7.77e-08 | 4.51e-01 | 0.21 |
| 100131801 | PET100 | GSM4909316 | Human | Breast | IDC | 2.45e-18 | 5.46e-01 | 0.21 |
| 100131801 | PET100 | GSM4909317 | Human | Breast | IDC | 4.02e-02 | 2.29e-01 | 0.1355 |
| 100131801 | PET100 | GSM4909319 | Human | Breast | IDC | 1.81e-33 | -2.72e-01 | 0.1563 |
| 100131801 | PET100 | GSM4909320 | Human | Breast | IDC | 1.09e-11 | 1.90e-01 | 0.1575 |
| 100131801 | PET100 | GSM4909321 | Human | Breast | IDC | 2.06e-14 | -2.39e-01 | 0.1559 |
| 100131801 | PET100 | brca2 | Human | Breast | Precancer | 4.61e-10 | 3.87e-01 | -0.024 |
| 100131801 | PET100 | M1 | Human | Breast | IDC | 1.25e-06 | 4.04e-01 | 0.1577 |
| Page: 1 2 3 4 5 6 7 8 9 10 11 |
| Tissue | Expression Dynamics | Abbreviation |
| Breast | 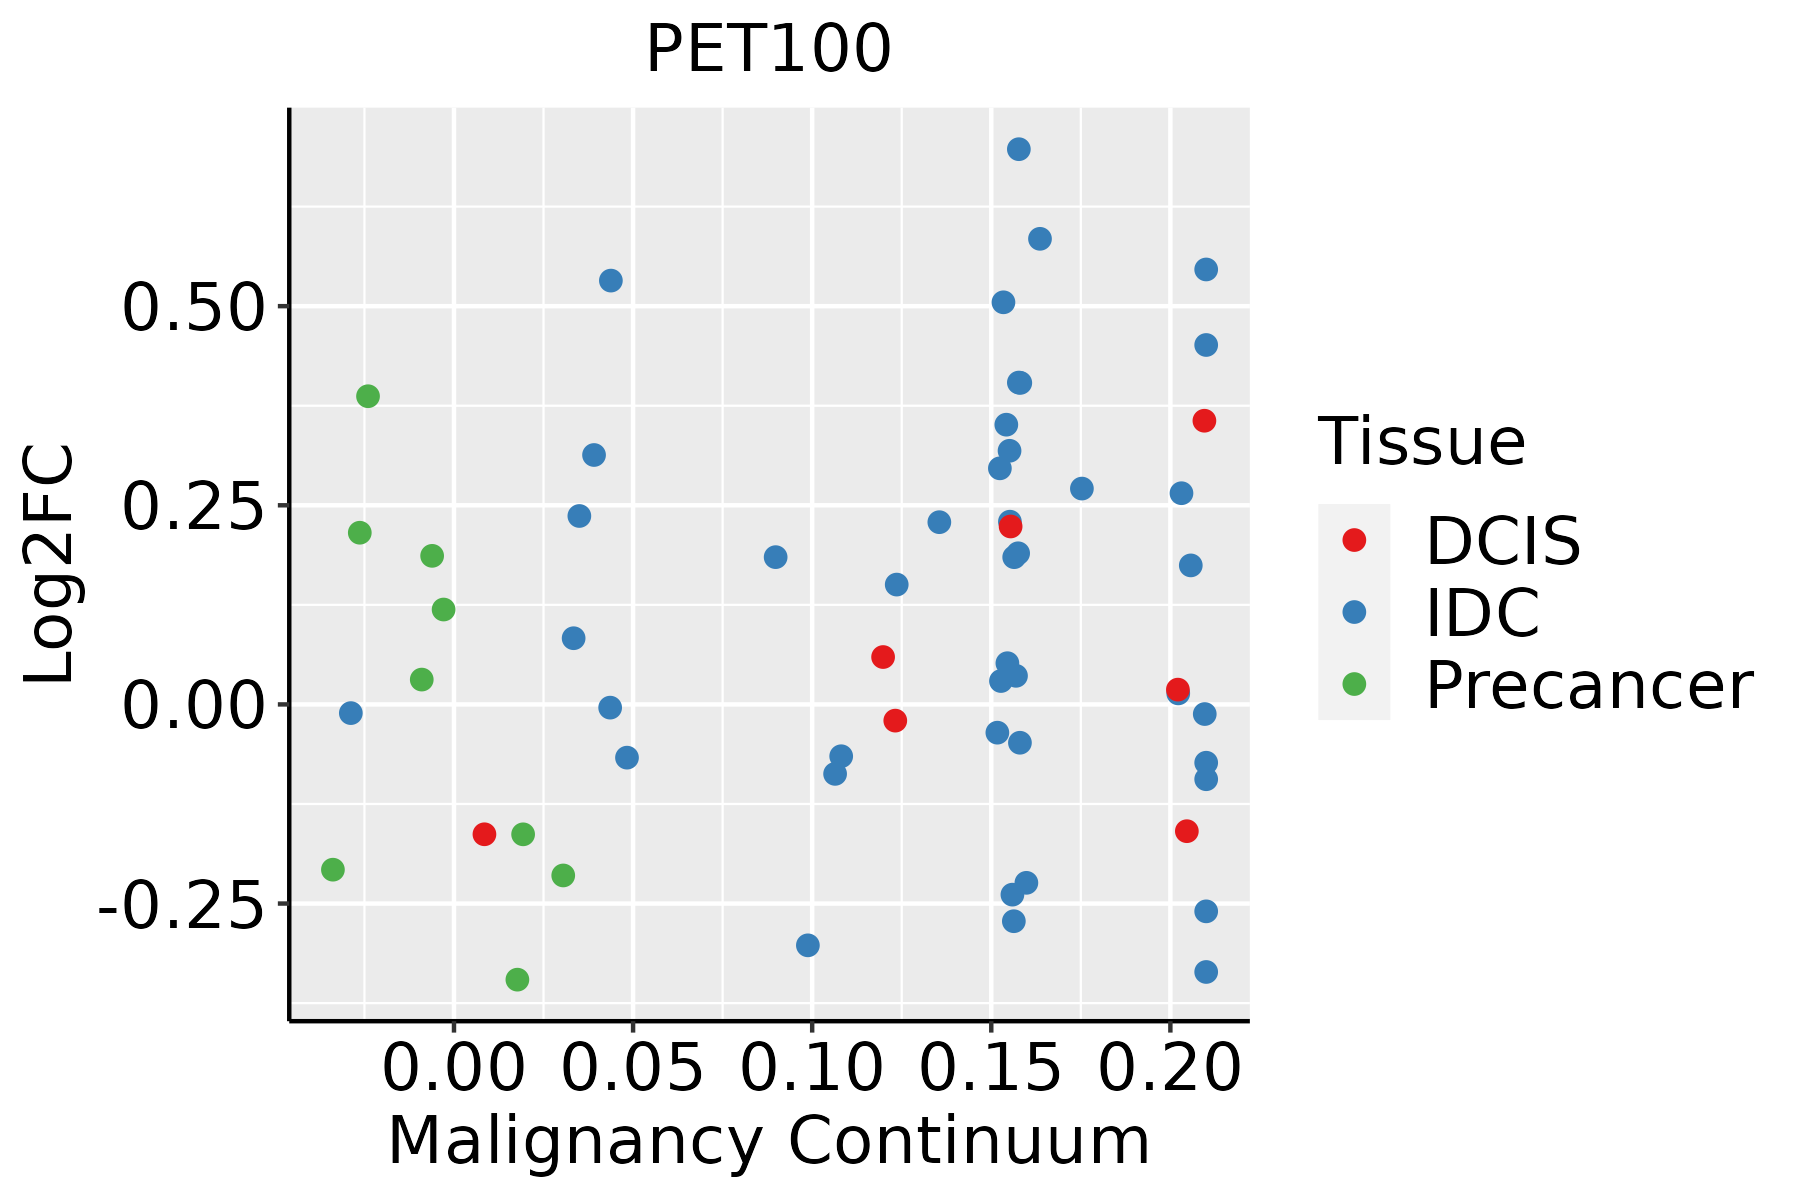 | IDC: Invasive ductal carcinoma |
| DCIS: Ductal carcinoma in situ | ||
| Precancer(BRCA1-mut): Precancerous lesion from BRCA1 mutation carriers | ||
| Endometrium | 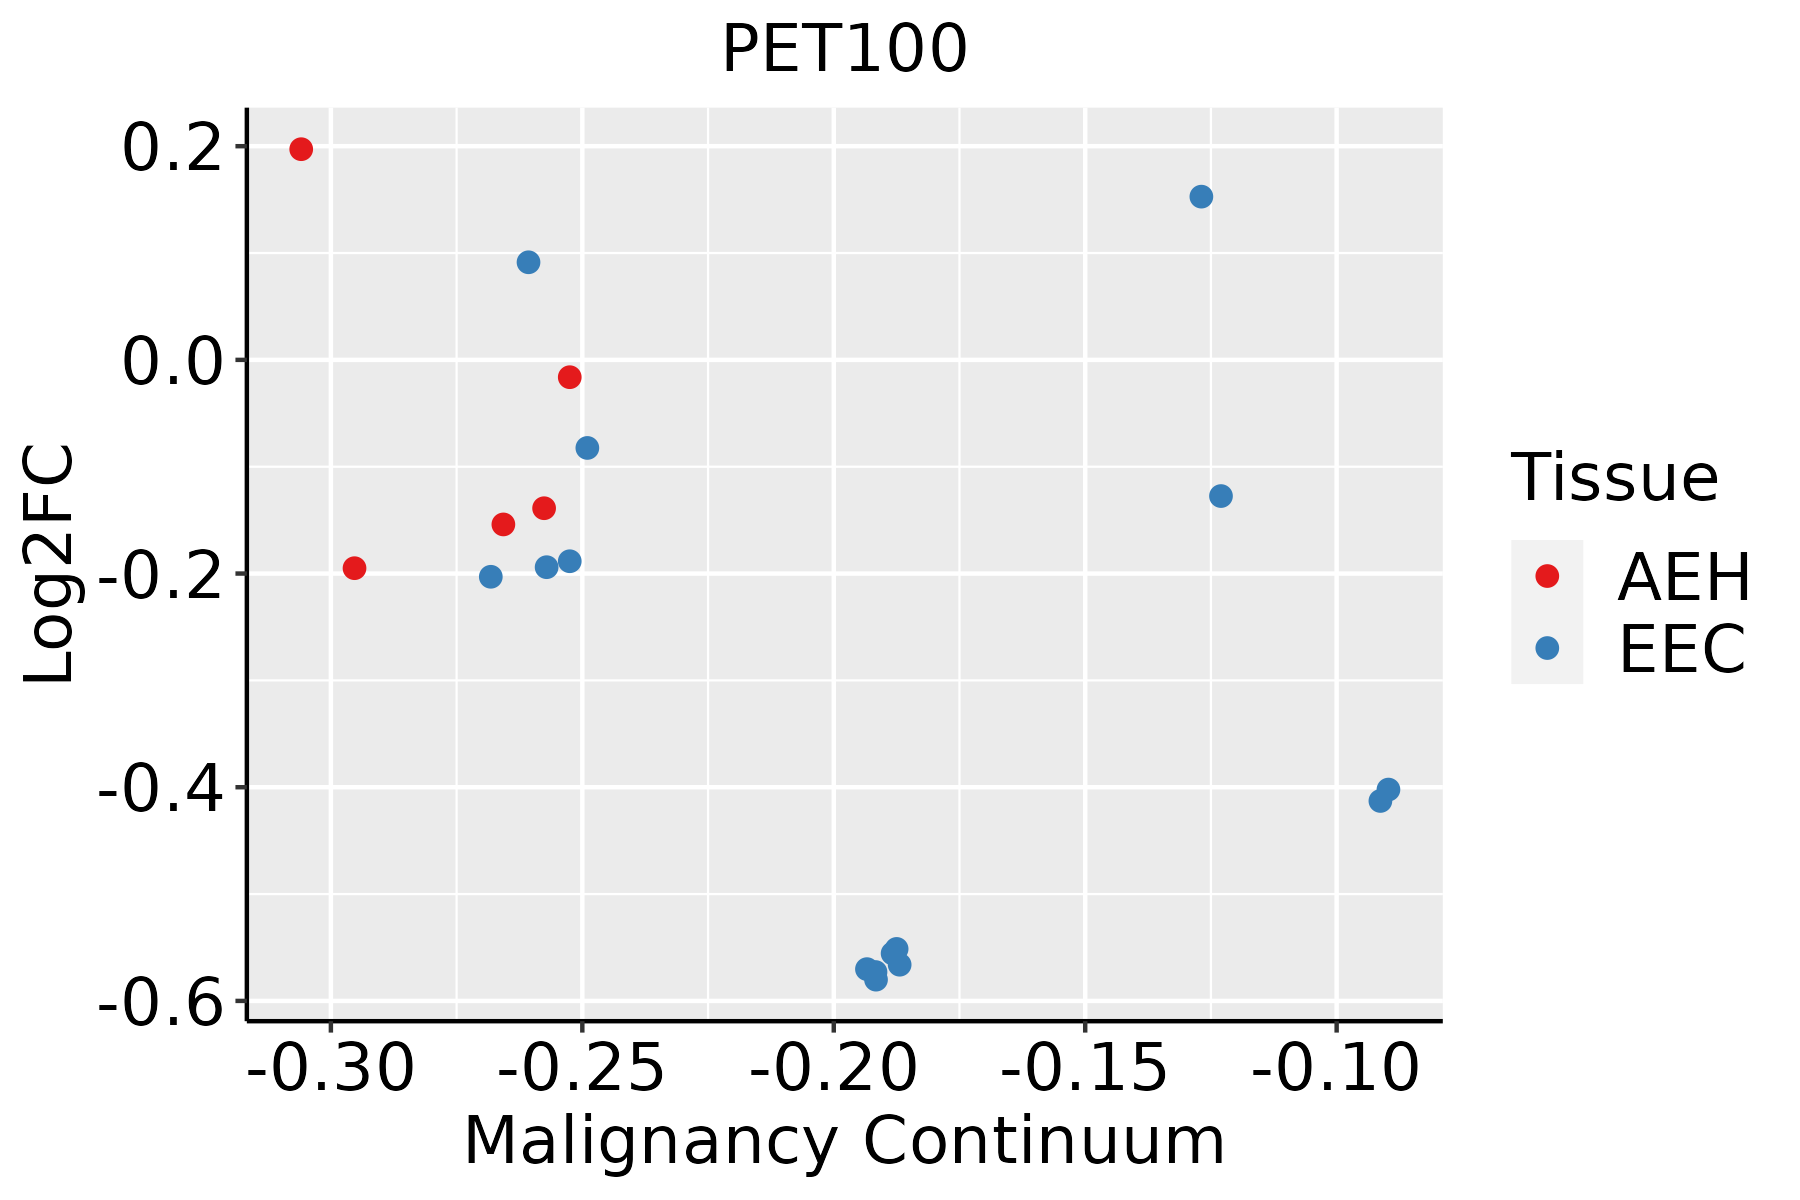 | AEH: Atypical endometrial hyperplasia |
| EEC: Endometrioid Cancer | ||
| Esophagus | 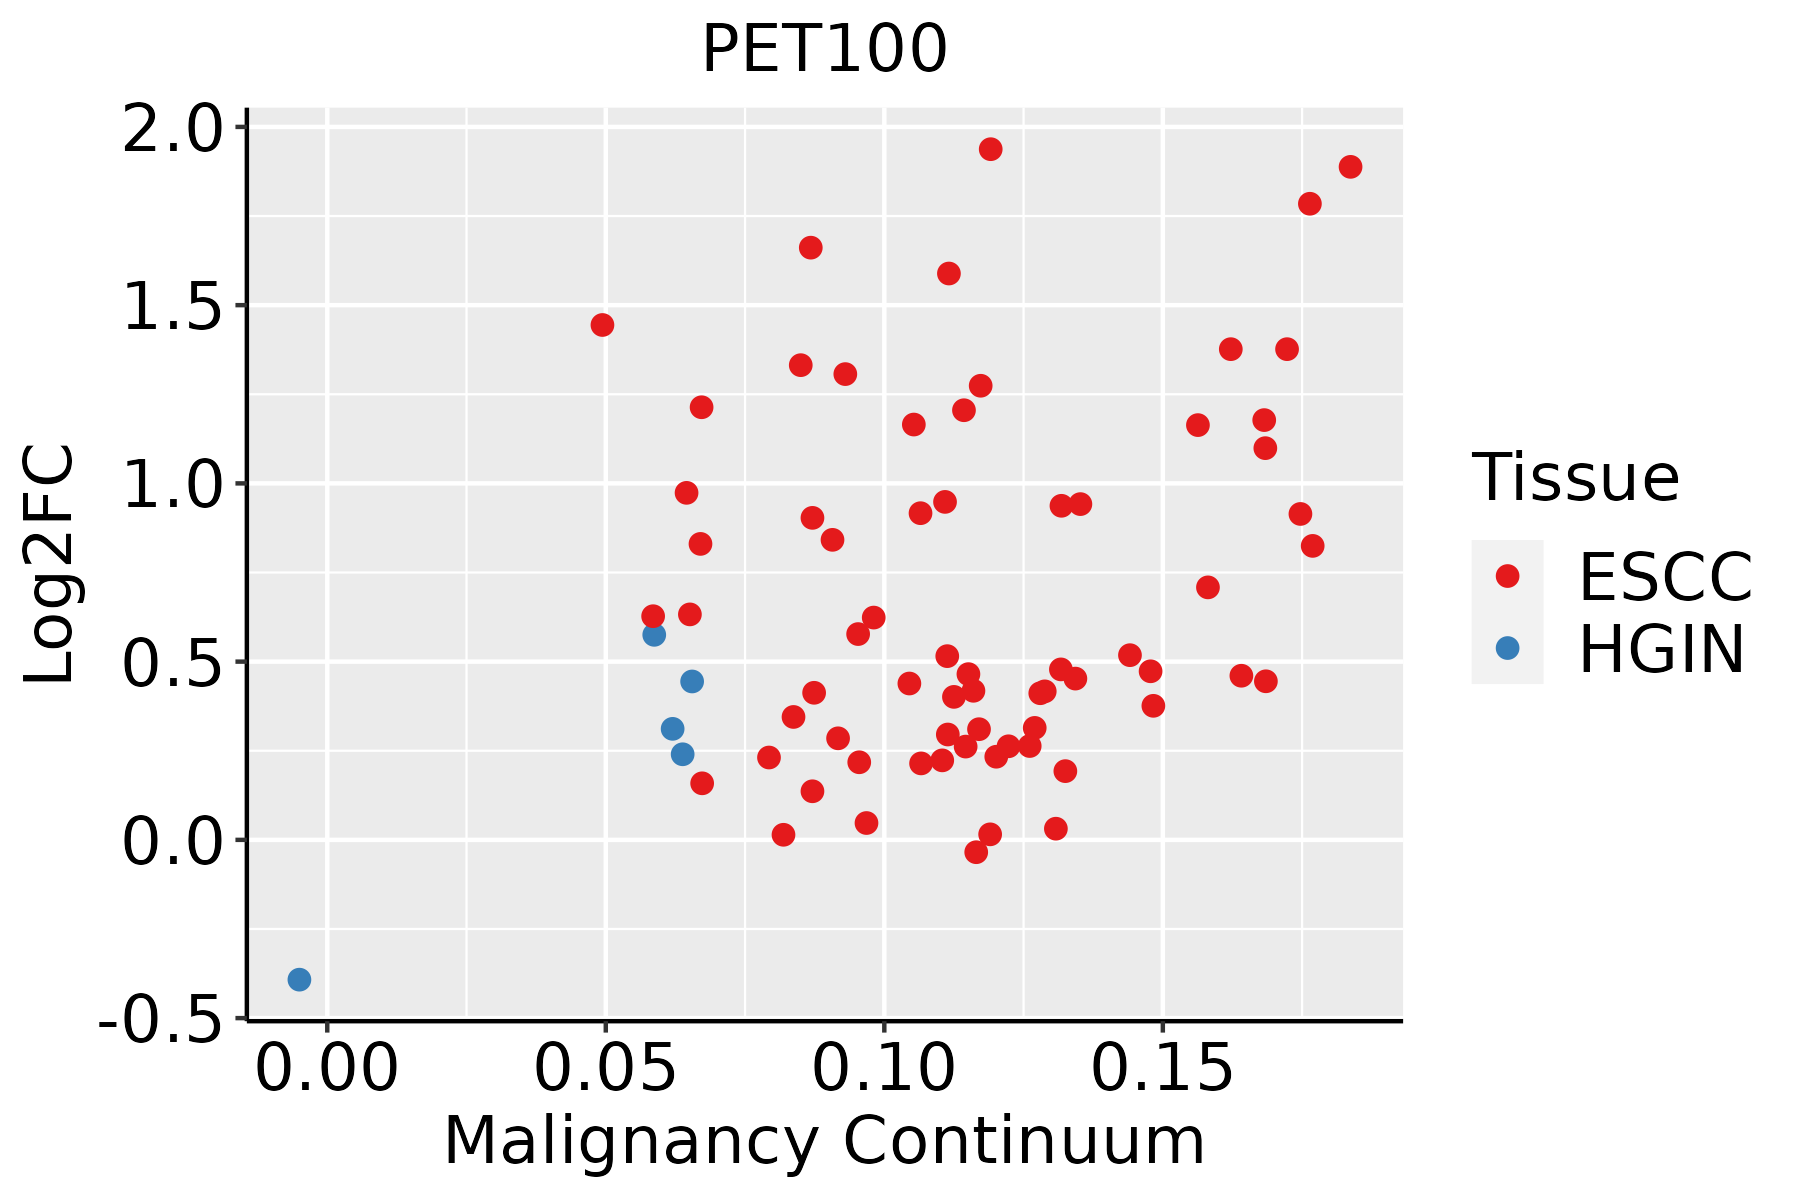 | ESCC: Esophageal squamous cell carcinoma |
| HGIN: High-grade intraepithelial neoplasias | ||
| LGIN: Low-grade intraepithelial neoplasias | ||
| GC | 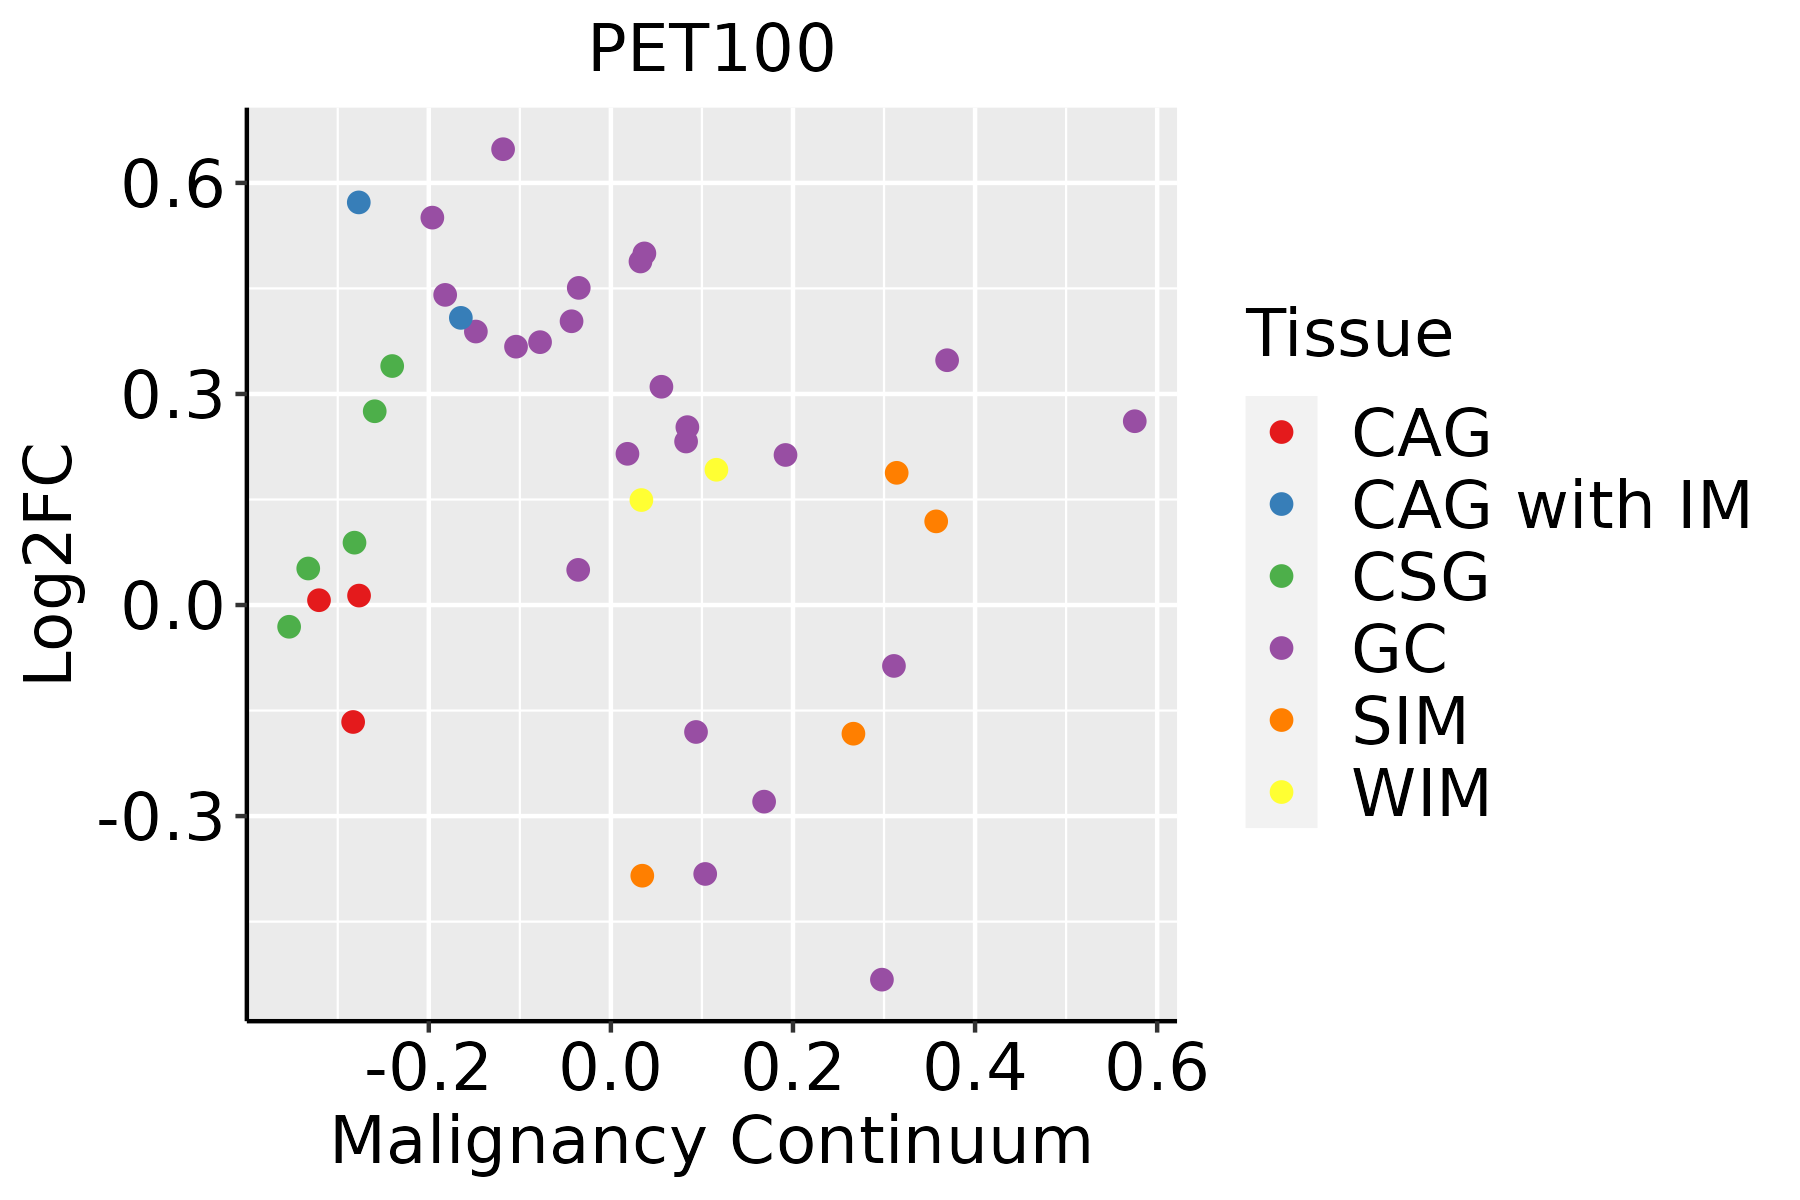 | CAG: Chronic atrophic gastritis |
| CAG with IM: Chronic atrophic gastritis with intestinal metaplasia | ||
| CSG: Chronic superficial gastritis | ||
| GC: Gastric cancer | ||
| SIM: Severe intestinal metaplasia | ||
| WIM: Wild intestinal metaplasia | ||
| Liver |  | HCC: Hepatocellular carcinoma |
| NAFLD: Non-alcoholic fatty liver disease | ||
| Oral Cavity | 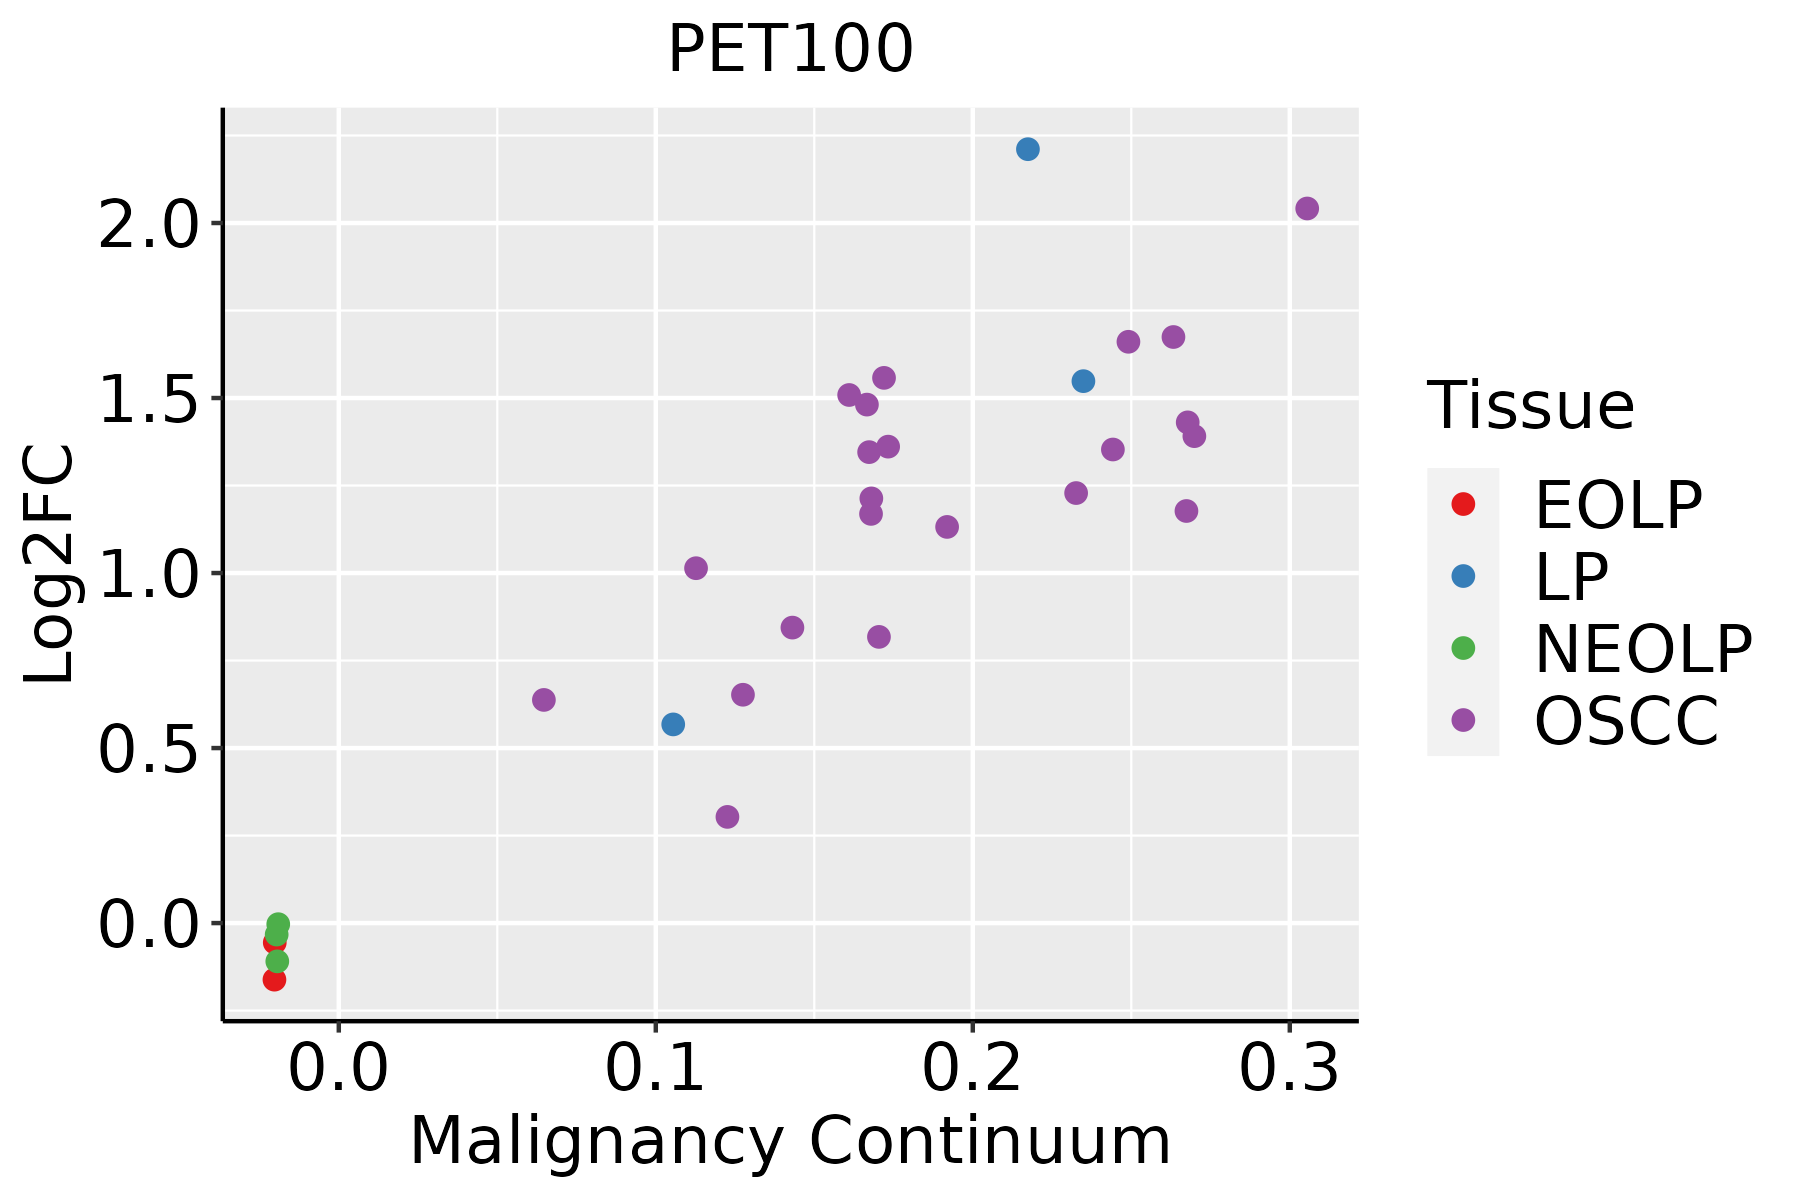 | EOLP: Erosive Oral lichen planus |
| LP: leukoplakia | ||
| NEOLP: Non-erosive oral lichen planus | ||
| OSCC: Oral squamous cell carcinoma | ||
| Prostate | 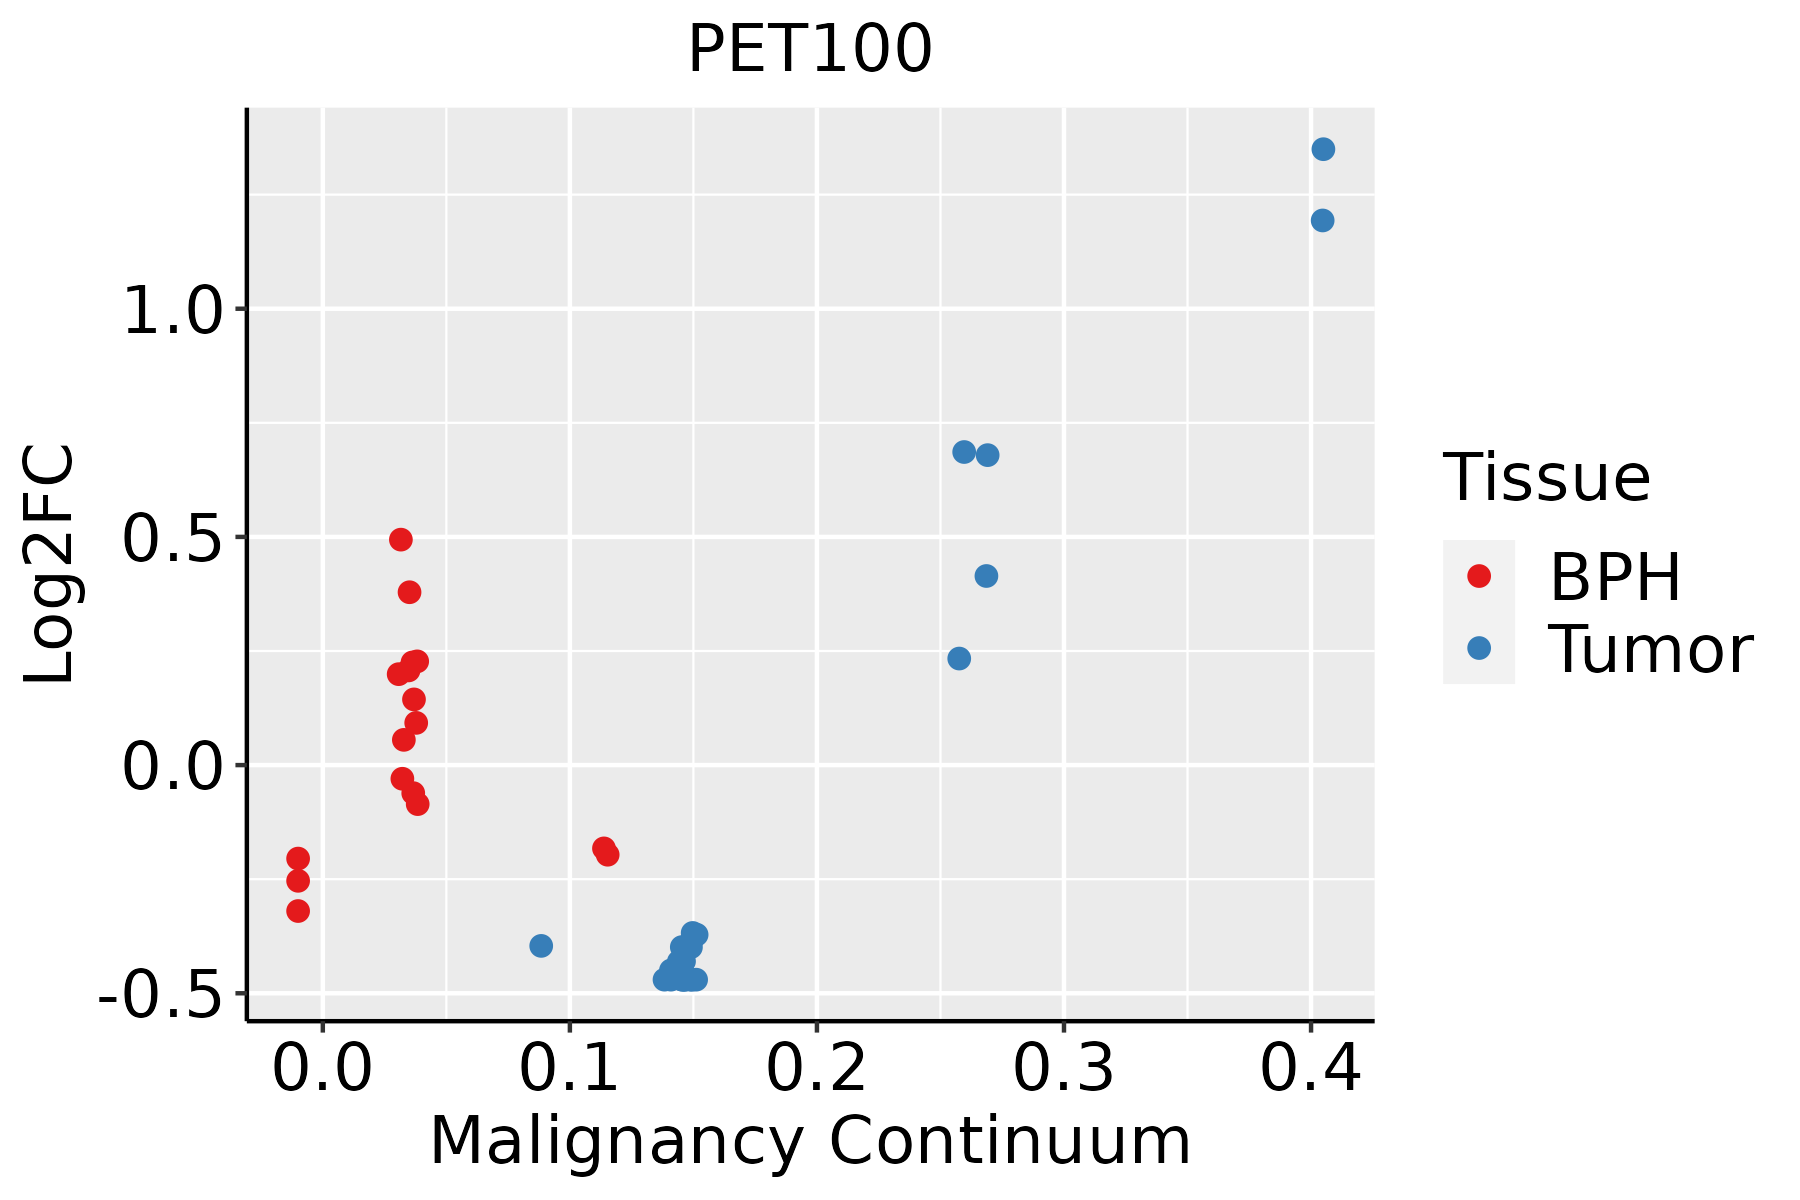 | BPH: Benign Prostatic Hyperplasia |
| Skin | 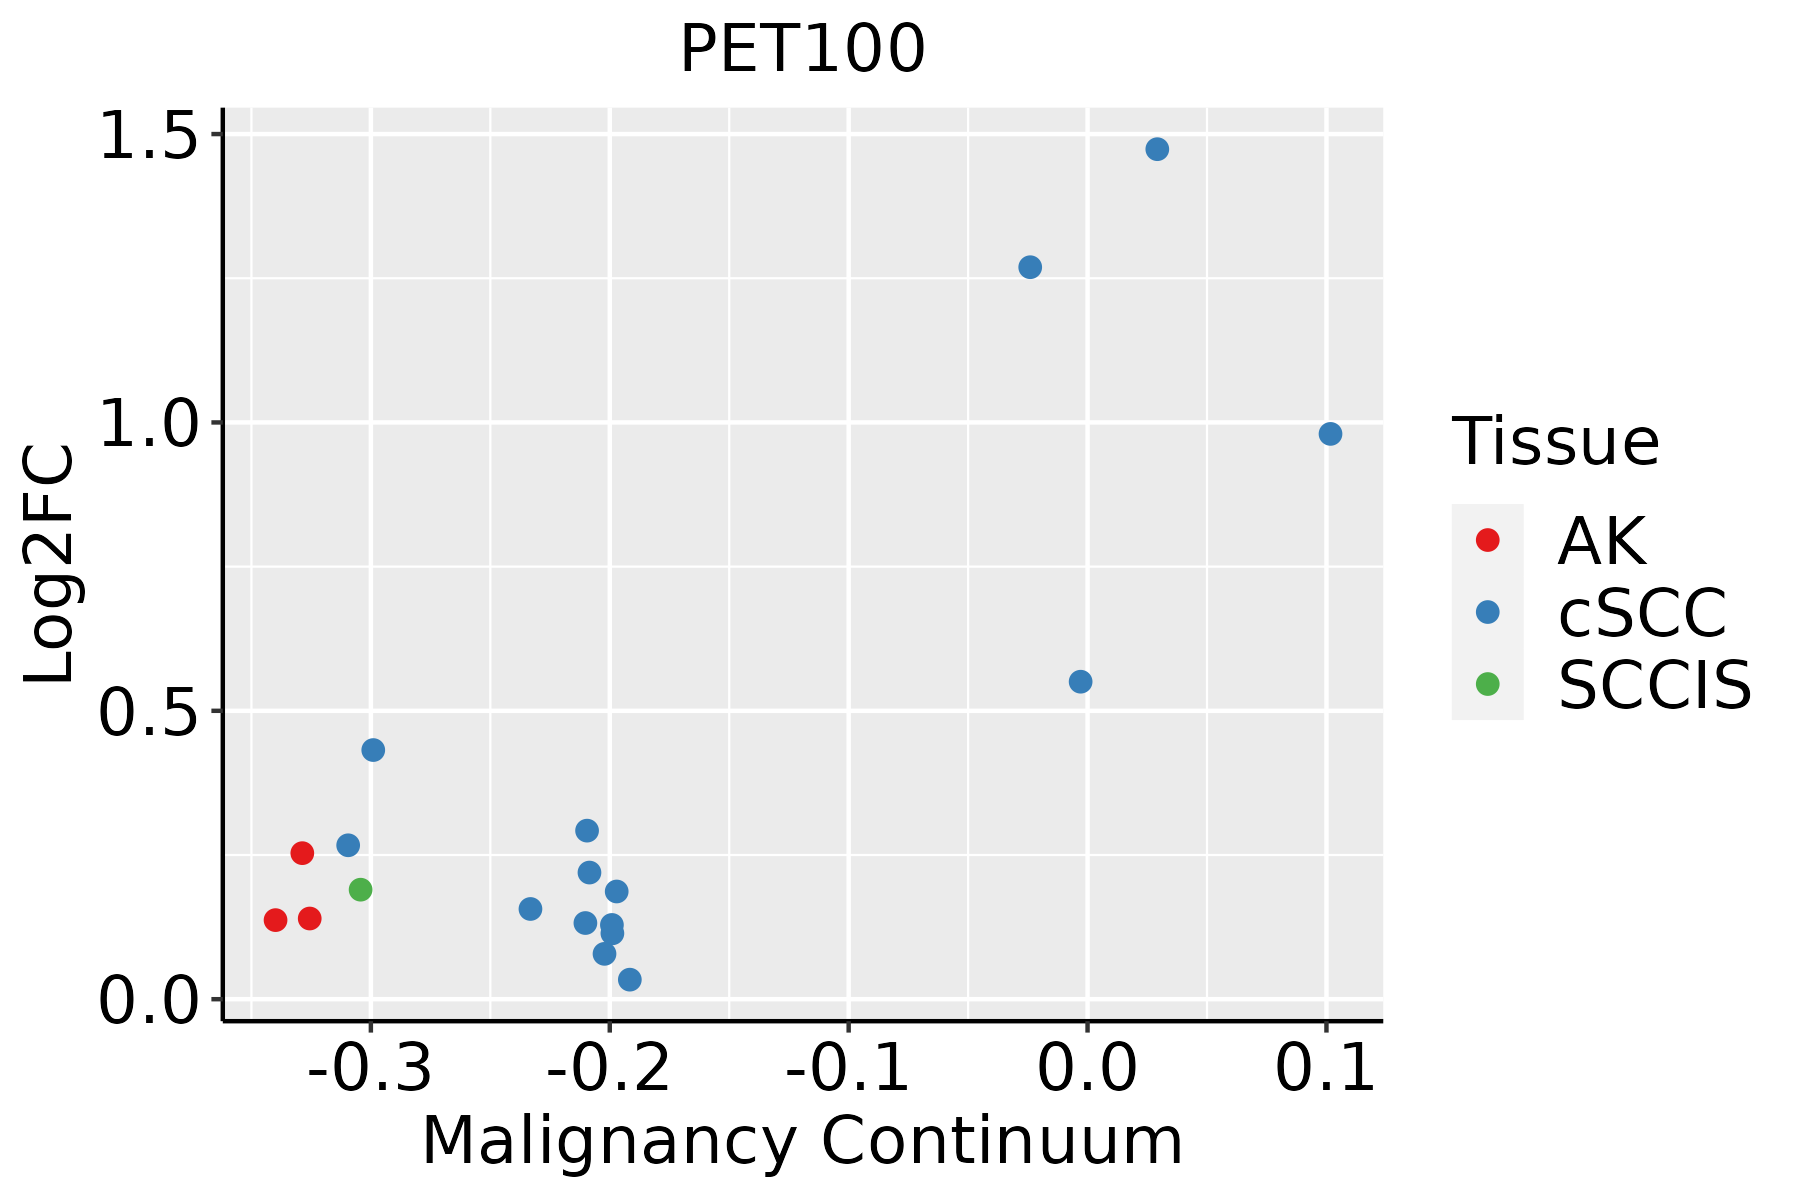 | AK: Actinic keratosis |
| cSCC: Cutaneous squamous cell carcinoma | ||
| SCCIS:squamous cell carcinoma in situ | ||
| Thyroid | 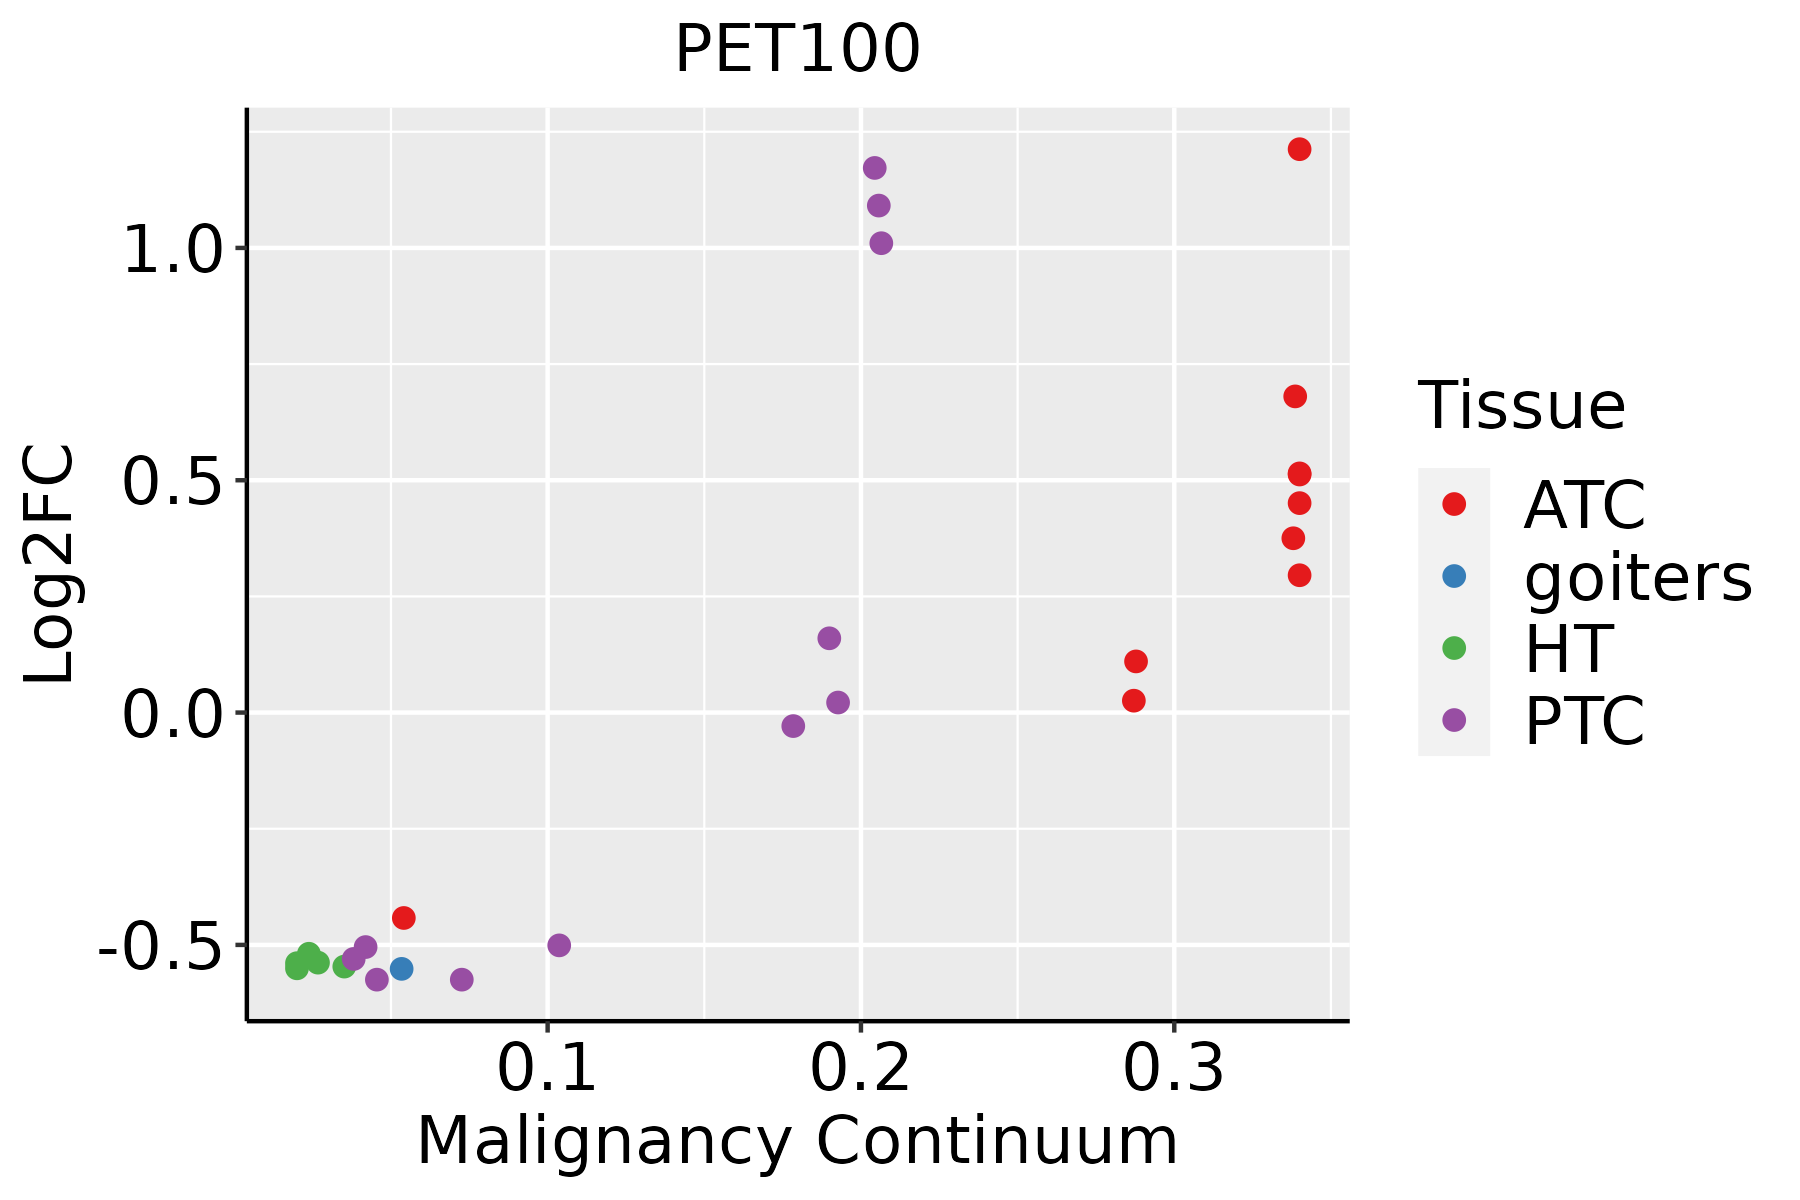 | ATC: Anaplastic thyroid cancer |
| HT: Hashimoto's thyroiditis | ||
| PTC: Papillary thyroid cancer |
| ∗log2FC in expression of this searched gene in stem-like cells from each diseased tissue sample relative to stem-like cells in normal samples in each tissue plotted against the malignancy continuum. Samples are colored based on if they are from different disease stage. |
Top |
Malignant transformation related pathway analysis |
| Find out the enriched GO biological processes and KEGG pathways involved in transition from healthy to precancer to cancer |
| Tissue | Disease Stage | Enriched GO biological Processes |
| Colorectum | AD |  |
| Colorectum | SER |  |
| Colorectum | MSS |  |
| Colorectum | MSI-H |  |
| Colorectum | FAP |  |
| ∗Top 15 enriched GO BP terms are showed in the bar plot of each disease state in each tissue. Each row represents a significant GO biological process which is colored according to the -log10(p.adjust). |
| Page: 1 2 3 4 5 6 7 8 9 |
| GO ID | Tissue | Disease Stage | Description | Gene Ratio | Bg Ratio | pvalue | p.adjust | Count |
| GO:00331088 | Breast | Precancer | mitochondrial respiratory chain complex assembly | 24/1080 | 93/18723 | 3.39e-10 | 3.16e-08 | 24 |
| GO:003310813 | Breast | IDC | mitochondrial respiratory chain complex assembly | 28/1434 | 93/18723 | 1.54e-10 | 1.83e-08 | 28 |
| GO:003310823 | Breast | DCIS | mitochondrial respiratory chain complex assembly | 28/1390 | 93/18723 | 7.50e-11 | 9.43e-09 | 28 |
| GO:003310810 | Endometrium | AEH | mitochondrial respiratory chain complex assembly | 30/2100 | 93/18723 | 4.63e-08 | 2.50e-06 | 30 |
| GO:003310815 | Endometrium | EEC | mitochondrial respiratory chain complex assembly | 31/2168 | 93/18723 | 2.46e-08 | 1.45e-06 | 31 |
| GO:003310820 | Esophagus | HGIN | mitochondrial respiratory chain complex assembly | 47/2587 | 93/18723 | 3.15e-17 | 8.60e-15 | 47 |
| GO:00170044 | Esophagus | HGIN | cytochrome complex assembly | 18/2587 | 36/18723 | 2.39e-07 | 1.14e-05 | 18 |
| GO:00336173 | Esophagus | HGIN | mitochondrial cytochrome c oxidase assembly | 13/2587 | 22/18723 | 9.51e-07 | 3.80e-05 | 13 |
| GO:00085353 | Esophagus | HGIN | respiratory chain complex IV assembly | 14/2587 | 26/18723 | 1.68e-06 | 6.29e-05 | 14 |
| GO:0033108110 | Esophagus | ESCC | mitochondrial respiratory chain complex assembly | 83/8552 | 93/18723 | 9.56e-19 | 1.05e-16 | 83 |
| GO:001700413 | Esophagus | ESCC | cytochrome complex assembly | 34/8552 | 36/18723 | 5.08e-10 | 1.31e-08 | 34 |
| GO:000853512 | Esophagus | ESCC | respiratory chain complex IV assembly | 24/8552 | 26/18723 | 6.87e-07 | 8.99e-06 | 24 |
| GO:003361712 | Esophagus | ESCC | mitochondrial cytochrome c oxidase assembly | 21/8552 | 22/18723 | 8.75e-07 | 1.13e-05 | 21 |
| GO:00331087 | Liver | Cirrhotic | mitochondrial respiratory chain complex assembly | 64/4634 | 93/18723 | 3.85e-19 | 7.79e-17 | 64 |
| GO:0017004 | Liver | Cirrhotic | cytochrome complex assembly | 22/4634 | 36/18723 | 3.92e-06 | 6.70e-05 | 22 |
| GO:0033617 | Liver | Cirrhotic | mitochondrial cytochrome c oxidase assembly | 14/4634 | 22/18723 | 1.27e-04 | 1.25e-03 | 14 |
| GO:0008535 | Liver | Cirrhotic | respiratory chain complex IV assembly | 15/4634 | 26/18723 | 3.43e-04 | 2.93e-03 | 15 |
| GO:003310812 | Liver | HCC | mitochondrial respiratory chain complex assembly | 80/7958 | 93/18723 | 3.47e-18 | 4.15e-16 | 80 |
| GO:00170041 | Liver | HCC | cytochrome complex assembly | 30/7958 | 36/18723 | 5.69e-07 | 9.03e-06 | 30 |
| GO:00336171 | Liver | HCC | mitochondrial cytochrome c oxidase assembly | 20/7958 | 22/18723 | 3.00e-06 | 3.98e-05 | 20 |
| Page: 1 2 3 |
| Pathway ID | Tissue | Disease Stage | Description | Gene Ratio | Bg Ratio | pvalue | p.adjust | qvalue | Count |
| Page: 1 |
Top |
Cell-cell communication analysis |
| Identification of potential cell-cell interactions between two cell types and their ligand-receptor pairs for different disease states |
| Ligand | Receptor | LRpair | Pathway | Tissue | Disease Stage |
| Page: 1 |
Top |
Single-cell gene regulatory network inference analysis |
| Find out the significant the regulons (TFs) and the target genes of each regulon across cell types for different disease states |
| TF | Cell Type | Tissue | Disease Stage | Target Gene | RSS | Regulon Activity |
| ∗The dot plots of a searched regulon are shown for all cell subpopulations in each disease state of each tissue based on the regulon specific score inferred using pySCENIC and by calculating the average expression. |
| Page: 1 |
Top |
Somatic mutation of malignant transformation related genes |
| Annotation of somatic variants for genes involved in malignant transformation |
| Hugo Symbol | Variant Class | Variant Classification | dbSNP RS | HGVSc | HGVSp | HGVSp Short | SWISSPROT | BIOTYPE | SIFT | PolyPhen | Tumor Sample Barcode | Tissue | Histology | Sex | Age | Stage | Therapy Types | Drugs | Outcome |
| PET100 | SNV | Missense_Mutation | novel | c.35T>C | p.Ile12Thr | p.I12T | P0DJ07 | protein_coding | deleterious(0) | benign(0.022) | TCGA-B5-A3FA-01 | Endometrium | uterine corpus endometrioid carcinoma | Female | >=65 | I/II | Unknown | Unknown | SD |
| PET100 | SNV | Missense_Mutation | novel | c.181N>T | p.Arg61Trp | p.R61W | P0DJ07 | protein_coding | deleterious(0) | probably_damaging(0.928) | TCGA-D1-A167-01 | Endometrium | uterine corpus endometrioid carcinoma | Female | >=65 | I/II | Unknown | Unknown | SD |
| PET100 | SNV | Missense_Mutation | c.110N>A | p.Arg37His | p.R37H | P0DJ07 | protein_coding | deleterious(0.04) | probably_damaging(0.997) | TCGA-DF-A2KU-01 | Endometrium | uterine corpus endometrioid carcinoma | Female | Unknown | I/II | Unknown | Unknown | SD | |
| PET100 | SNV | Missense_Mutation | novel | c.165N>T | p.Glu55Asp | p.E55D | P0DJ07 | protein_coding | tolerated(0.06) | benign(0.003) | TCGA-E6-A1LX-01 | Endometrium | uterine corpus endometrioid carcinoma | Female | <65 | I/II | Unknown | Unknown | SD |
| PET100 | SNV | Missense_Mutation | novel | c.109N>T | p.Arg37Cys | p.R37C | P0DJ07 | protein_coding | tolerated(0.09) | probably_damaging(0.997) | TCGA-EO-A3AV-01 | Endometrium | uterine corpus endometrioid carcinoma | Female | <65 | III/IV | Chemotherapy | carboplatin | CR |
| PET100 | SNV | Missense_Mutation | novel | c.18N>T | p.Glu6Asp | p.E6D | P0DJ07 | protein_coding | deleterious(0.01) | probably_damaging(0.98) | TCGA-EO-A3B0-01 | Endometrium | uterine corpus endometrioid carcinoma | Female | <65 | III/IV | Unknown | Unknown | SD |
| Page: 1 |
Top |
Related drugs of malignant transformation related genes |
| Identification of chemicals and drugs interact with genes involved in malignant transfromation |
| (DGIdb 4.0) |
| Entrez ID | Symbol | Category | Interaction Types | Drug Claim Name | Drug Name | PMIDs |
| Page: 1 |

Copyright 2023-Present -The University of Texas Health Science Center at Houston |