
|
|||||
|
 | |
| |
| |
| |
| |
| |
|
Gene: PES1 |
Gene summary for PES1 |
| Gene information | Species | Human | Gene symbol | PES1 | Gene ID | 23481 |
| Gene name | pescadillo ribosomal biogenesis factor 1 | |
| Gene Alias | NOP7 | |
| Cytomap | 22q12.2 | |
| Gene Type | protein-coding | GO ID | GO:0000460 | UniProtAcc | O00541 |
Top |
Malignant transformation analysis |
| Identification of the aberrant gene expression in precancerous and cancerous lesions by comparing the gene expression of stem-like cells in diseased tissues with normal stem cells |
| Entrez ID | Symbol | Replicates | Species | Organ | Tissue | Adj P-value | Log2FC | Malignancy |
| 23481 | PES1 | LZE2T | Human | Esophagus | ESCC | 9.83e-05 | 8.98e-01 | 0.082 |
| 23481 | PES1 | LZE4T | Human | Esophagus | ESCC | 1.18e-10 | 2.96e-01 | 0.0811 |
| 23481 | PES1 | LZE7T | Human | Esophagus | ESCC | 2.68e-05 | 6.13e-01 | 0.0667 |
| 23481 | PES1 | LZE8T | Human | Esophagus | ESCC | 1.10e-03 | 2.40e-01 | 0.067 |
| 23481 | PES1 | LZE24T | Human | Esophagus | ESCC | 2.12e-09 | 3.59e-01 | 0.0596 |
| 23481 | PES1 | LZE6T | Human | Esophagus | ESCC | 3.78e-04 | 2.18e-01 | 0.0845 |
| 23481 | PES1 | P1T-E | Human | Esophagus | ESCC | 1.69e-04 | 3.89e-01 | 0.0875 |
| 23481 | PES1 | P2T-E | Human | Esophagus | ESCC | 3.90e-26 | 4.30e-01 | 0.1177 |
| 23481 | PES1 | P4T-E | Human | Esophagus | ESCC | 1.62e-17 | 5.36e-01 | 0.1323 |
| 23481 | PES1 | P5T-E | Human | Esophagus | ESCC | 3.24e-16 | 2.51e-01 | 0.1327 |
| 23481 | PES1 | P8T-E | Human | Esophagus | ESCC | 1.33e-25 | 4.93e-01 | 0.0889 |
| 23481 | PES1 | P9T-E | Human | Esophagus | ESCC | 3.52e-20 | 5.98e-01 | 0.1131 |
| 23481 | PES1 | P10T-E | Human | Esophagus | ESCC | 8.09e-59 | 1.04e+00 | 0.116 |
| 23481 | PES1 | P11T-E | Human | Esophagus | ESCC | 1.34e-11 | 6.81e-01 | 0.1426 |
| 23481 | PES1 | P12T-E | Human | Esophagus | ESCC | 8.52e-36 | 5.40e-01 | 0.1122 |
| 23481 | PES1 | P15T-E | Human | Esophagus | ESCC | 3.35e-27 | 7.33e-01 | 0.1149 |
| 23481 | PES1 | P16T-E | Human | Esophagus | ESCC | 3.77e-38 | 8.25e-01 | 0.1153 |
| 23481 | PES1 | P17T-E | Human | Esophagus | ESCC | 4.56e-07 | 6.66e-01 | 0.1278 |
| 23481 | PES1 | P19T-E | Human | Esophagus | ESCC | 5.15e-08 | 9.21e-01 | 0.1662 |
| 23481 | PES1 | P20T-E | Human | Esophagus | ESCC | 3.68e-13 | 4.30e-01 | 0.1124 |
| Page: 1 2 3 4 5 6 |
| Tissue | Expression Dynamics | Abbreviation |
| Esophagus | 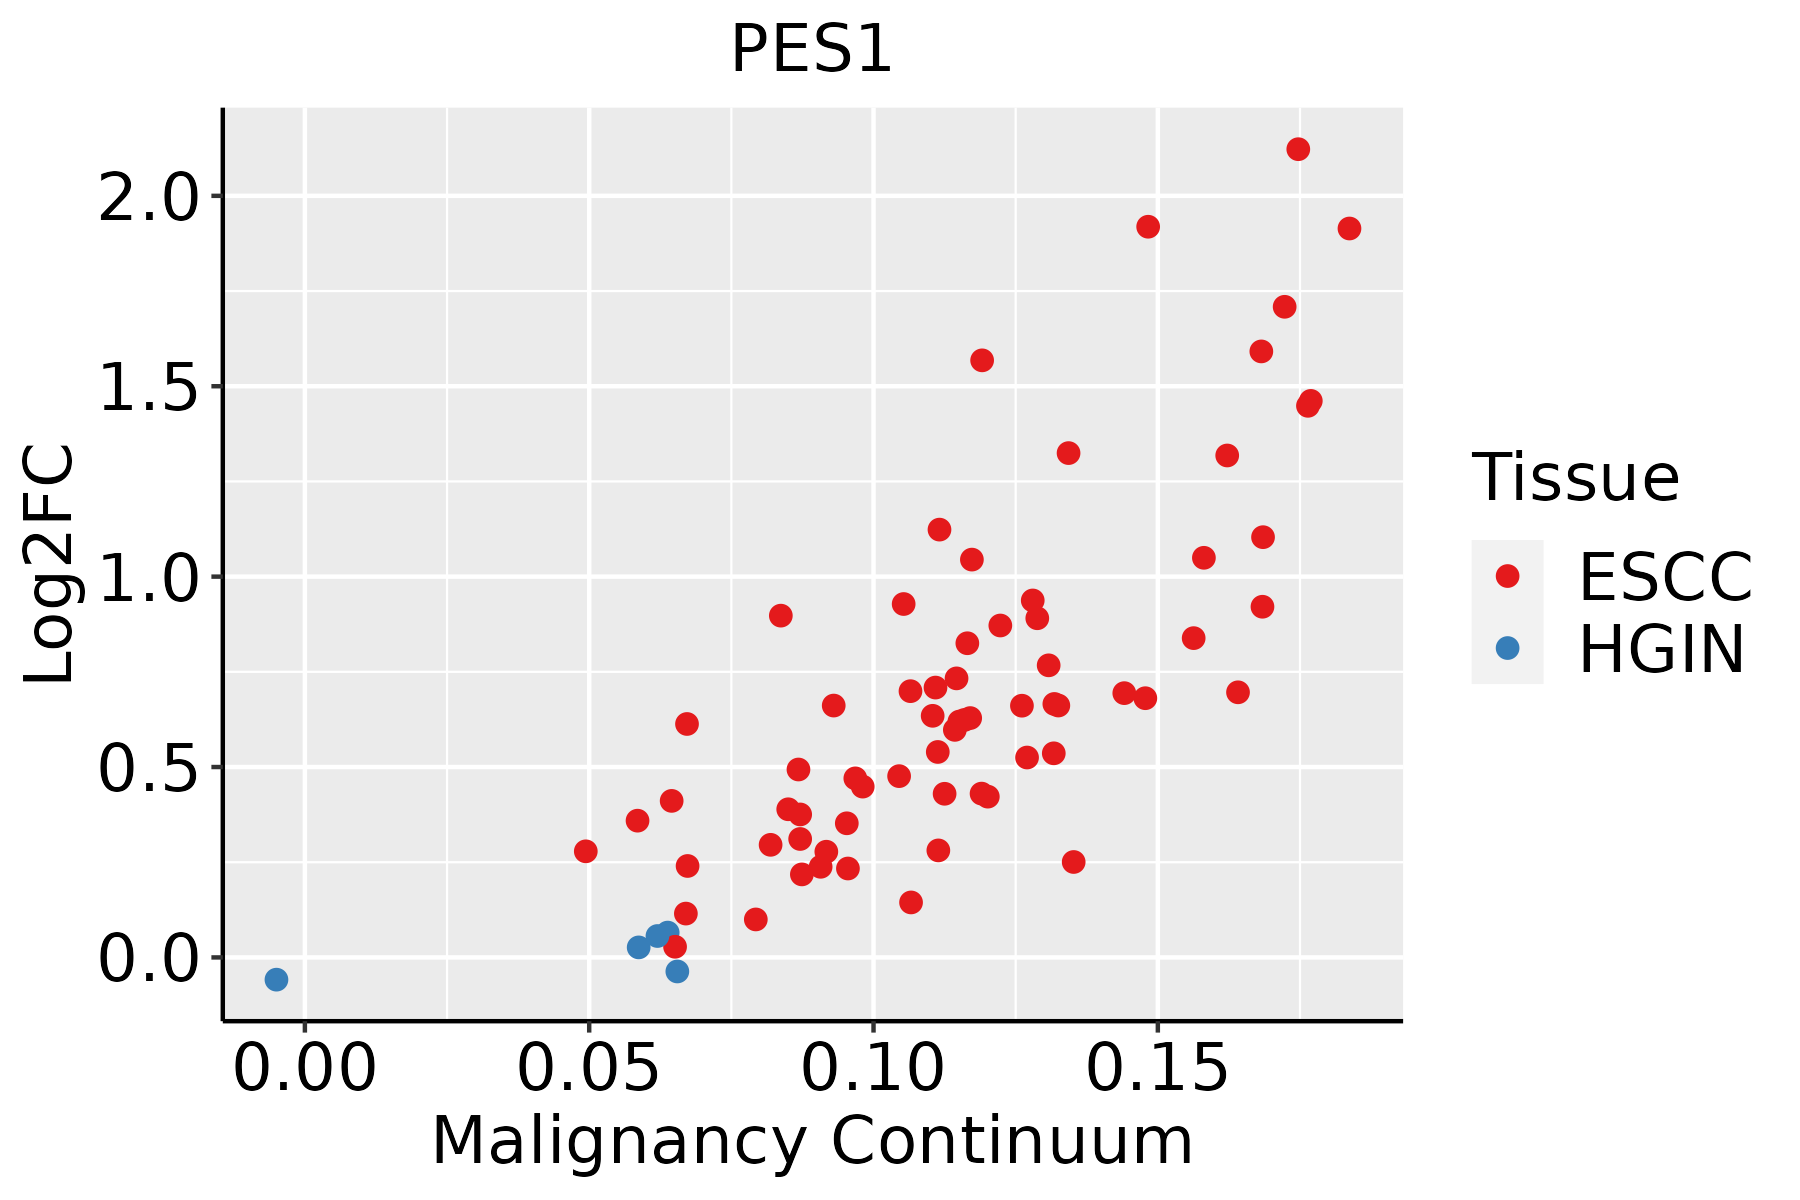 | ESCC: Esophageal squamous cell carcinoma |
| HGIN: High-grade intraepithelial neoplasias | ||
| LGIN: Low-grade intraepithelial neoplasias | ||
| Liver | 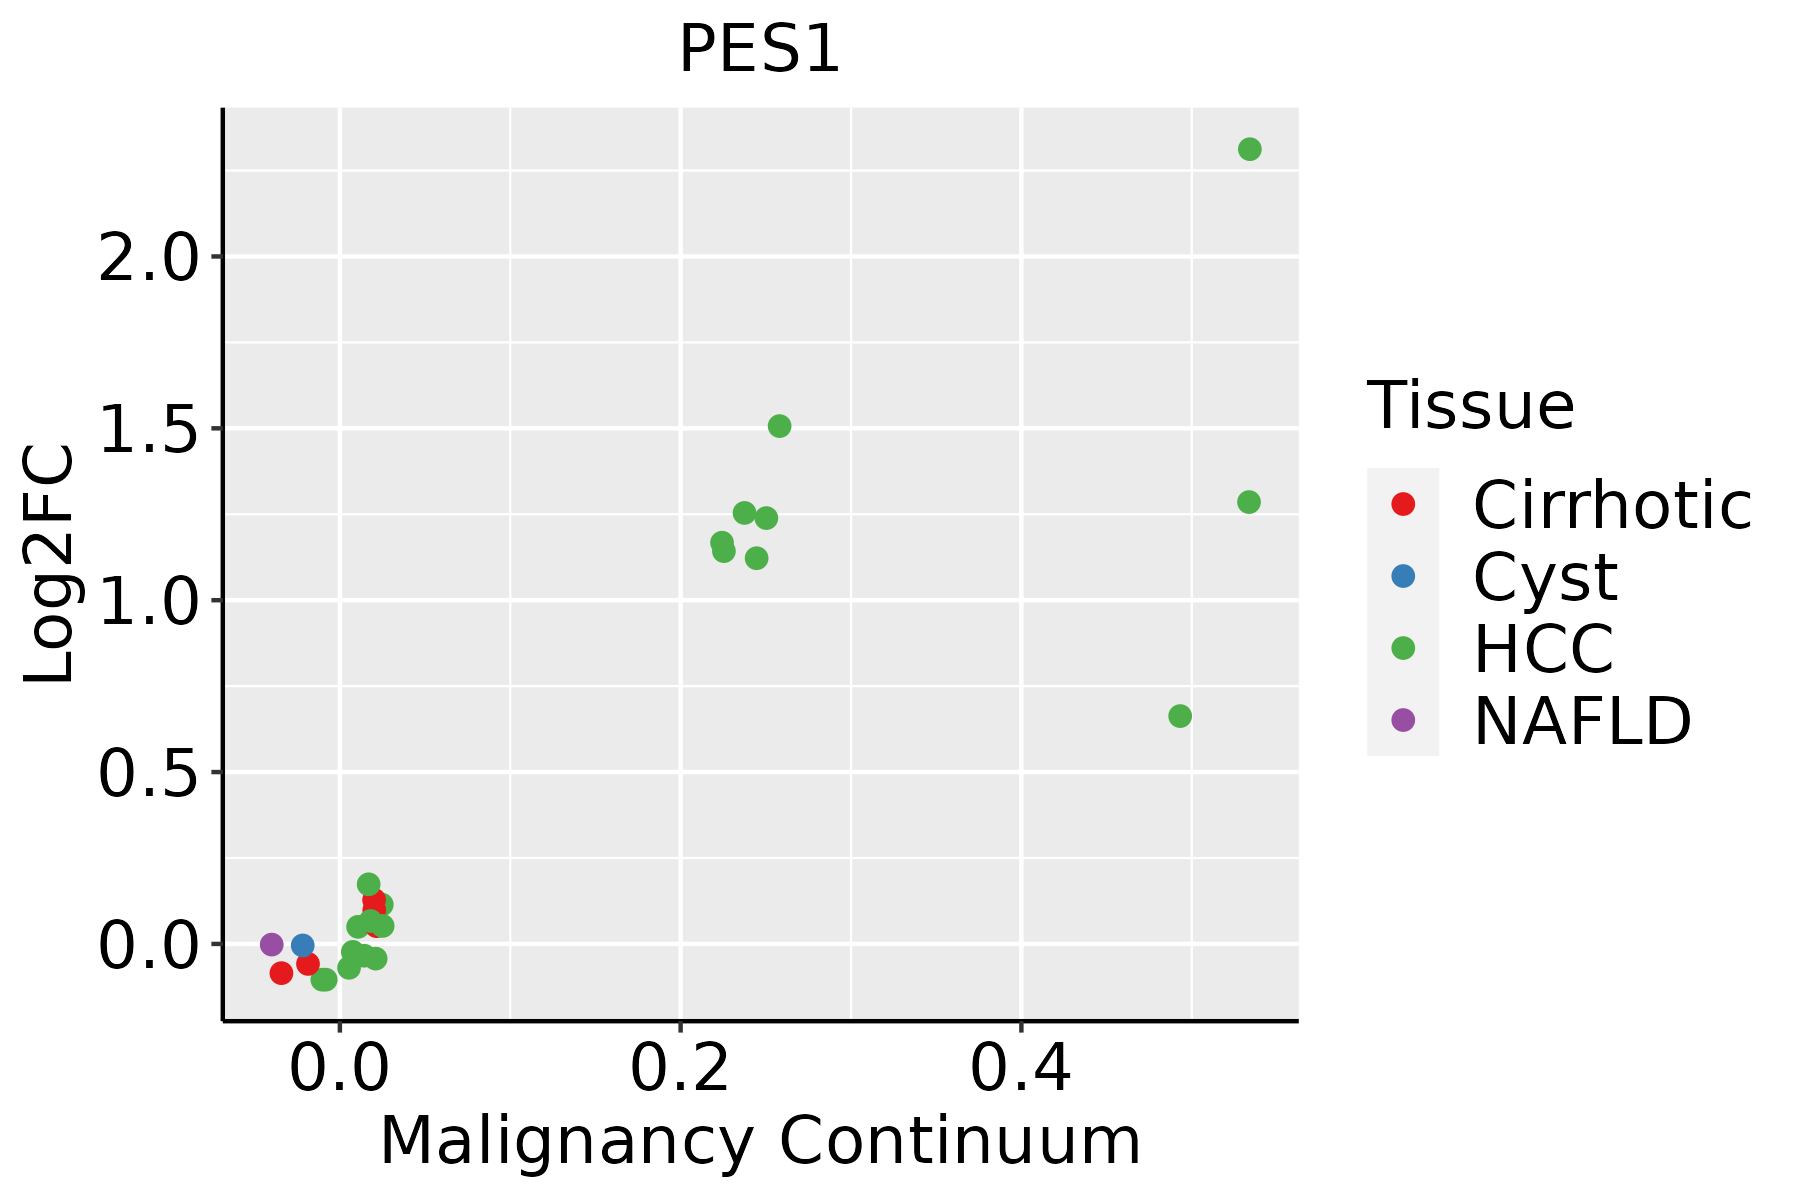 | HCC: Hepatocellular carcinoma |
| NAFLD: Non-alcoholic fatty liver disease | ||
| Oral Cavity | 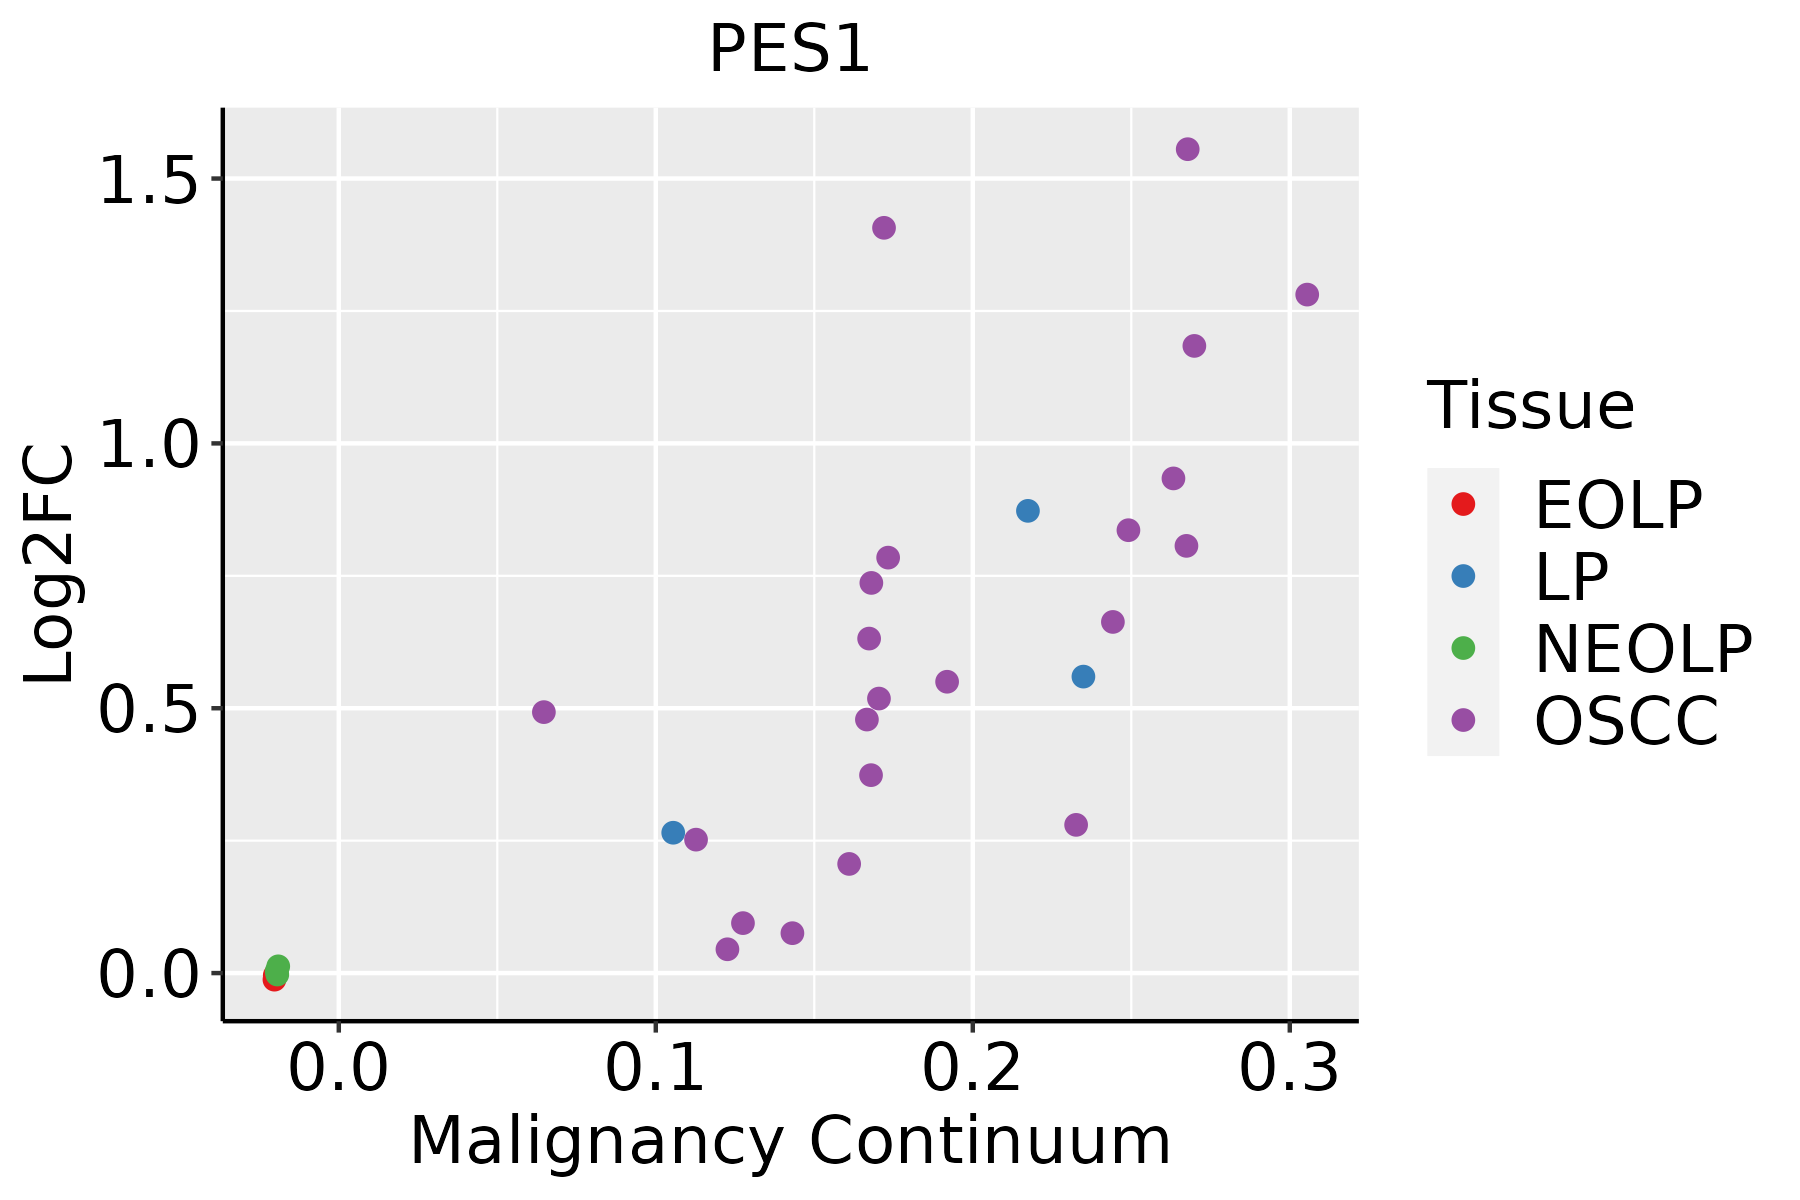 | EOLP: Erosive Oral lichen planus |
| LP: leukoplakia | ||
| NEOLP: Non-erosive oral lichen planus | ||
| OSCC: Oral squamous cell carcinoma | ||
| Skin | 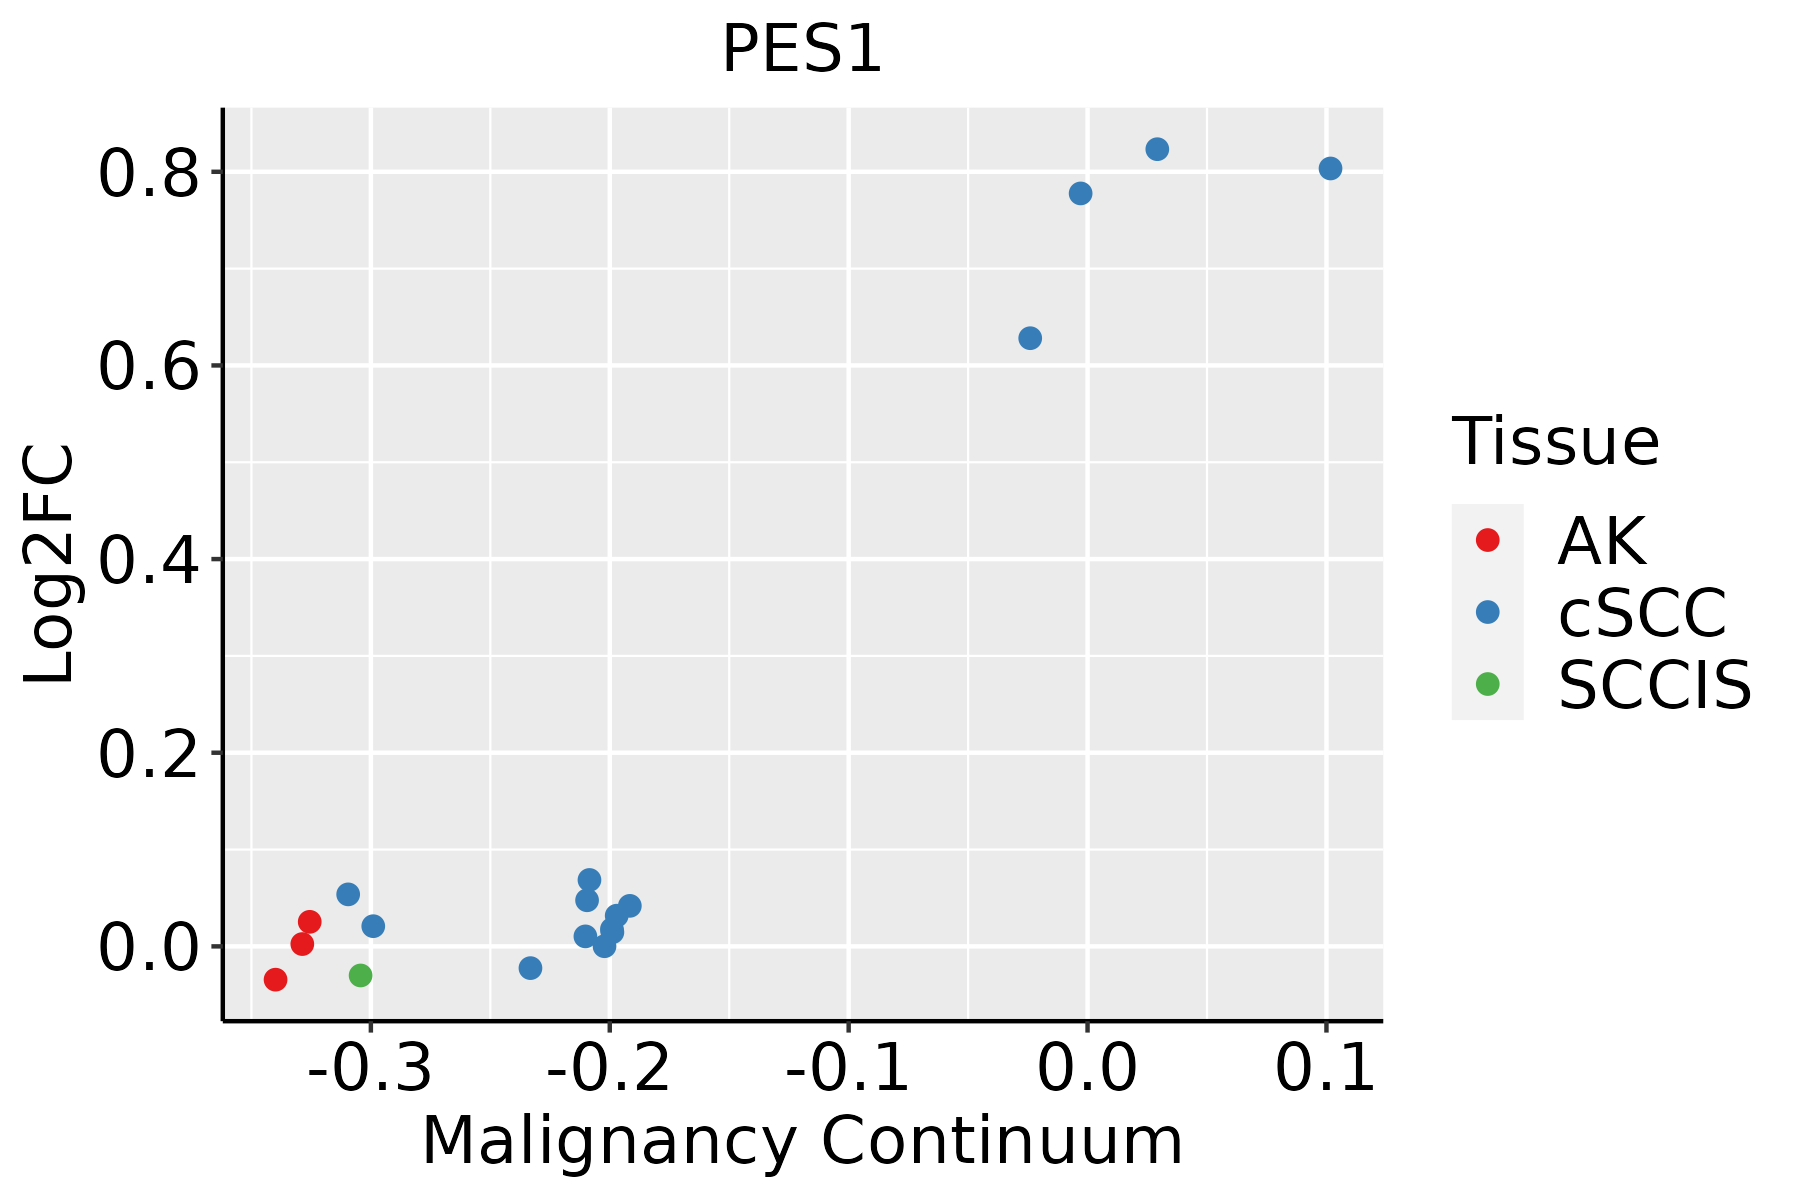 | AK: Actinic keratosis |
| cSCC: Cutaneous squamous cell carcinoma | ||
| SCCIS:squamous cell carcinoma in situ | ||
| Thyroid | 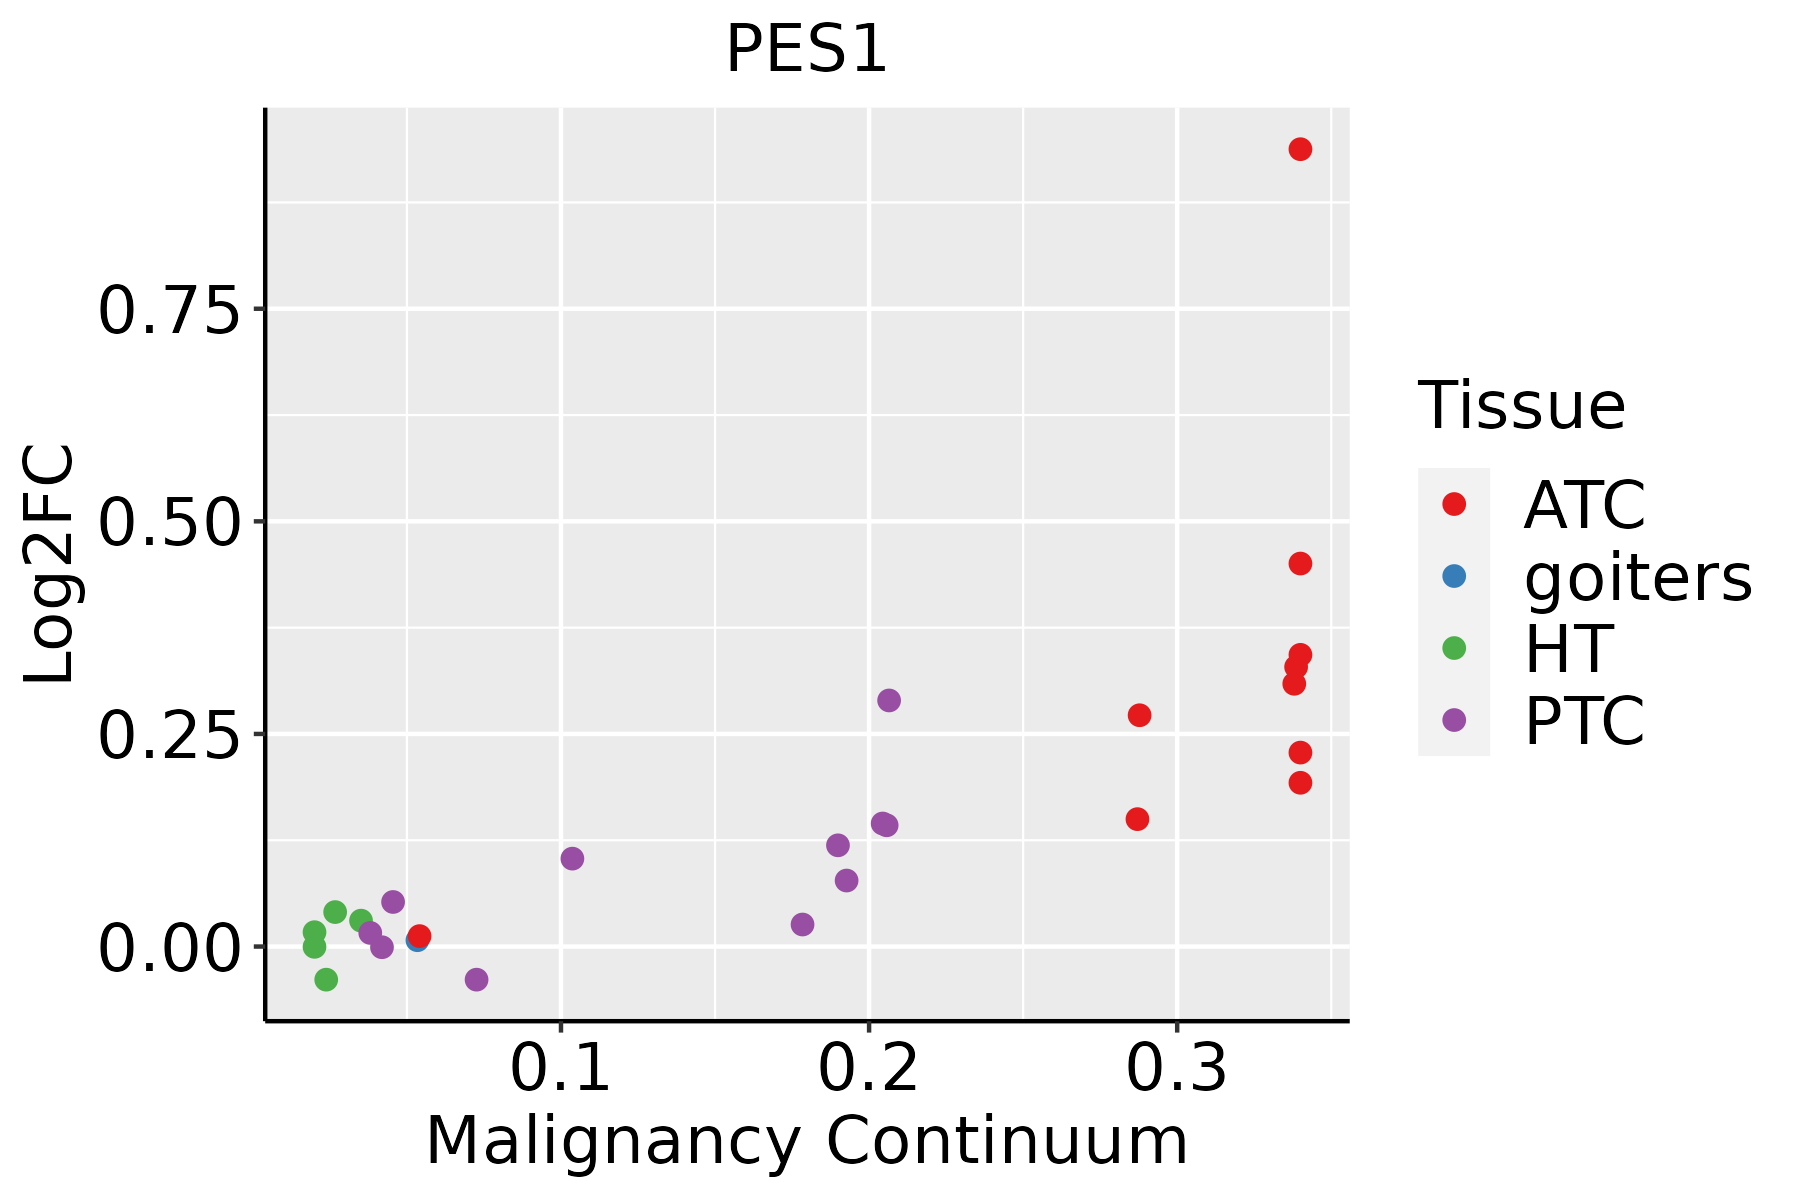 | ATC: Anaplastic thyroid cancer |
| HT: Hashimoto's thyroiditis | ||
| PTC: Papillary thyroid cancer |
| ∗log2FC in expression of this searched gene in stem-like cells from each diseased tissue sample relative to stem-like cells in normal samples in each tissue plotted against the malignancy continuum. Samples are colored based on if they are from different disease stage. |
Top |
Malignant transformation related pathway analysis |
| Find out the enriched GO biological processes and KEGG pathways involved in transition from healthy to precancer to cancer |
| Tissue | Disease Stage | Enriched GO biological Processes |
| Colorectum | AD |  |
| Colorectum | SER |  |
| Colorectum | MSS |  |
| Colorectum | MSI-H |  |
| Colorectum | FAP |  |
| ∗Top 15 enriched GO BP terms are showed in the bar plot of each disease state in each tissue. Each row represents a significant GO biological process which is colored according to the -log10(p.adjust). |
| Page: 1 2 3 4 5 6 7 8 9 |
| GO ID | Tissue | Disease Stage | Description | Gene Ratio | Bg Ratio | pvalue | p.adjust | Count |
| GO:0022613111 | Esophagus | ESCC | ribonucleoprotein complex biogenesis | 365/8552 | 463/18723 | 1.74e-49 | 1.11e-45 | 365 |
| GO:0042254111 | Esophagus | ESCC | ribosome biogenesis | 252/8552 | 299/18723 | 3.27e-44 | 1.04e-40 | 252 |
| GO:003447015 | Esophagus | ESCC | ncRNA processing | 300/8552 | 395/18723 | 3.09e-35 | 3.26e-32 | 300 |
| GO:0016072110 | Esophagus | ESCC | rRNA metabolic process | 197/8552 | 236/18723 | 1.31e-33 | 1.18e-30 | 197 |
| GO:0006364110 | Esophagus | ESCC | rRNA processing | 189/8552 | 225/18723 | 4.88e-33 | 3.87e-30 | 189 |
| GO:003466012 | Esophagus | ESCC | ncRNA metabolic process | 346/8552 | 485/18723 | 4.35e-31 | 2.51e-28 | 346 |
| GO:0042273111 | Esophagus | ESCC | ribosomal large subunit biogenesis | 65/8552 | 72/18723 | 1.53e-15 | 9.82e-14 | 65 |
| GO:000047016 | Esophagus | ESCC | maturation of LSU-rRNA | 27/8552 | 28/18723 | 9.94e-09 | 2.00e-07 | 27 |
| GO:00004603 | Esophagus | ESCC | maturation of 5.8S rRNA | 30/8552 | 35/18723 | 1.07e-06 | 1.34e-05 | 30 |
| GO:00004634 | Esophagus | ESCC | maturation of LSU-rRNA from tricistronic rRNA transcript (SSU-rRNA, 5.8S rRNA, LSU-rRNA) | 15/8552 | 15/18723 | 7.81e-06 | 7.69e-05 | 15 |
| GO:00004663 | Esophagus | ESCC | maturation of 5.8S rRNA from tricistronic rRNA transcript (SSU-rRNA, 5.8S rRNA, LSU-rRNA) | 21/8552 | 24/18723 | 2.57e-05 | 2.17e-04 | 21 |
| GO:002261312 | Liver | Cirrhotic | ribonucleoprotein complex biogenesis | 231/4634 | 463/18723 | 3.28e-32 | 6.86e-29 | 231 |
| GO:004225412 | Liver | Cirrhotic | ribosome biogenesis | 154/4634 | 299/18723 | 1.18e-23 | 6.72e-21 | 154 |
| GO:000636412 | Liver | Cirrhotic | rRNA processing | 115/4634 | 225/18723 | 1.12e-17 | 1.64e-15 | 115 |
| GO:00160724 | Liver | Cirrhotic | rRNA metabolic process | 119/4634 | 236/18723 | 1.19e-17 | 1.70e-15 | 119 |
| GO:004227312 | Liver | Cirrhotic | ribosomal large subunit biogenesis | 47/4634 | 72/18723 | 4.20e-13 | 3.29e-11 | 47 |
| GO:00344701 | Liver | Cirrhotic | ncRNA processing | 158/4634 | 395/18723 | 1.09e-11 | 6.96e-10 | 158 |
| GO:00346603 | Liver | Cirrhotic | ncRNA metabolic process | 173/4634 | 485/18723 | 3.64e-08 | 1.21e-06 | 173 |
| GO:00004702 | Liver | Cirrhotic | maturation of LSU-rRNA | 19/4634 | 28/18723 | 1.84e-06 | 3.48e-05 | 19 |
| GO:0000460 | Liver | Cirrhotic | maturation of 5.8S rRNA | 17/4634 | 35/18723 | 1.93e-03 | 1.21e-02 | 17 |
| Page: 1 2 3 4 5 |
| Pathway ID | Tissue | Disease Stage | Description | Gene Ratio | Bg Ratio | pvalue | p.adjust | qvalue | Count |
| Page: 1 |
Top |
Cell-cell communication analysis |
| Identification of potential cell-cell interactions between two cell types and their ligand-receptor pairs for different disease states |
| Ligand | Receptor | LRpair | Pathway | Tissue | Disease Stage |
| Page: 1 |
Top |
Single-cell gene regulatory network inference analysis |
| Find out the significant the regulons (TFs) and the target genes of each regulon across cell types for different disease states |
| TF | Cell Type | Tissue | Disease Stage | Target Gene | RSS | Regulon Activity |
| ∗The dot plots of a searched regulon are shown for all cell subpopulations in each disease state of each tissue based on the regulon specific score inferred using pySCENIC and by calculating the average expression. |
| Page: 1 |
Top |
Somatic mutation of malignant transformation related genes |
| Annotation of somatic variants for genes involved in malignant transformation |
| Hugo Symbol | Variant Class | Variant Classification | dbSNP RS | HGVSc | HGVSp | HGVSp Short | SWISSPROT | BIOTYPE | SIFT | PolyPhen | Tumor Sample Barcode | Tissue | Histology | Sex | Age | Stage | Therapy Types | Drugs | Outcome |
| PES1 | SNV | Missense_Mutation | rs774125501 | c.643G>A | p.Val215Met | p.V215M | O00541 | protein_coding | deleterious(0.03) | possibly_damaging(0.56) | TCGA-A2-A3XY-01 | Breast | breast invasive carcinoma | Female | <65 | I/II | Chemotherapy | adriamycin | PD |
| PES1 | SNV | Missense_Mutation | c.50N>G | p.Tyr17Cys | p.Y17C | O00541 | protein_coding | deleterious(0) | probably_damaging(0.997) | TCGA-A8-A09Z-01 | Breast | breast invasive carcinoma | Female | >=65 | I/II | Unknown | Unknown | SD | |
| PES1 | SNV | Missense_Mutation | c.1453G>A | p.Glu485Lys | p.E485K | O00541 | protein_coding | tolerated(0.48) | benign(0.021) | TCGA-AN-A0XW-01 | Breast | breast invasive carcinoma | Female | <65 | III/IV | Unknown | Unknown | SD | |
| PES1 | insertion | Nonsense_Mutation | novel | c.281_282insCTTTTAGTAGAGACTGGGTTTCCCCATGTTGGCCAGGCT | p.Lys94delinsAsnPheTerTerArgLeuGlyPheProMetLeuAlaArgLeu | p.K94delinsNF**RLGFPMLARL | O00541 | protein_coding | TCGA-A8-A094-01 | Breast | breast invasive carcinoma | Female | >=65 | I/II | Unknown | Unknown | SD | ||
| PES1 | insertion | Frame_Shift_Ins | novel | c.55_56insGAGTCAAAATAAGACTT | p.Thr19ArgfsTer17 | p.T19Rfs*17 | O00541 | protein_coding | TCGA-B6-A0I9-01 | Breast | breast invasive carcinoma | Female | <65 | III/IV | Unknown | Unknown | PD | ||
| PES1 | deletion | Frame_Shift_Del | novel | c.480delG | p.Cys161AlafsTer170 | p.C161Afs*170 | O00541 | protein_coding | TCGA-EW-A2FV-01 | Breast | breast invasive carcinoma | Female | <65 | III/IV | Chemotherapy | docetaxel | SD | ||
| PES1 | SNV | Missense_Mutation | rs781772847 | c.673N>A | p.Glu225Lys | p.E225K | O00541 | protein_coding | deleterious(0) | probably_damaging(0.976) | TCGA-2W-A8YY-01 | Cervix | cervical & endocervical cancer | Female | <65 | I/II | Chemotherapy | cisplatin | CR |
| PES1 | SNV | Missense_Mutation | c.1463N>T | p.Ser488Leu | p.S488L | O00541 | protein_coding | tolerated(0.2) | benign(0) | TCGA-Q1-A73O-01 | Cervix | cervical & endocervical cancer | Female | <65 | I/II | Chemotherapy | cisplatin | CR | |
| PES1 | SNV | Missense_Mutation | novel | c.1600N>A | p.Arg534Ser | p.R534S | O00541 | protein_coding | deleterious(0) | possibly_damaging(0.908) | TCGA-AA-3939-01 | Colorectum | colon adenocarcinoma | Male | >=65 | I/II | Unknown | Unknown | SD |
| PES1 | SNV | Missense_Mutation | c.1052G>A | p.Gly351Asp | p.G351D | O00541 | protein_coding | deleterious(0.03) | probably_damaging(0.992) | TCGA-AD-6964-01 | Colorectum | colon adenocarcinoma | Male | <65 | III/IV | Chemotherapy | folfox | PD |
| Page: 1 2 3 4 5 6 7 |
Top |
Related drugs of malignant transformation related genes |
| Identification of chemicals and drugs interact with genes involved in malignant transfromation |
| (DGIdb 4.0) |
| Entrez ID | Symbol | Category | Interaction Types | Drug Claim Name | Drug Name | PMIDs |
| Page: 1 |

Copyright 2023-Present -The University of Texas Health Science Center at Houston |