
|
|||||
|
 | |
| |
| |
| |
| |
| |
|
Gene: PERP |
Gene summary for PERP |
| Gene information | Species | Human | Gene symbol | PERP | Gene ID | 64065 |
| Gene name | p53 apoptosis effector related to PMP22 | |
| Gene Alias | EKVP7 | |
| Cytomap | 6q23.3 | |
| Gene Type | protein-coding | GO ID | GO:0002934 | UniProtAcc | Q96FX8 |
Top |
Malignant transformation analysis |
| Identification of the aberrant gene expression in precancerous and cancerous lesions by comparing the gene expression of stem-like cells in diseased tissues with normal stem cells |
| Entrez ID | Symbol | Replicates | Species | Organ | Tissue | Adj P-value | Log2FC | Malignancy |
| 64065 | PERP | GSM4909281 | Human | Breast | IDC | 1.53e-04 | -2.94e-01 | 0.21 |
| 64065 | PERP | GSM4909282 | Human | Breast | IDC | 1.15e-71 | 6.48e-01 | -0.0288 |
| 64065 | PERP | GSM4909285 | Human | Breast | IDC | 2.21e-63 | 6.73e-01 | 0.21 |
| 64065 | PERP | GSM4909286 | Human | Breast | IDC | 1.08e-02 | 2.48e-01 | 0.1081 |
| 64065 | PERP | GSM4909288 | Human | Breast | IDC | 2.10e-02 | -2.94e-01 | 0.0988 |
| 64065 | PERP | GSM4909289 | Human | Breast | IDC | 5.02e-07 | 3.32e-01 | 0.1064 |
| 64065 | PERP | GSM4909291 | Human | Breast | IDC | 3.08e-10 | -4.81e-01 | 0.1753 |
| 64065 | PERP | GSM4909293 | Human | Breast | IDC | 2.28e-12 | -3.40e-01 | 0.1581 |
| 64065 | PERP | GSM4909294 | Human | Breast | IDC | 1.55e-14 | -3.75e-01 | 0.2022 |
| 64065 | PERP | GSM4909295 | Human | Breast | IDC | 2.30e-02 | 2.50e-01 | 0.0898 |
| 64065 | PERP | GSM4909296 | Human | Breast | IDC | 3.30e-36 | -8.15e-01 | 0.1524 |
| 64065 | PERP | GSM4909297 | Human | Breast | IDC | 3.22e-35 | -6.87e-01 | 0.1517 |
| 64065 | PERP | GSM4909298 | Human | Breast | IDC | 2.74e-04 | -1.93e-01 | 0.1551 |
| 64065 | PERP | GSM4909301 | Human | Breast | IDC | 3.28e-43 | -8.90e-01 | 0.1577 |
| 64065 | PERP | GSM4909302 | Human | Breast | IDC | 3.79e-31 | -7.24e-01 | 0.1545 |
| 64065 | PERP | GSM4909304 | Human | Breast | IDC | 2.32e-47 | -8.80e-01 | 0.1636 |
| 64065 | PERP | GSM4909306 | Human | Breast | IDC | 3.00e-07 | -3.43e-01 | 0.1564 |
| 64065 | PERP | GSM4909307 | Human | Breast | IDC | 4.09e-32 | -6.89e-01 | 0.1569 |
| 64065 | PERP | GSM4909308 | Human | Breast | IDC | 5.78e-43 | -8.53e-01 | 0.158 |
| 64065 | PERP | GSM4909309 | Human | Breast | IDC | 1.42e-06 | -3.34e-01 | 0.0483 |
| Page: 1 2 3 4 5 6 7 8 9 10 11 12 13 14 15 16 |
| Tissue | Expression Dynamics | Abbreviation |
| Breast | 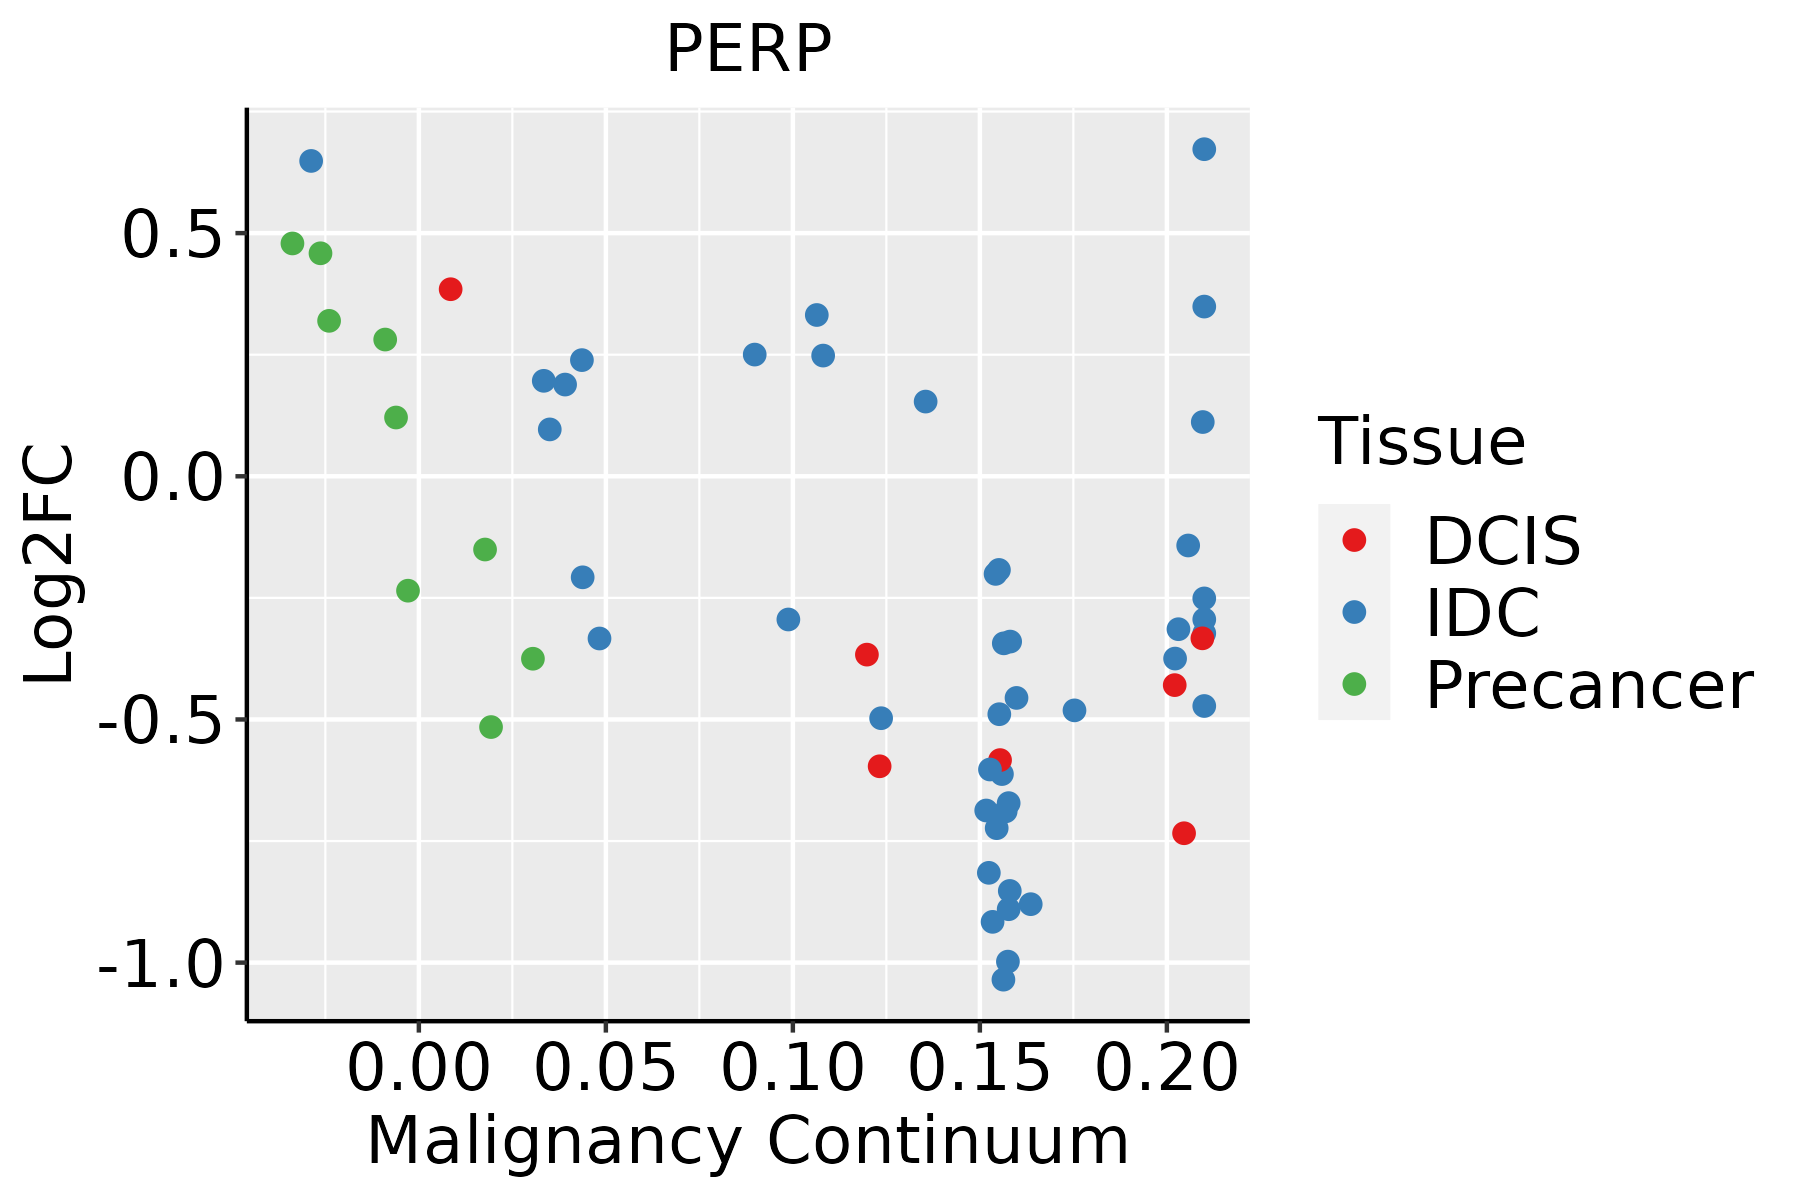 | IDC: Invasive ductal carcinoma |
| DCIS: Ductal carcinoma in situ | ||
| Precancer(BRCA1-mut): Precancerous lesion from BRCA1 mutation carriers | ||
| Cervix | 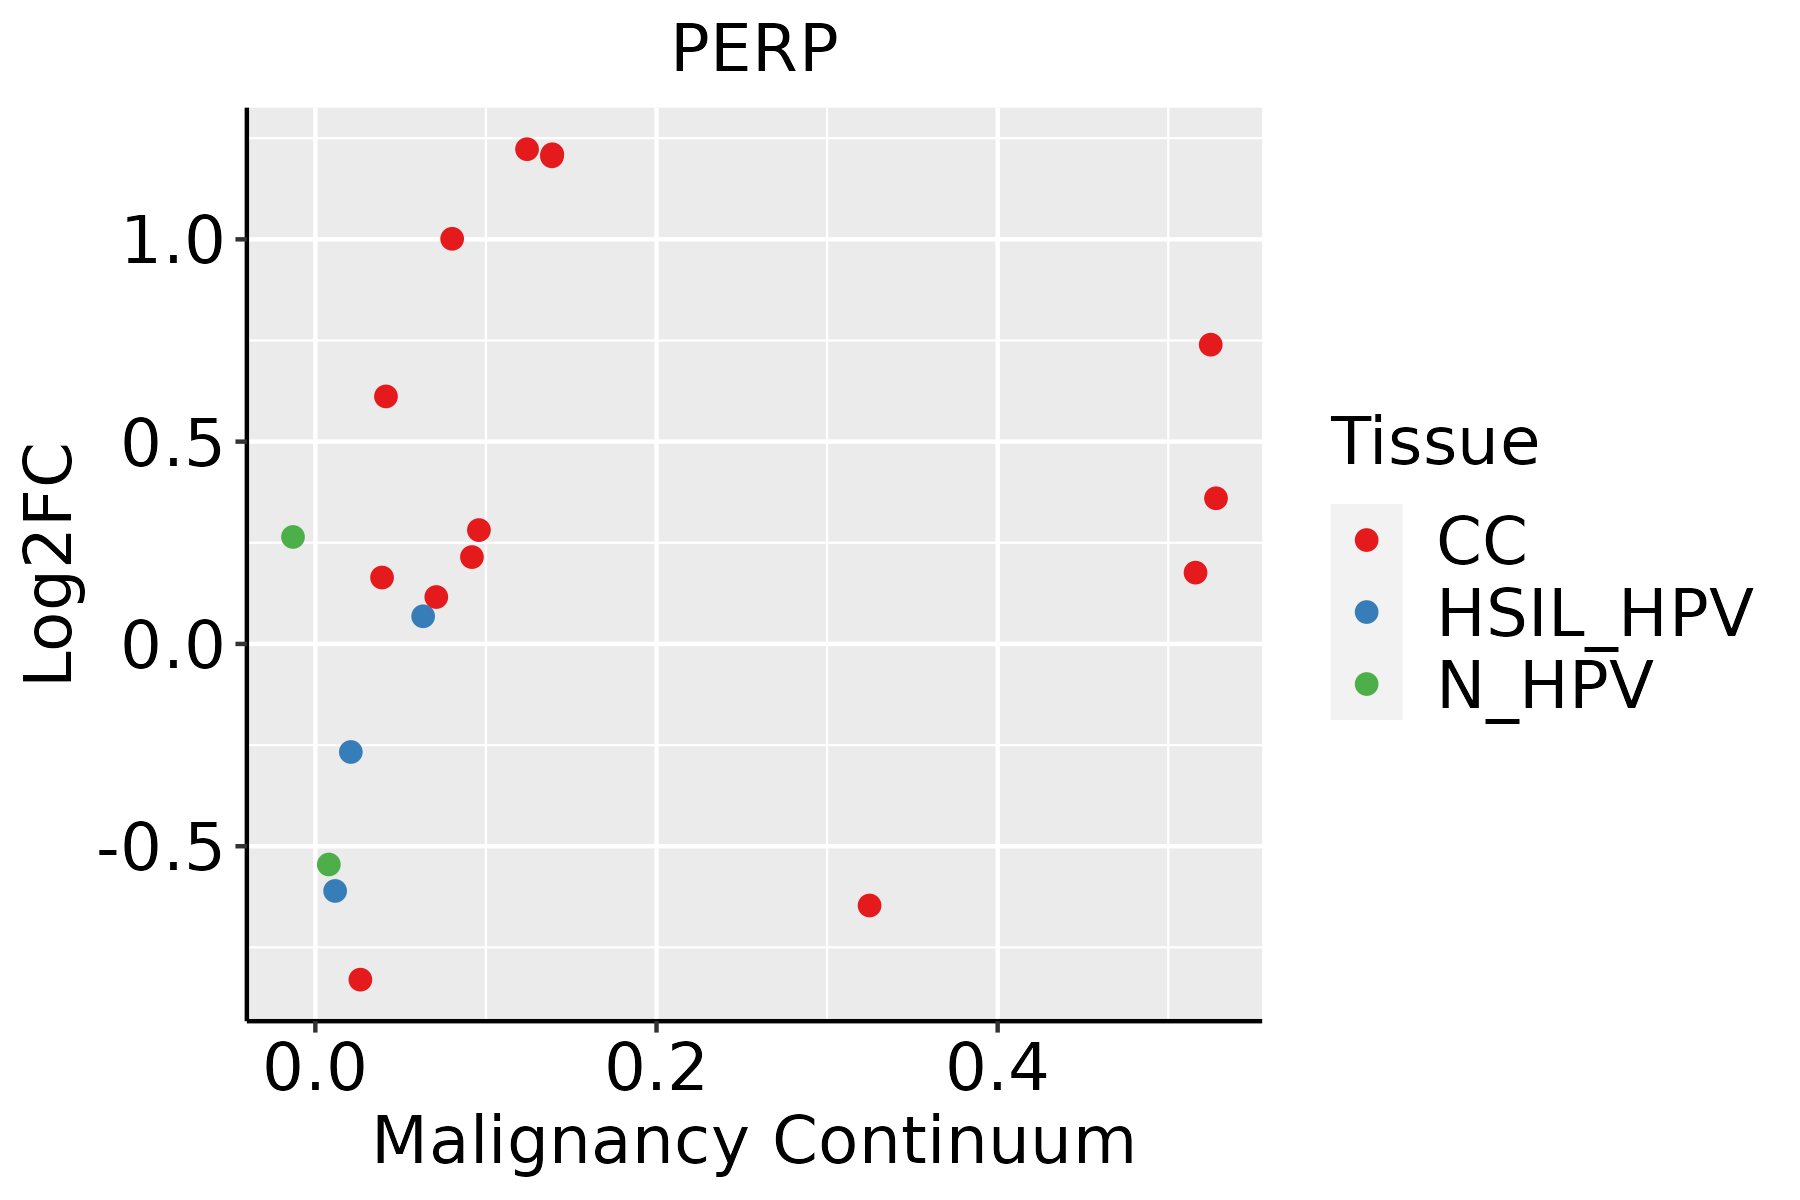 | CC: Cervix cancer |
| HSIL_HPV: HPV-infected high-grade squamous intraepithelial lesions | ||
| N_HPV: HPV-infected normal cervix | ||
| Colorectum (GSE201348) |  | FAP: Familial adenomatous polyposis |
| CRC: Colorectal cancer | ||
| Colorectum (HTA11) | 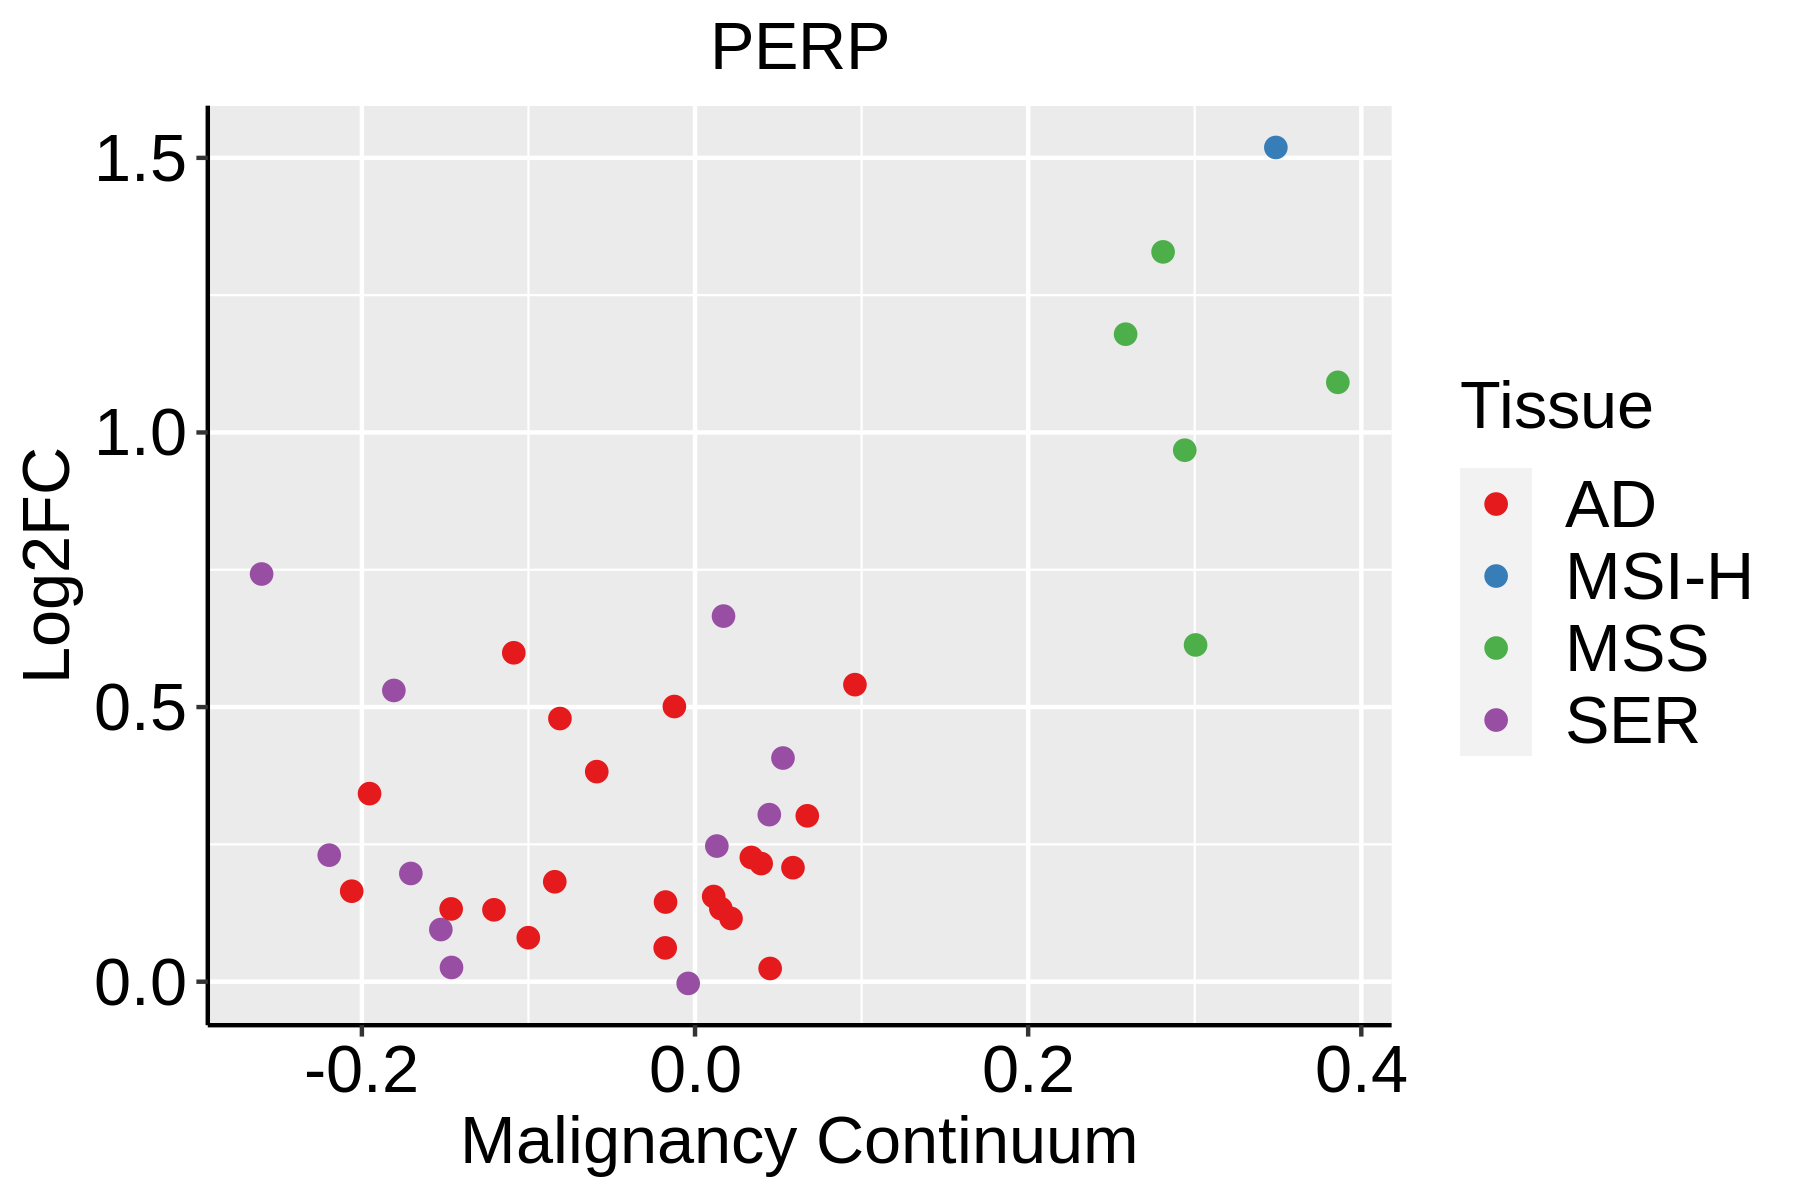 | AD: Adenomas |
| SER: Sessile serrated lesions | ||
| MSI-H: Microsatellite-high colorectal cancer | ||
| MSS: Microsatellite stable colorectal cancer | ||
| Endometrium | 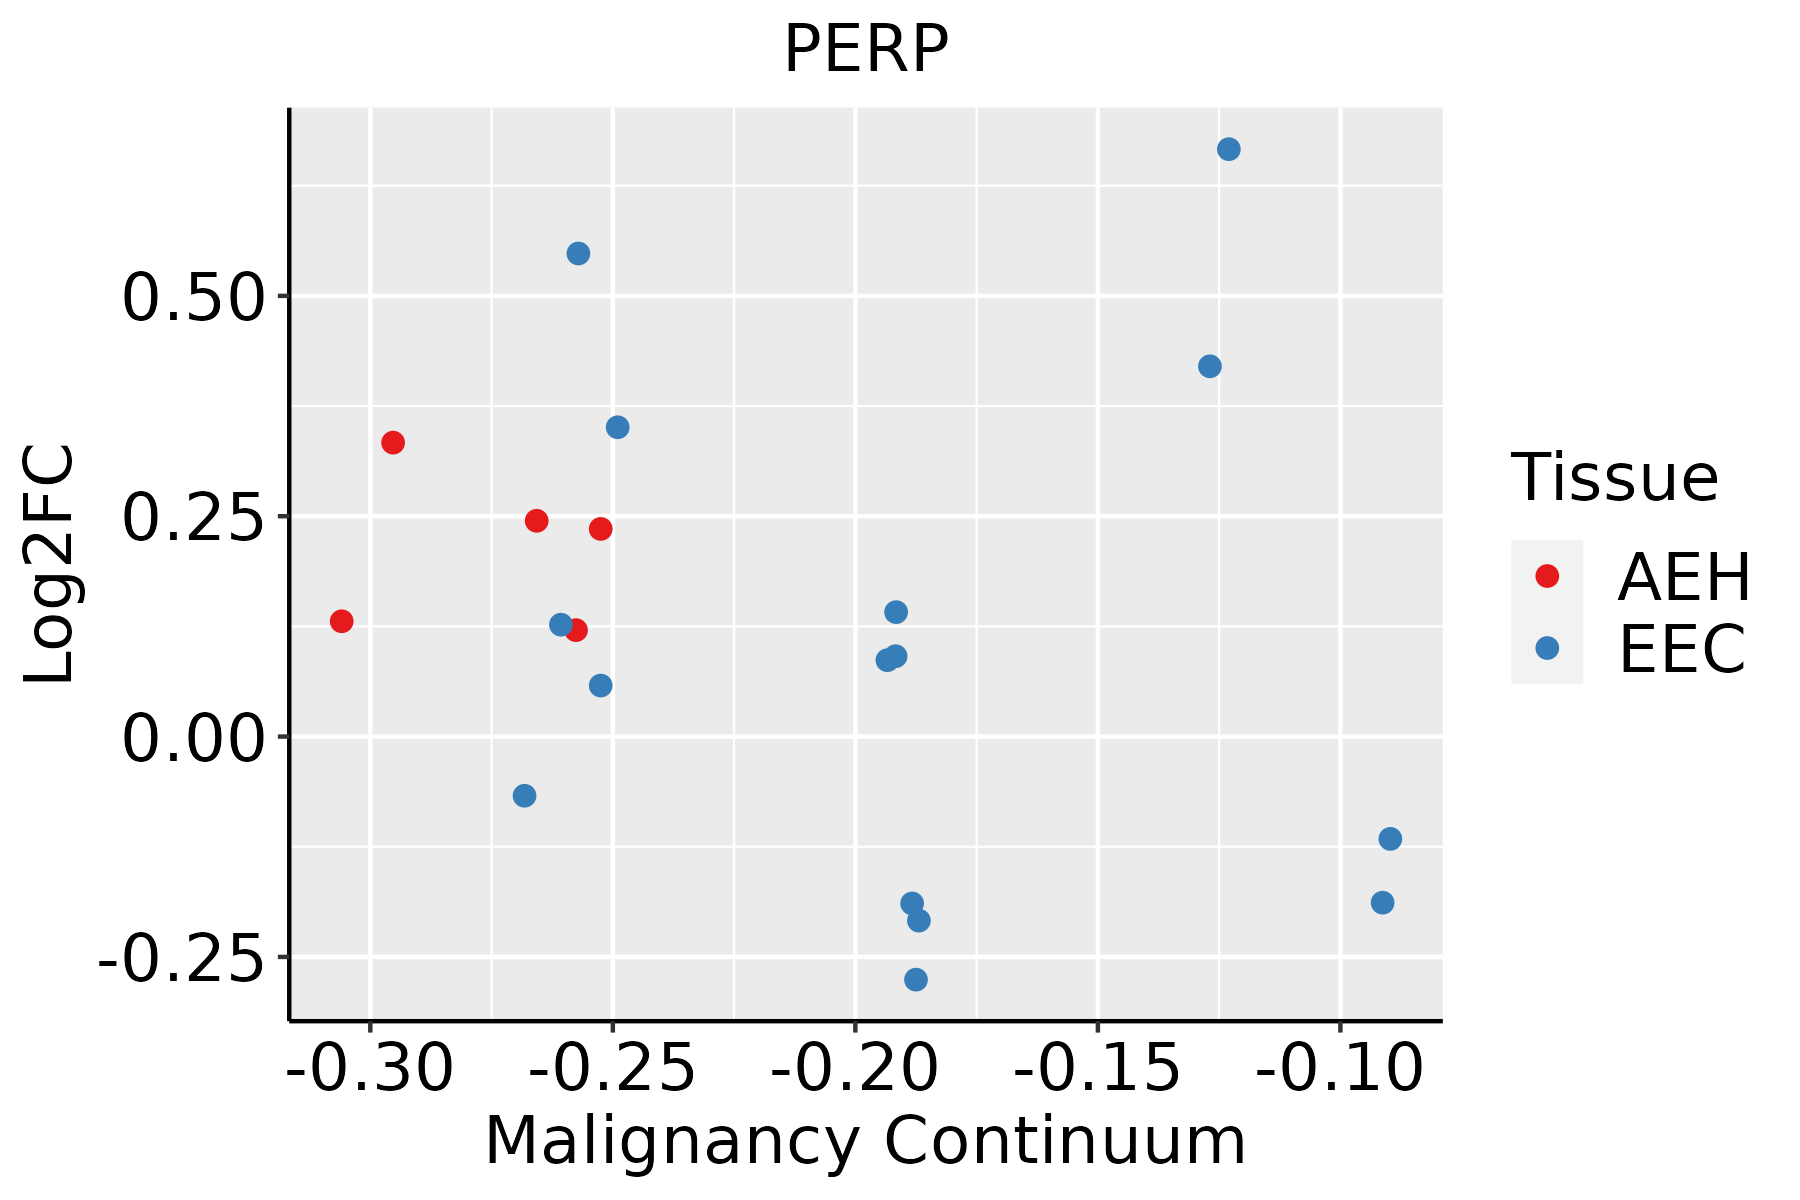 | AEH: Atypical endometrial hyperplasia |
| EEC: Endometrioid Cancer | ||
| Esophagus | 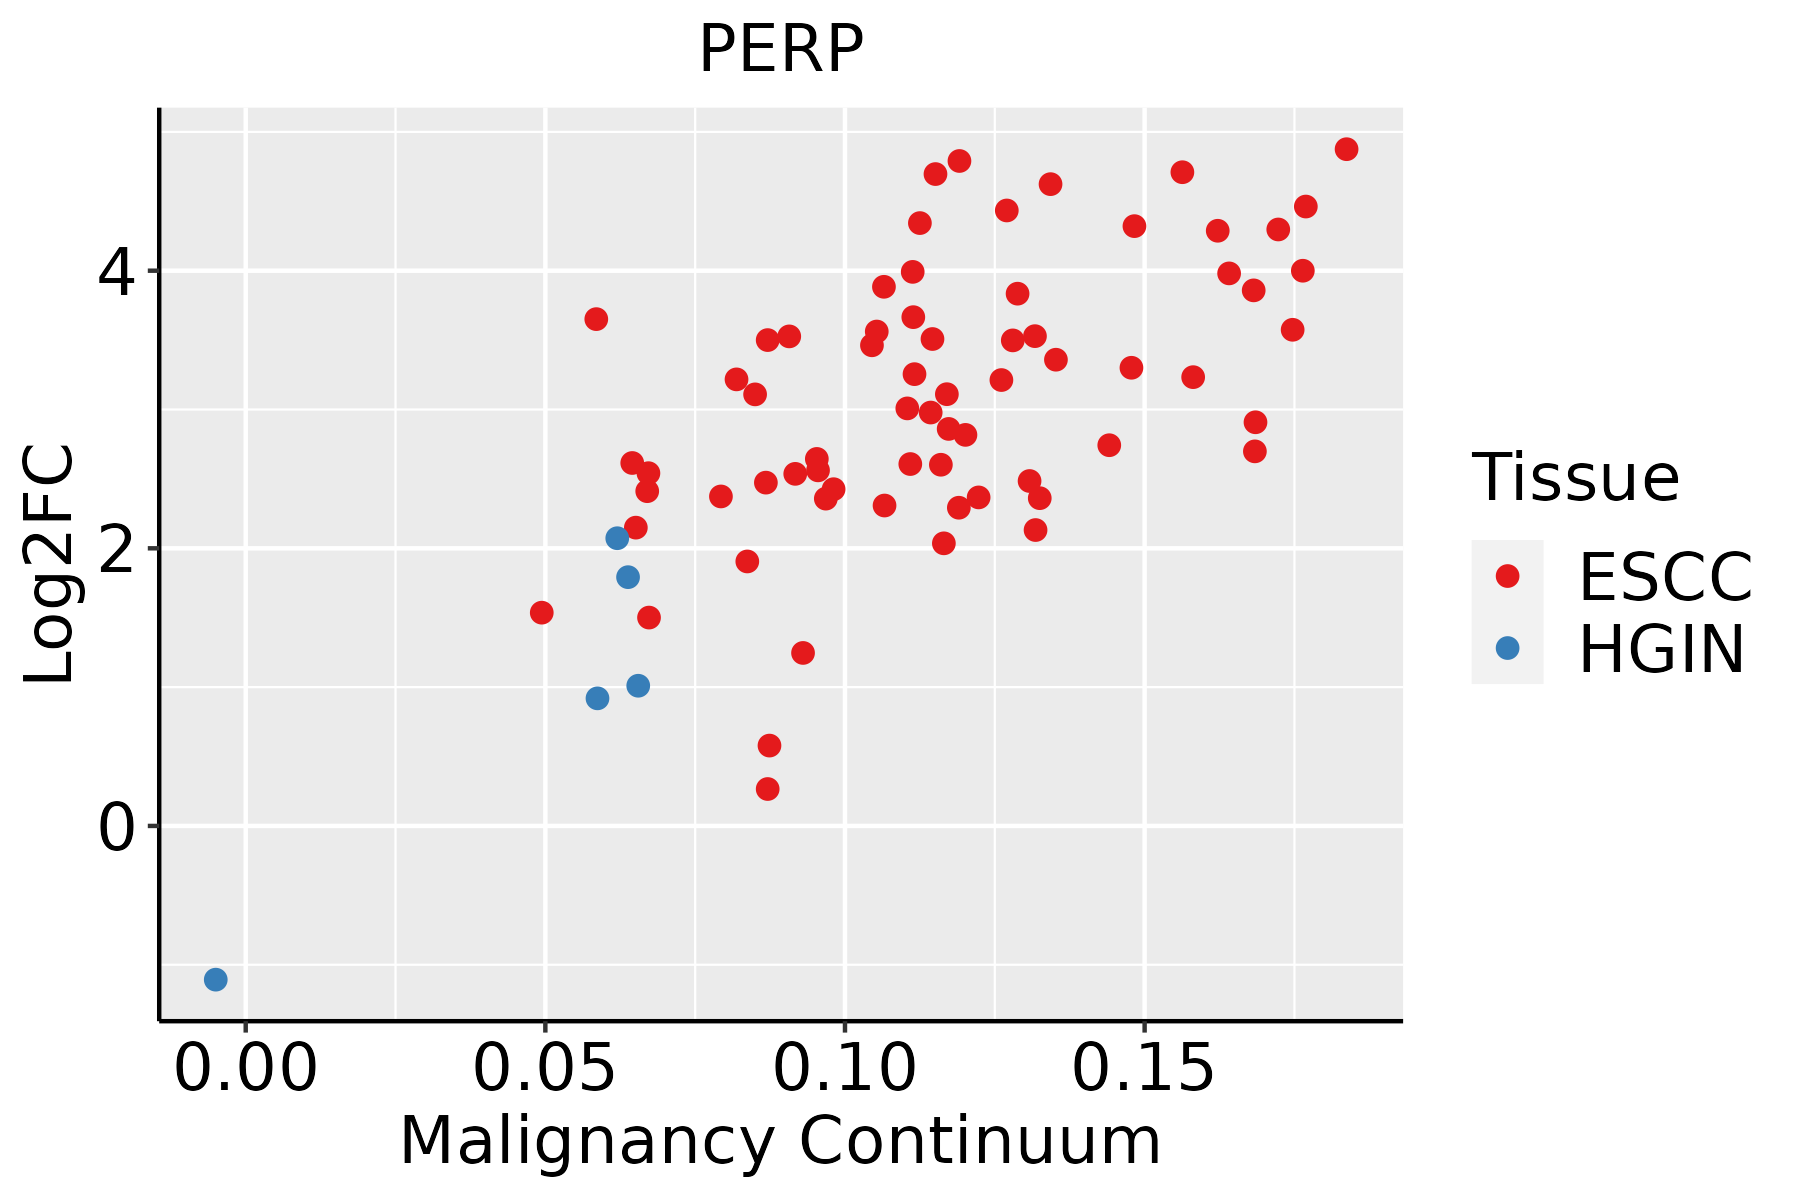 | ESCC: Esophageal squamous cell carcinoma |
| HGIN: High-grade intraepithelial neoplasias | ||
| LGIN: Low-grade intraepithelial neoplasias | ||
| GC |  | CAG: Chronic atrophic gastritis |
| CAG with IM: Chronic atrophic gastritis with intestinal metaplasia | ||
| CSG: Chronic superficial gastritis | ||
| GC: Gastric cancer | ||
| SIM: Severe intestinal metaplasia | ||
| WIM: Wild intestinal metaplasia | ||
| Liver | 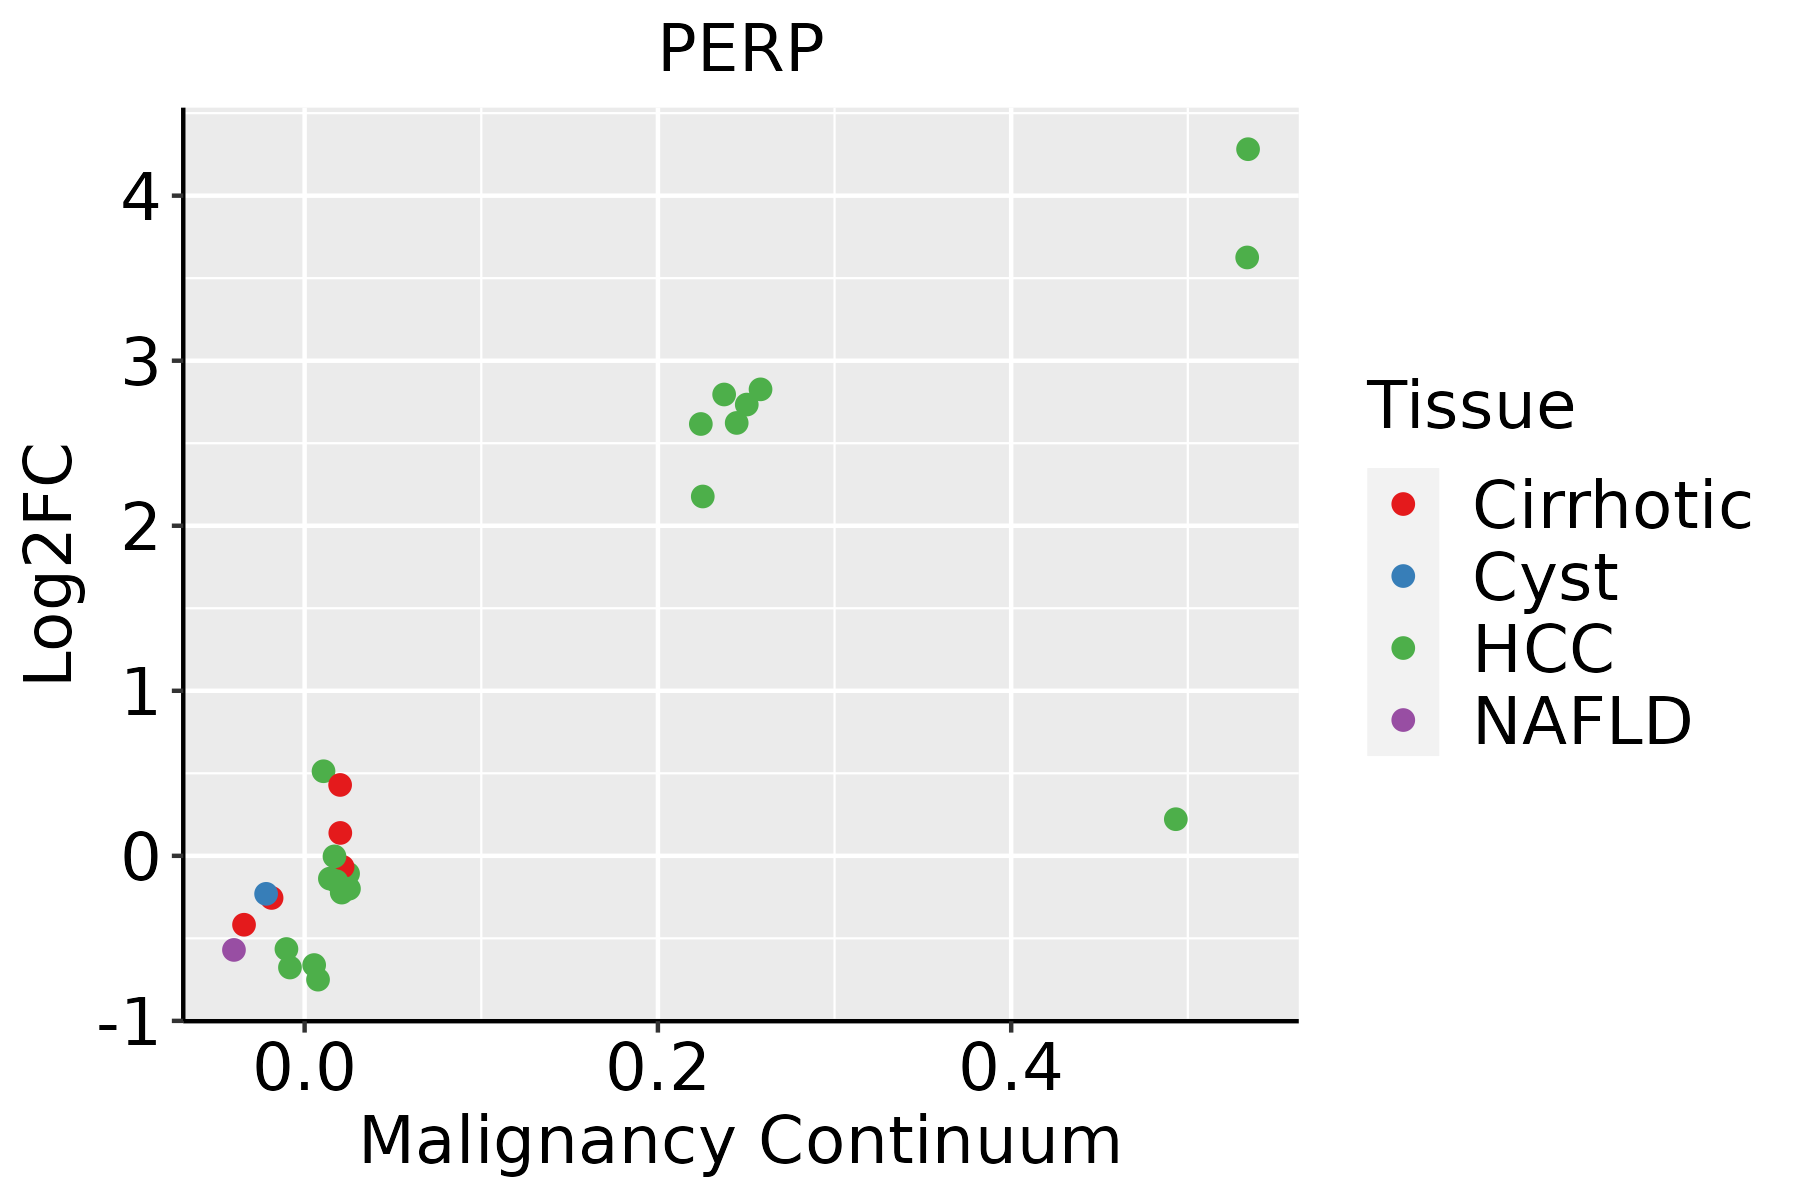 | HCC: Hepatocellular carcinoma |
| NAFLD: Non-alcoholic fatty liver disease | ||
| Oral Cavity | 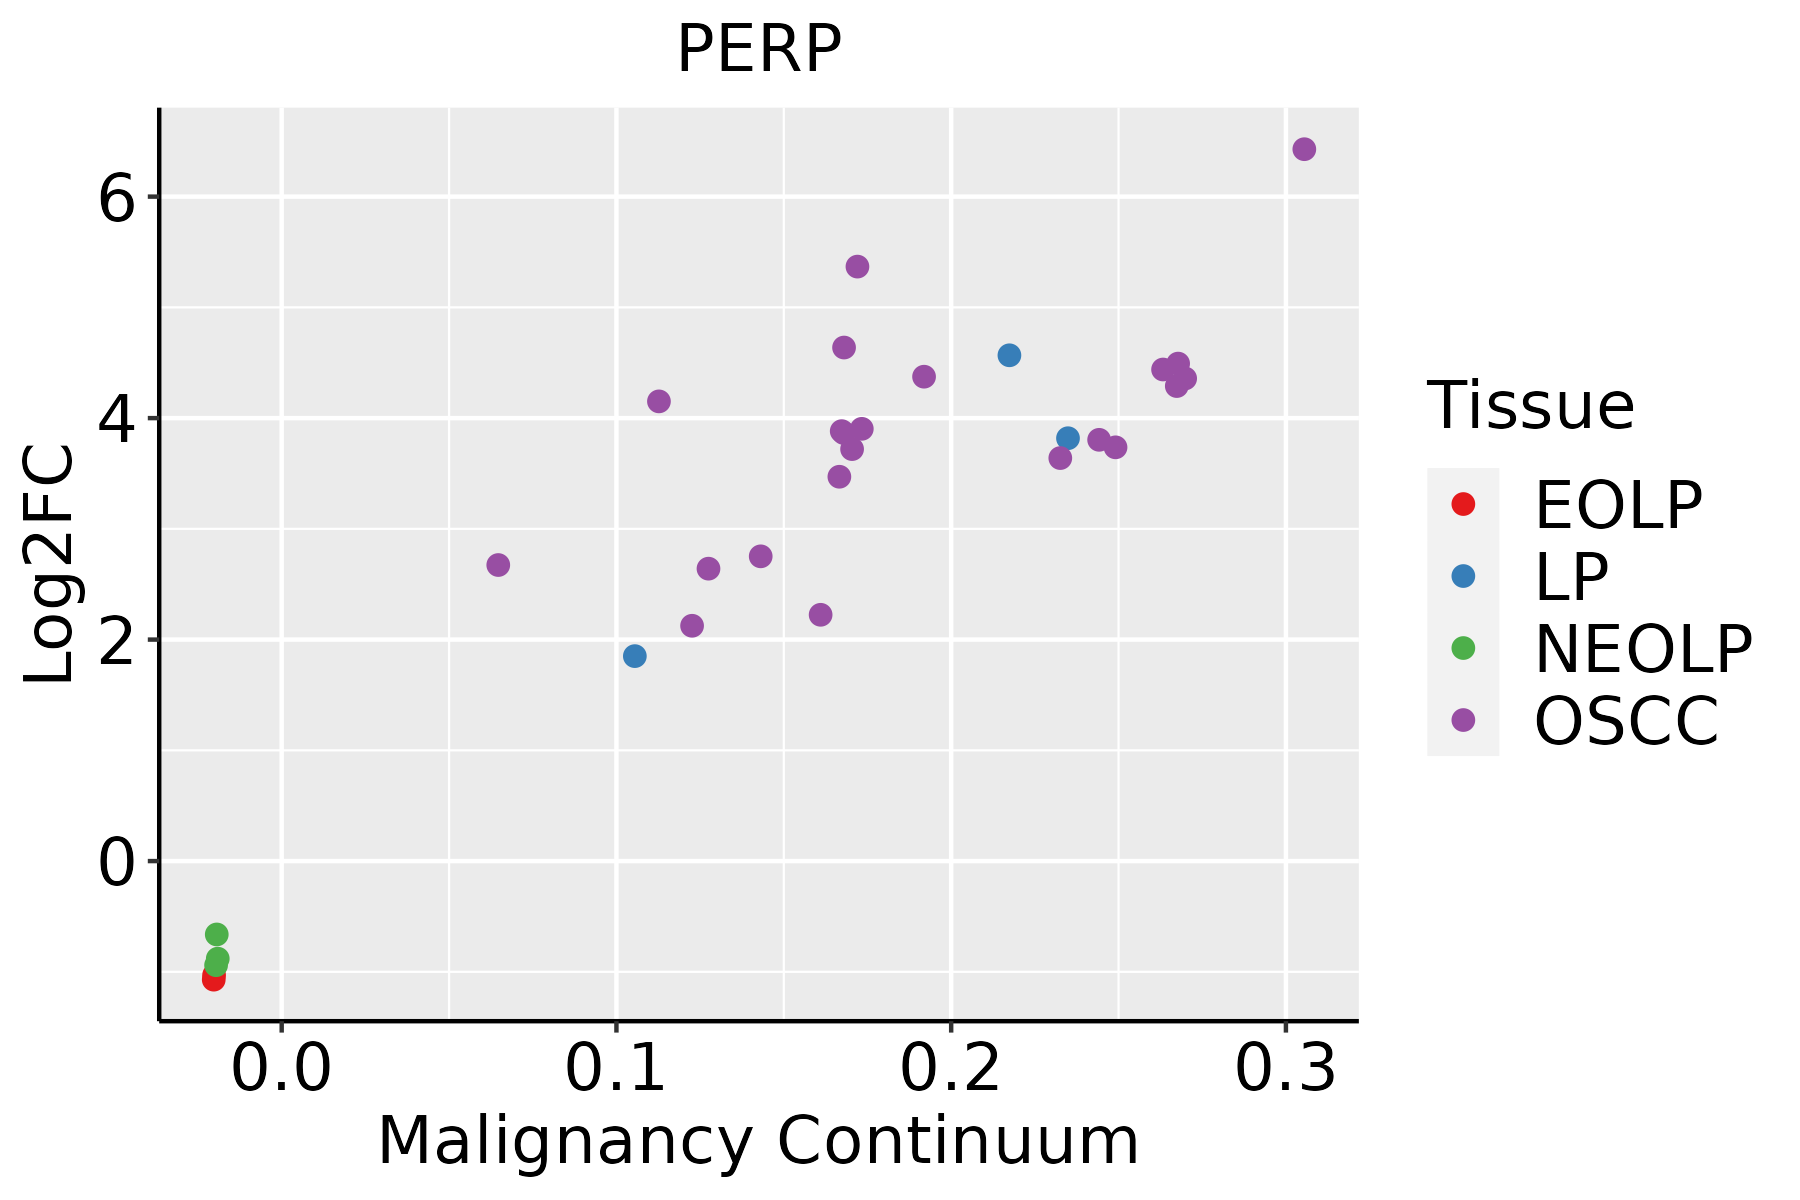 | EOLP: Erosive Oral lichen planus |
| LP: leukoplakia | ||
| NEOLP: Non-erosive oral lichen planus | ||
| OSCC: Oral squamous cell carcinoma | ||
| Prostate | 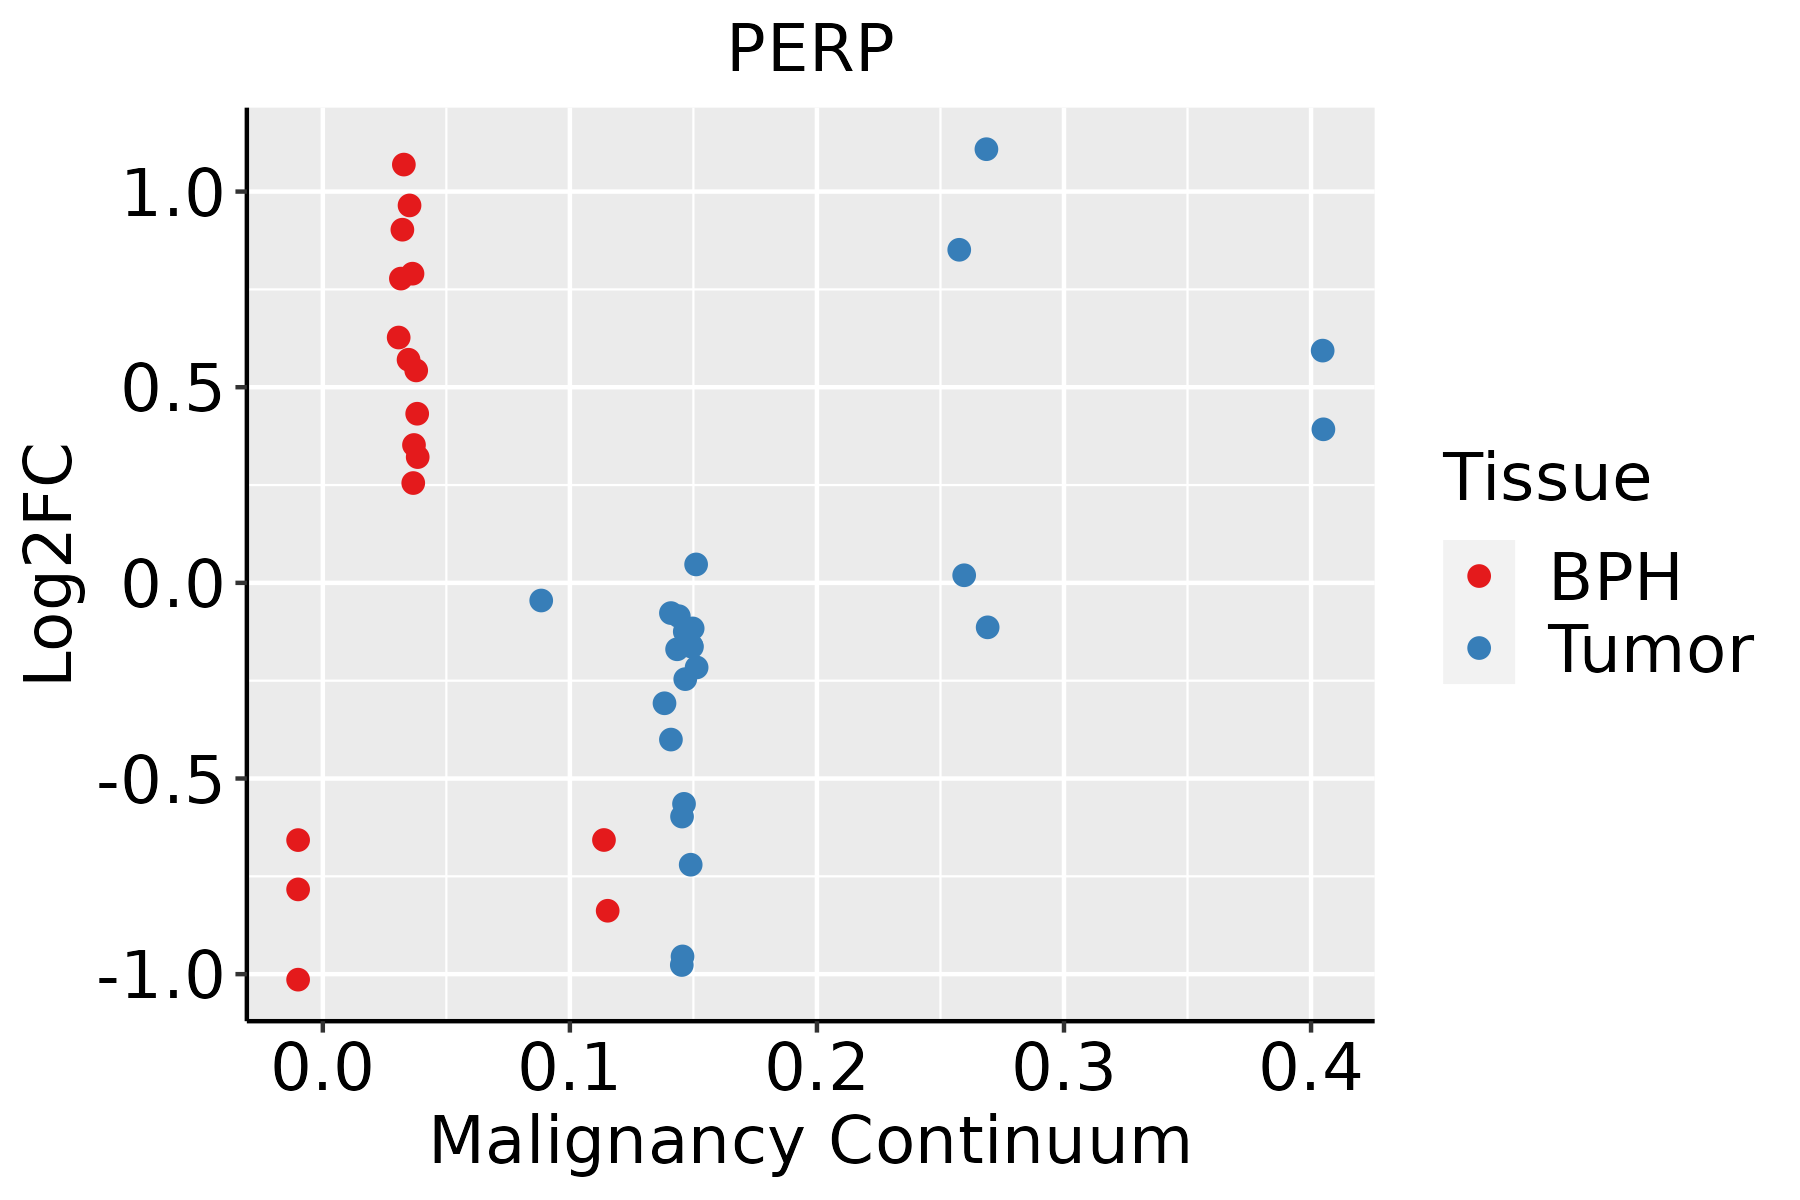 | BPH: Benign Prostatic Hyperplasia |
| Skin |  | AK: Actinic keratosis |
| cSCC: Cutaneous squamous cell carcinoma | ||
| SCCIS:squamous cell carcinoma in situ | ||
| Thyroid | 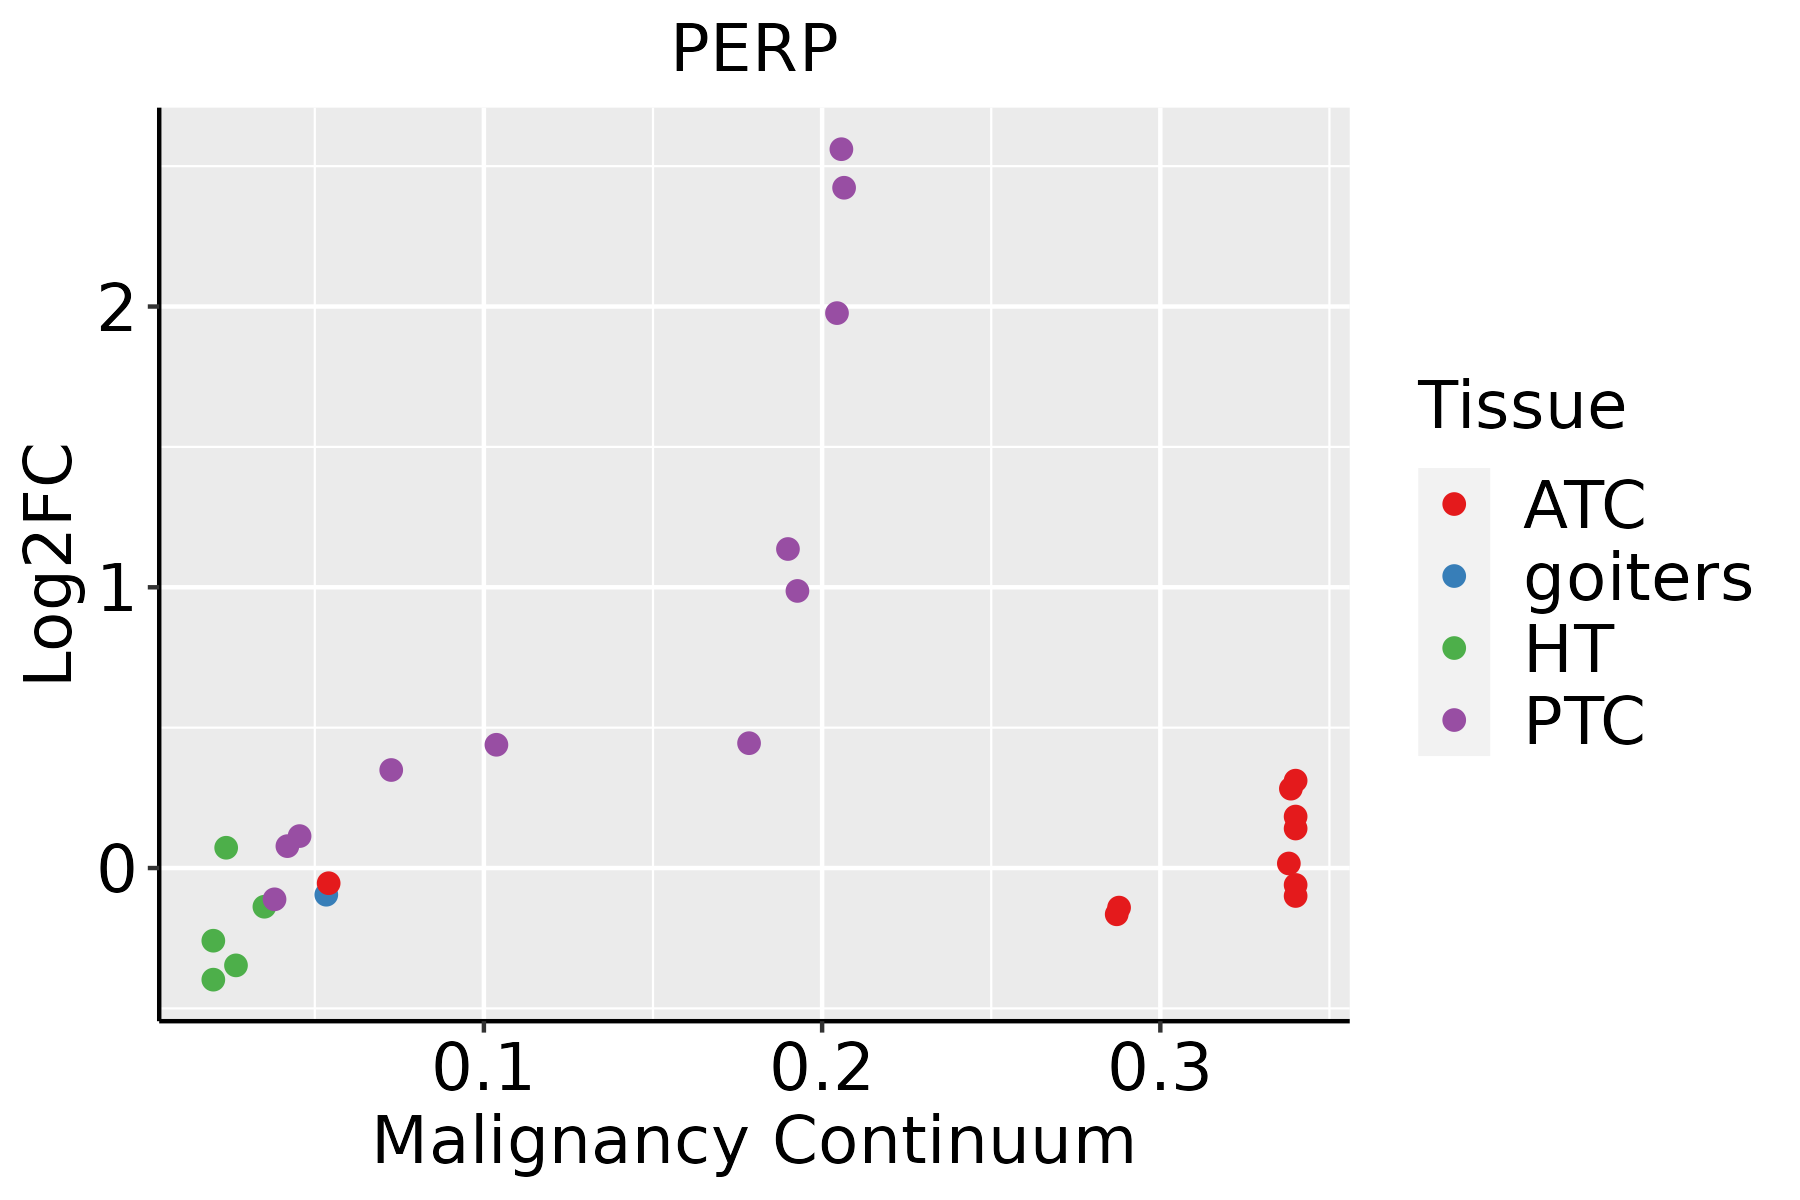 | ATC: Anaplastic thyroid cancer |
| HT: Hashimoto's thyroiditis | ||
| PTC: Papillary thyroid cancer |
| ∗log2FC in expression of this searched gene in stem-like cells from each diseased tissue sample relative to stem-like cells in normal samples in each tissue plotted against the malignancy continuum. Samples are colored based on if they are from different disease stage. |
Top |
Malignant transformation related pathway analysis |
| Find out the enriched GO biological processes and KEGG pathways involved in transition from healthy to precancer to cancer |
| Tissue | Disease Stage | Enriched GO biological Processes |
| Colorectum | AD |  |
| Colorectum | SER |  |
| Colorectum | MSS |  |
| Colorectum | MSI-H |  |
| Colorectum | FAP |  |
| ∗Top 15 enriched GO BP terms are showed in the bar plot of each disease state in each tissue. Each row represents a significant GO biological process which is colored according to the -log10(p.adjust). |
| Page: 1 2 3 4 5 6 7 8 9 |
| GO ID | Tissue | Disease Stage | Description | Gene Ratio | Bg Ratio | pvalue | p.adjust | Count |
| GO:00971939 | Breast | Precancer | intrinsic apoptotic signaling pathway | 59/1080 | 288/18723 | 8.07e-18 | 3.60e-15 | 59 |
| GO:00525479 | Breast | Precancer | regulation of peptidase activity | 71/1080 | 461/18723 | 2.72e-14 | 6.94e-12 | 71 |
| GO:00525489 | Breast | Precancer | regulation of endopeptidase activity | 67/1080 | 432/18723 | 1.06e-13 | 2.36e-11 | 67 |
| GO:20001169 | Breast | Precancer | regulation of cysteine-type endopeptidase activity | 43/1080 | 235/18723 | 1.30e-11 | 1.83e-09 | 43 |
| GO:00458629 | Breast | Precancer | positive regulation of proteolysis | 51/1080 | 372/18723 | 7.77e-09 | 5.70e-07 | 51 |
| GO:00109529 | Breast | Precancer | positive regulation of peptidase activity | 33/1080 | 197/18723 | 3.01e-08 | 1.89e-06 | 33 |
| GO:00109509 | Breast | Precancer | positive regulation of endopeptidase activity | 29/1080 | 179/18723 | 4.23e-07 | 1.90e-05 | 29 |
| GO:20010568 | Breast | Precancer | positive regulation of cysteine-type endopeptidase activity | 25/1080 | 148/18723 | 1.19e-06 | 4.60e-05 | 25 |
| GO:00723319 | Breast | Precancer | signal transduction by p53 class mediator | 26/1080 | 163/18723 | 2.23e-06 | 7.76e-05 | 26 |
| GO:00723328 | Breast | Precancer | intrinsic apoptotic signaling pathway by p53 class mediator | 16/1080 | 76/18723 | 5.49e-06 | 1.63e-04 | 16 |
| GO:00516047 | Breast | Precancer | protein maturation | 28/1080 | 294/18723 | 6.45e-03 | 4.50e-02 | 28 |
| GO:005254714 | Breast | IDC | regulation of peptidase activity | 96/1434 | 461/18723 | 7.58e-20 | 6.15e-17 | 96 |
| GO:009719314 | Breast | IDC | intrinsic apoptotic signaling pathway | 69/1434 | 288/18723 | 6.32e-18 | 2.99e-15 | 69 |
| GO:005254814 | Breast | IDC | regulation of endopeptidase activity | 88/1434 | 432/18723 | 1.20e-17 | 4.85e-15 | 88 |
| GO:200011614 | Breast | IDC | regulation of cysteine-type endopeptidase activity | 55/1434 | 235/18723 | 4.25e-14 | 1.21e-11 | 55 |
| GO:004586214 | Breast | IDC | positive regulation of proteolysis | 66/1434 | 372/18723 | 9.76e-11 | 1.29e-08 | 66 |
| GO:001095214 | Breast | IDC | positive regulation of peptidase activity | 40/1434 | 197/18723 | 1.04e-08 | 7.67e-07 | 40 |
| GO:200105613 | Breast | IDC | positive regulation of cysteine-type endopeptidase activity | 31/1434 | 148/18723 | 2.22e-07 | 1.17e-05 | 31 |
| GO:001095013 | Breast | IDC | positive regulation of endopeptidase activity | 35/1434 | 179/18723 | 2.24e-07 | 1.17e-05 | 35 |
| GO:007233214 | Breast | IDC | intrinsic apoptotic signaling pathway by p53 class mediator | 19/1434 | 76/18723 | 3.14e-06 | 1.16e-04 | 19 |
| Page: 1 2 3 4 5 6 7 8 9 10 11 12 13 14 15 16 17 18 19 20 21 22 23 |
| Pathway ID | Tissue | Disease Stage | Description | Gene Ratio | Bg Ratio | pvalue | p.adjust | qvalue | Count |
| hsa041157 | Breast | IDC | p53 signaling pathway | 16/867 | 74/8465 | 2.86e-03 | 1.86e-02 | 1.39e-02 | 16 |
| hsa0411512 | Breast | IDC | p53 signaling pathway | 16/867 | 74/8465 | 2.86e-03 | 1.86e-02 | 1.39e-02 | 16 |
| hsa0411521 | Breast | DCIS | p53 signaling pathway | 16/846 | 74/8465 | 2.23e-03 | 1.47e-02 | 1.08e-02 | 16 |
| hsa0411531 | Breast | DCIS | p53 signaling pathway | 16/846 | 74/8465 | 2.23e-03 | 1.47e-02 | 1.08e-02 | 16 |
| hsa0411524 | Esophagus | ESCC | p53 signaling pathway | 65/4205 | 74/8465 | 3.88e-12 | 6.50e-11 | 3.33e-11 | 65 |
| hsa0411534 | Esophagus | ESCC | p53 signaling pathway | 65/4205 | 74/8465 | 3.88e-12 | 6.50e-11 | 3.33e-11 | 65 |
| hsa041156 | Liver | HCC | p53 signaling pathway | 46/4020 | 74/8465 | 7.64e-03 | 2.08e-02 | 1.16e-02 | 46 |
| hsa0411511 | Liver | HCC | p53 signaling pathway | 46/4020 | 74/8465 | 7.64e-03 | 2.08e-02 | 1.16e-02 | 46 |
| hsa041159 | Oral cavity | OSCC | p53 signaling pathway | 57/3704 | 74/8465 | 4.99e-09 | 5.07e-08 | 2.58e-08 | 57 |
| hsa0411514 | Oral cavity | OSCC | p53 signaling pathway | 57/3704 | 74/8465 | 4.99e-09 | 5.07e-08 | 2.58e-08 | 57 |
| hsa0411523 | Oral cavity | LP | p53 signaling pathway | 38/2418 | 74/8465 | 2.82e-05 | 1.92e-04 | 1.24e-04 | 38 |
| hsa0411533 | Oral cavity | LP | p53 signaling pathway | 38/2418 | 74/8465 | 2.82e-05 | 1.92e-04 | 1.24e-04 | 38 |
| hsa041158 | Prostate | BPH | p53 signaling pathway | 30/1718 | 74/8465 | 5.15e-05 | 3.40e-04 | 2.10e-04 | 30 |
| hsa0411513 | Prostate | BPH | p53 signaling pathway | 30/1718 | 74/8465 | 5.15e-05 | 3.40e-04 | 2.10e-04 | 30 |
| hsa0411522 | Prostate | Tumor | p53 signaling pathway | 29/1791 | 74/8465 | 2.99e-04 | 1.65e-03 | 1.02e-03 | 29 |
| hsa0411532 | Prostate | Tumor | p53 signaling pathway | 29/1791 | 74/8465 | 2.99e-04 | 1.65e-03 | 1.02e-03 | 29 |
| hsa04115 | Stomach | GC | p53 signaling pathway | 13/708 | 74/8465 | 7.76e-03 | 4.10e-02 | 2.88e-02 | 13 |
| hsa041151 | Stomach | GC | p53 signaling pathway | 13/708 | 74/8465 | 7.76e-03 | 4.10e-02 | 2.88e-02 | 13 |
| hsa041152 | Stomach | CAG with IM | p53 signaling pathway | 12/640 | 74/8465 | 9.02e-03 | 4.86e-02 | 3.41e-02 | 12 |
| hsa041153 | Stomach | CAG with IM | p53 signaling pathway | 12/640 | 74/8465 | 9.02e-03 | 4.86e-02 | 3.41e-02 | 12 |
| Page: 1 2 |
Top |
Cell-cell communication analysis |
| Identification of potential cell-cell interactions between two cell types and their ligand-receptor pairs for different disease states |
| Ligand | Receptor | LRpair | Pathway | Tissue | Disease Stage |
| Page: 1 |
Top |
Single-cell gene regulatory network inference analysis |
| Find out the significant the regulons (TFs) and the target genes of each regulon across cell types for different disease states |
| TF | Cell Type | Tissue | Disease Stage | Target Gene | RSS | Regulon Activity |
| ∗The dot plots of a searched regulon are shown for all cell subpopulations in each disease state of each tissue based on the regulon specific score inferred using pySCENIC and by calculating the average expression. |
| Page: 1 |
Top |
Somatic mutation of malignant transformation related genes |
| Annotation of somatic variants for genes involved in malignant transformation |
| Hugo Symbol | Variant Class | Variant Classification | dbSNP RS | HGVSc | HGVSp | HGVSp Short | SWISSPROT | BIOTYPE | SIFT | PolyPhen | Tumor Sample Barcode | Tissue | Histology | Sex | Age | Stage | Therapy Types | Drugs | Outcome |
| PERP | SNV | Missense_Mutation | c.460N>A | p.Gly154Ser | p.G154S | Q96FX8 | protein_coding | deleterious(0.01) | probably_damaging(1) | TCGA-BH-A0DQ-01 | Breast | breast invasive carcinoma | Female | <65 | I/II | Chemotherapy | doxorubicin | SD | |
| PERP | SNV | Missense_Mutation | c.295N>G | p.Leu99Val | p.L99V | Q96FX8 | protein_coding | tolerated(0.07) | probably_damaging(0.936) | TCGA-C8-A12T-01 | Breast | breast invasive carcinoma | Female | <65 | I/II | Unknown | Unknown | SD | |
| PERP | SNV | Missense_Mutation | c.184G>A | p.Glu62Lys | p.E62K | Q96FX8 | protein_coding | tolerated(0.47) | benign(0.018) | TCGA-DR-A0ZM-01 | Cervix | cervical & endocervical cancer | Female | <65 | III/IV | Unspecific | Cisplatin | SD | |
| PERP | SNV | Missense_Mutation | c.295N>A | p.Leu99Ile | p.L99I | Q96FX8 | protein_coding | tolerated(0.22) | probably_damaging(0.914) | TCGA-AP-A051-01 | Endometrium | uterine corpus endometrioid carcinoma | Female | >=65 | I/II | Unknown | Unknown | SD | |
| PERP | SNV | Missense_Mutation | novel | c.56T>C | p.Leu19Pro | p.L19P | Q96FX8 | protein_coding | deleterious(0) | probably_damaging(0.999) | TCGA-AP-A054-01 | Endometrium | uterine corpus endometrioid carcinoma | Female | <65 | III/IV | Chemotherapy | carboplatin | PD |
| PERP | SNV | Missense_Mutation | novel | c.197N>G | p.Gln66Arg | p.Q66R | Q96FX8 | protein_coding | tolerated(0.59) | benign(0) | TCGA-AP-A1DK-01 | Endometrium | uterine corpus endometrioid carcinoma | Female | <65 | I/II | Unknown | Unknown | SD |
| PERP | SNV | Missense_Mutation | c.512G>A | p.Cys171Tyr | p.C171Y | Q96FX8 | protein_coding | deleterious(0) | probably_damaging(0.997) | TCGA-AX-A0J1-01 | Endometrium | uterine corpus endometrioid carcinoma | Female | >=65 | I/II | Unknown | Unknown | SD | |
| PERP | SNV | Missense_Mutation | novel | c.571A>G | p.Thr191Ala | p.T191A | Q96FX8 | protein_coding | deleterious(0.01) | benign(0) | TCGA-B5-A3FA-01 | Endometrium | uterine corpus endometrioid carcinoma | Female | >=65 | I/II | Unknown | Unknown | SD |
| PERP | SNV | Missense_Mutation | novel | c.122N>G | p.His41Arg | p.H41R | Q96FX8 | protein_coding | tolerated(0.28) | benign(0) | TCGA-DF-A2KY-01 | Endometrium | uterine corpus endometrioid carcinoma | Female | <65 | III/IV | Chemotherapy | carboplatin | SD |
| PERP | SNV | Missense_Mutation | novel | c.100G>T | p.Gly34Cys | p.G34C | Q96FX8 | protein_coding | deleterious(0) | possibly_damaging(0.829) | TCGA-NJ-A4YQ-01 | Lung | lung adenocarcinoma | Female | >=65 | I/II | Unknown | Unknown | SD |
| Page: 1 2 |
Top |
Related drugs of malignant transformation related genes |
| Identification of chemicals and drugs interact with genes involved in malignant transfromation |
| (DGIdb 4.0) |
| Entrez ID | Symbol | Category | Interaction Types | Drug Claim Name | Drug Name | PMIDs |
| 64065 | PERP | NA | cyclophosphamide | CYCLOPHOSPHAMIDE | ||
| 64065 | PERP | NA | fluorouracil | FLUOROURACIL | ||
| 64065 | PERP | NA | epirubicin | EPIRUBICIN |
| Page: 1 |

Copyright 2023-Present -The University of Texas Health Science Center at Houston |