
|
|||||
|
 | |
| |
| |
| |
| |
| |
|
Gene: PER3 |
Gene summary for PER3 |
| Gene information | Species | Human | Gene symbol | PER3 | Gene ID | 8863 |
| Gene name | period circadian regulator 3 | |
| Gene Alias | FASPS3 | |
| Cytomap | 1p36.23 | |
| Gene Type | protein-coding | GO ID | GO:0000122 | UniProtAcc | A0A087WV69 |
Top |
Malignant transformation analysis |
| Identification of the aberrant gene expression in precancerous and cancerous lesions by comparing the gene expression of stem-like cells in diseased tissues with normal stem cells |
| Entrez ID | Symbol | Replicates | Species | Organ | Tissue | Adj P-value | Log2FC | Malignancy |
| 8863 | PER3 | CA_HPV_3 | Human | Cervix | CC | 2.95e-18 | 3.64e-01 | 0.0414 |
| 8863 | PER3 | CCI_2 | Human | Cervix | CC | 7.89e-21 | 1.87e+00 | 0.5249 |
| 8863 | PER3 | CCI_3 | Human | Cervix | CC | 2.53e-22 | 1.24e+00 | 0.516 |
| 8863 | PER3 | LZE4T | Human | Esophagus | ESCC | 1.41e-04 | 1.41e-01 | 0.0811 |
| 8863 | PER3 | LZE5T | Human | Esophagus | ESCC | 3.07e-06 | 4.19e-01 | 0.0514 |
| 8863 | PER3 | LZE22D1 | Human | Esophagus | HGIN | 1.23e-02 | 1.48e-01 | 0.0595 |
| 8863 | PER3 | LZE24T | Human | Esophagus | ESCC | 9.06e-07 | 2.20e-01 | 0.0596 |
| 8863 | PER3 | P1T-E | Human | Esophagus | ESCC | 5.16e-04 | 2.59e-01 | 0.0875 |
| 8863 | PER3 | P2T-E | Human | Esophagus | ESCC | 2.42e-22 | 4.64e-01 | 0.1177 |
| 8863 | PER3 | P4T-E | Human | Esophagus | ESCC | 1.77e-05 | 1.12e-01 | 0.1323 |
| 8863 | PER3 | P8T-E | Human | Esophagus | ESCC | 2.03e-09 | 1.18e-01 | 0.0889 |
| 8863 | PER3 | P10T-E | Human | Esophagus | ESCC | 9.85e-18 | 3.89e-01 | 0.116 |
| 8863 | PER3 | P11T-E | Human | Esophagus | ESCC | 2.06e-05 | 3.04e-01 | 0.1426 |
| 8863 | PER3 | P12T-E | Human | Esophagus | ESCC | 7.13e-24 | 4.94e-01 | 0.1122 |
| 8863 | PER3 | P15T-E | Human | Esophagus | ESCC | 3.34e-07 | 2.29e-01 | 0.1149 |
| 8863 | PER3 | P17T-E | Human | Esophagus | ESCC | 9.21e-04 | 2.43e-01 | 0.1278 |
| 8863 | PER3 | P20T-E | Human | Esophagus | ESCC | 5.88e-16 | 4.32e-01 | 0.1124 |
| 8863 | PER3 | P21T-E | Human | Esophagus | ESCC | 7.77e-17 | 4.00e-01 | 0.1617 |
| 8863 | PER3 | P22T-E | Human | Esophagus | ESCC | 2.16e-05 | 3.09e-02 | 0.1236 |
| 8863 | PER3 | P23T-E | Human | Esophagus | ESCC | 1.77e-09 | 1.98e-01 | 0.108 |
| Page: 1 2 3 4 |
| Tissue | Expression Dynamics | Abbreviation |
| Cervix | 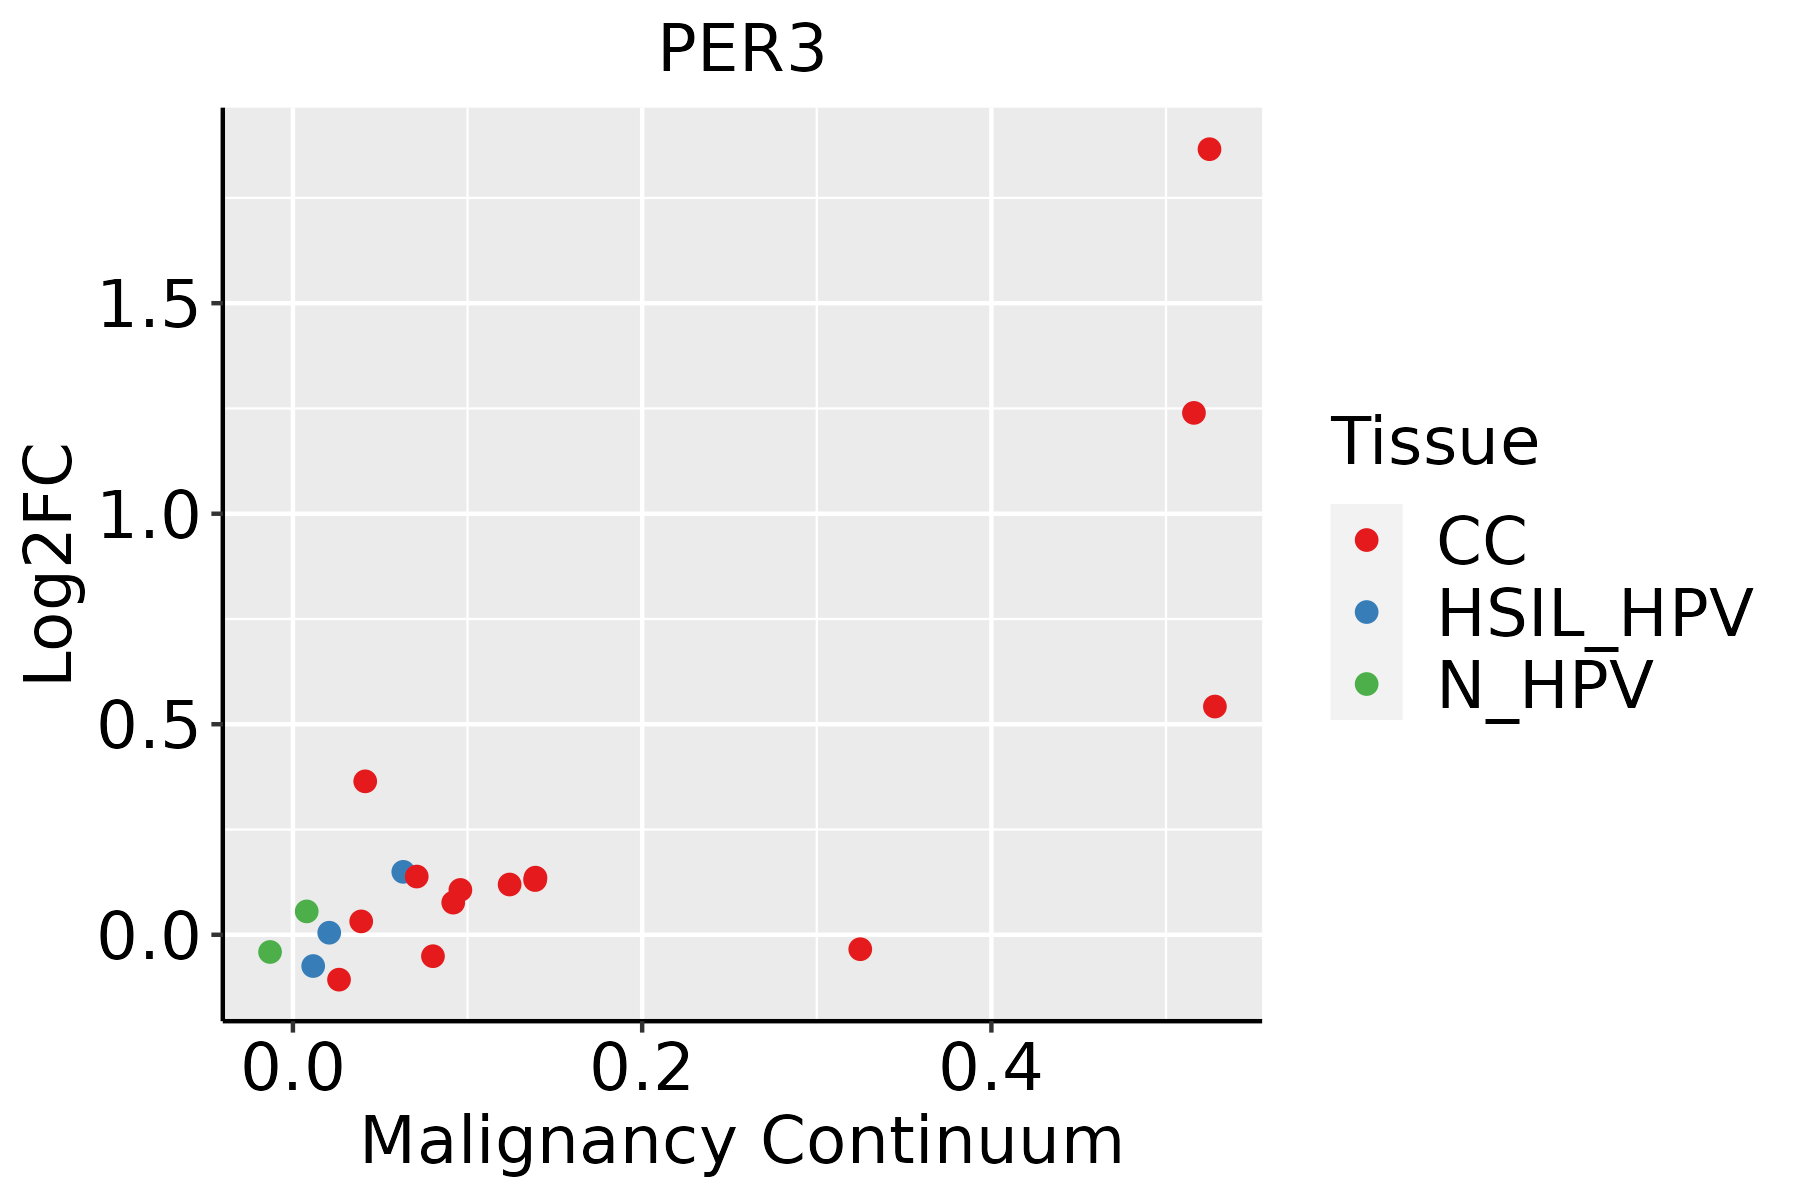 | CC: Cervix cancer |
| HSIL_HPV: HPV-infected high-grade squamous intraepithelial lesions | ||
| N_HPV: HPV-infected normal cervix | ||
| Esophagus |  | ESCC: Esophageal squamous cell carcinoma |
| HGIN: High-grade intraepithelial neoplasias | ||
| LGIN: Low-grade intraepithelial neoplasias | ||
| Lung | 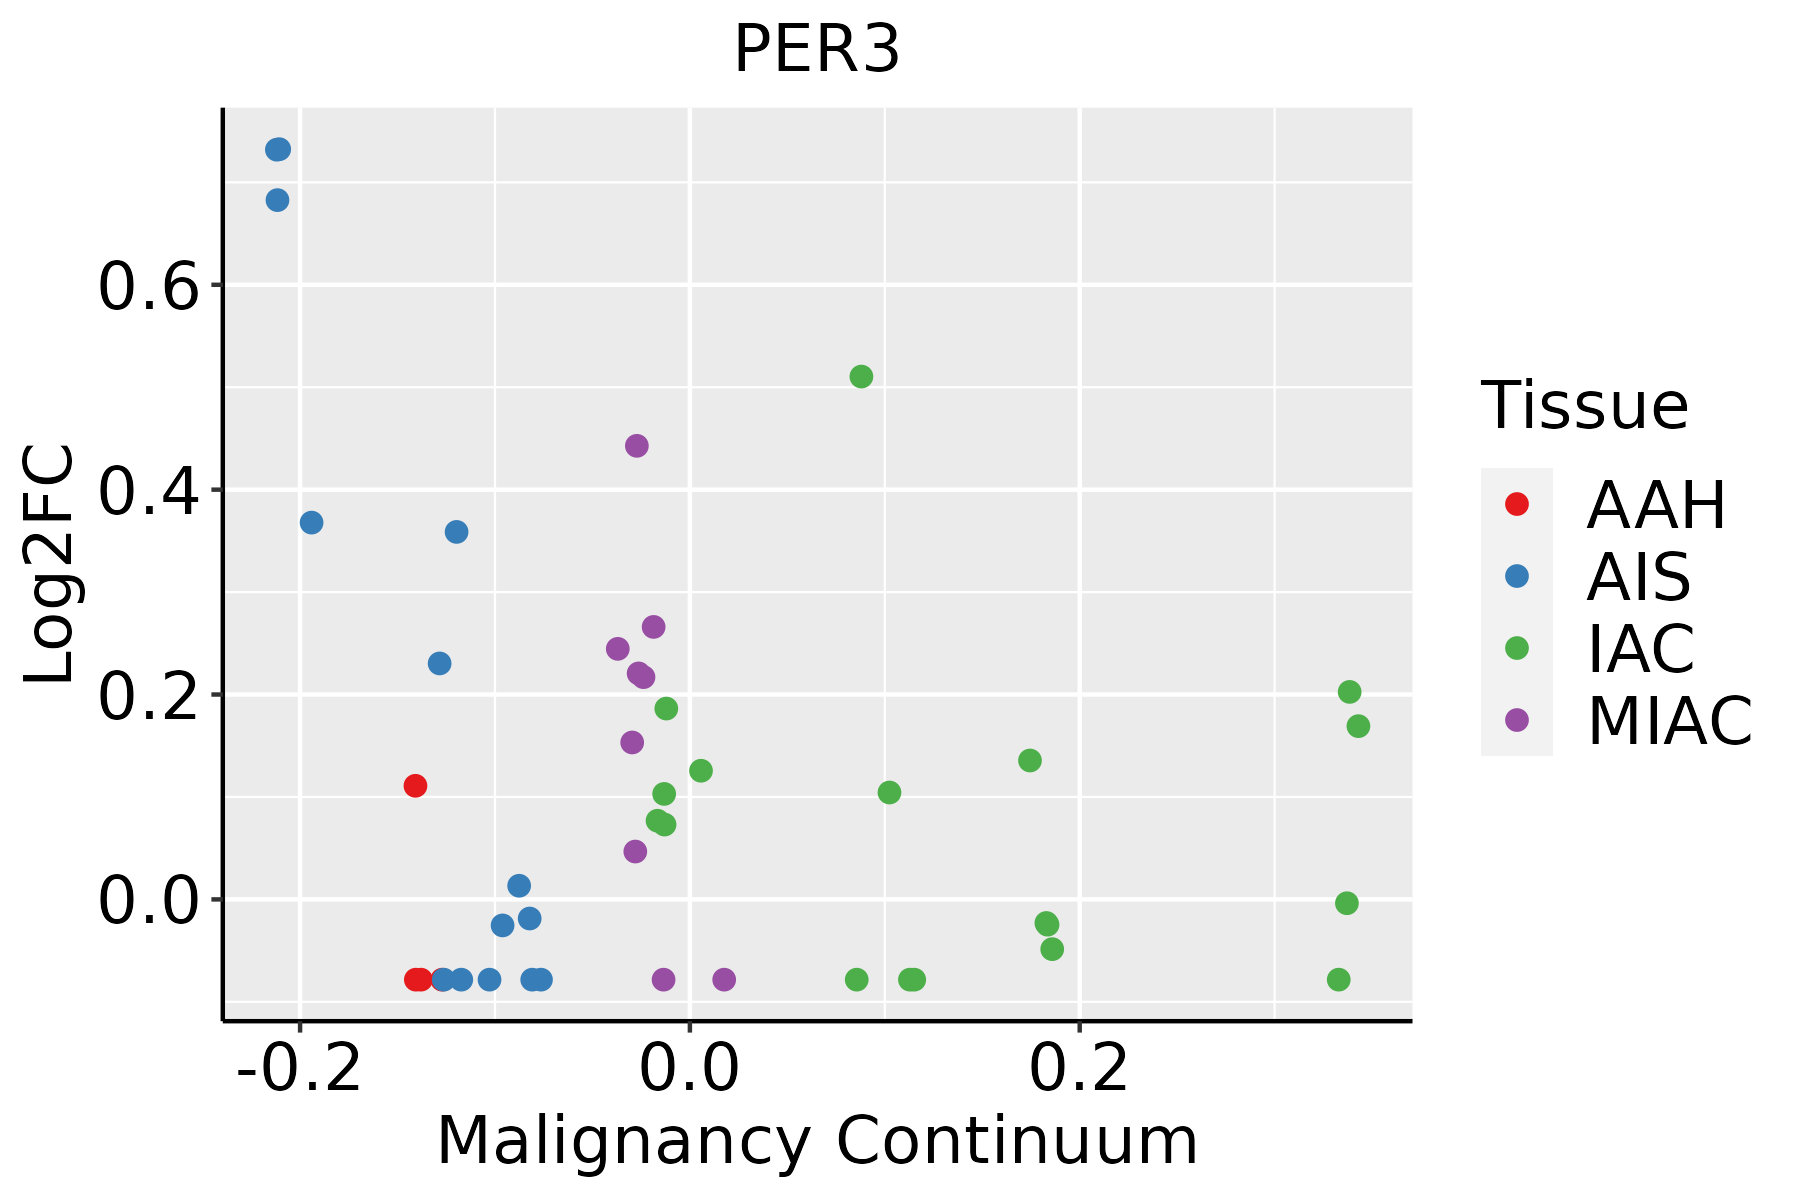 | AAH: Atypical adenomatous hyperplasia |
| AIS: Adenocarcinoma in situ | ||
| IAC: Invasive lung adenocarcinoma | ||
| MIA: Minimally invasive adenocarcinoma | ||
| Skin | 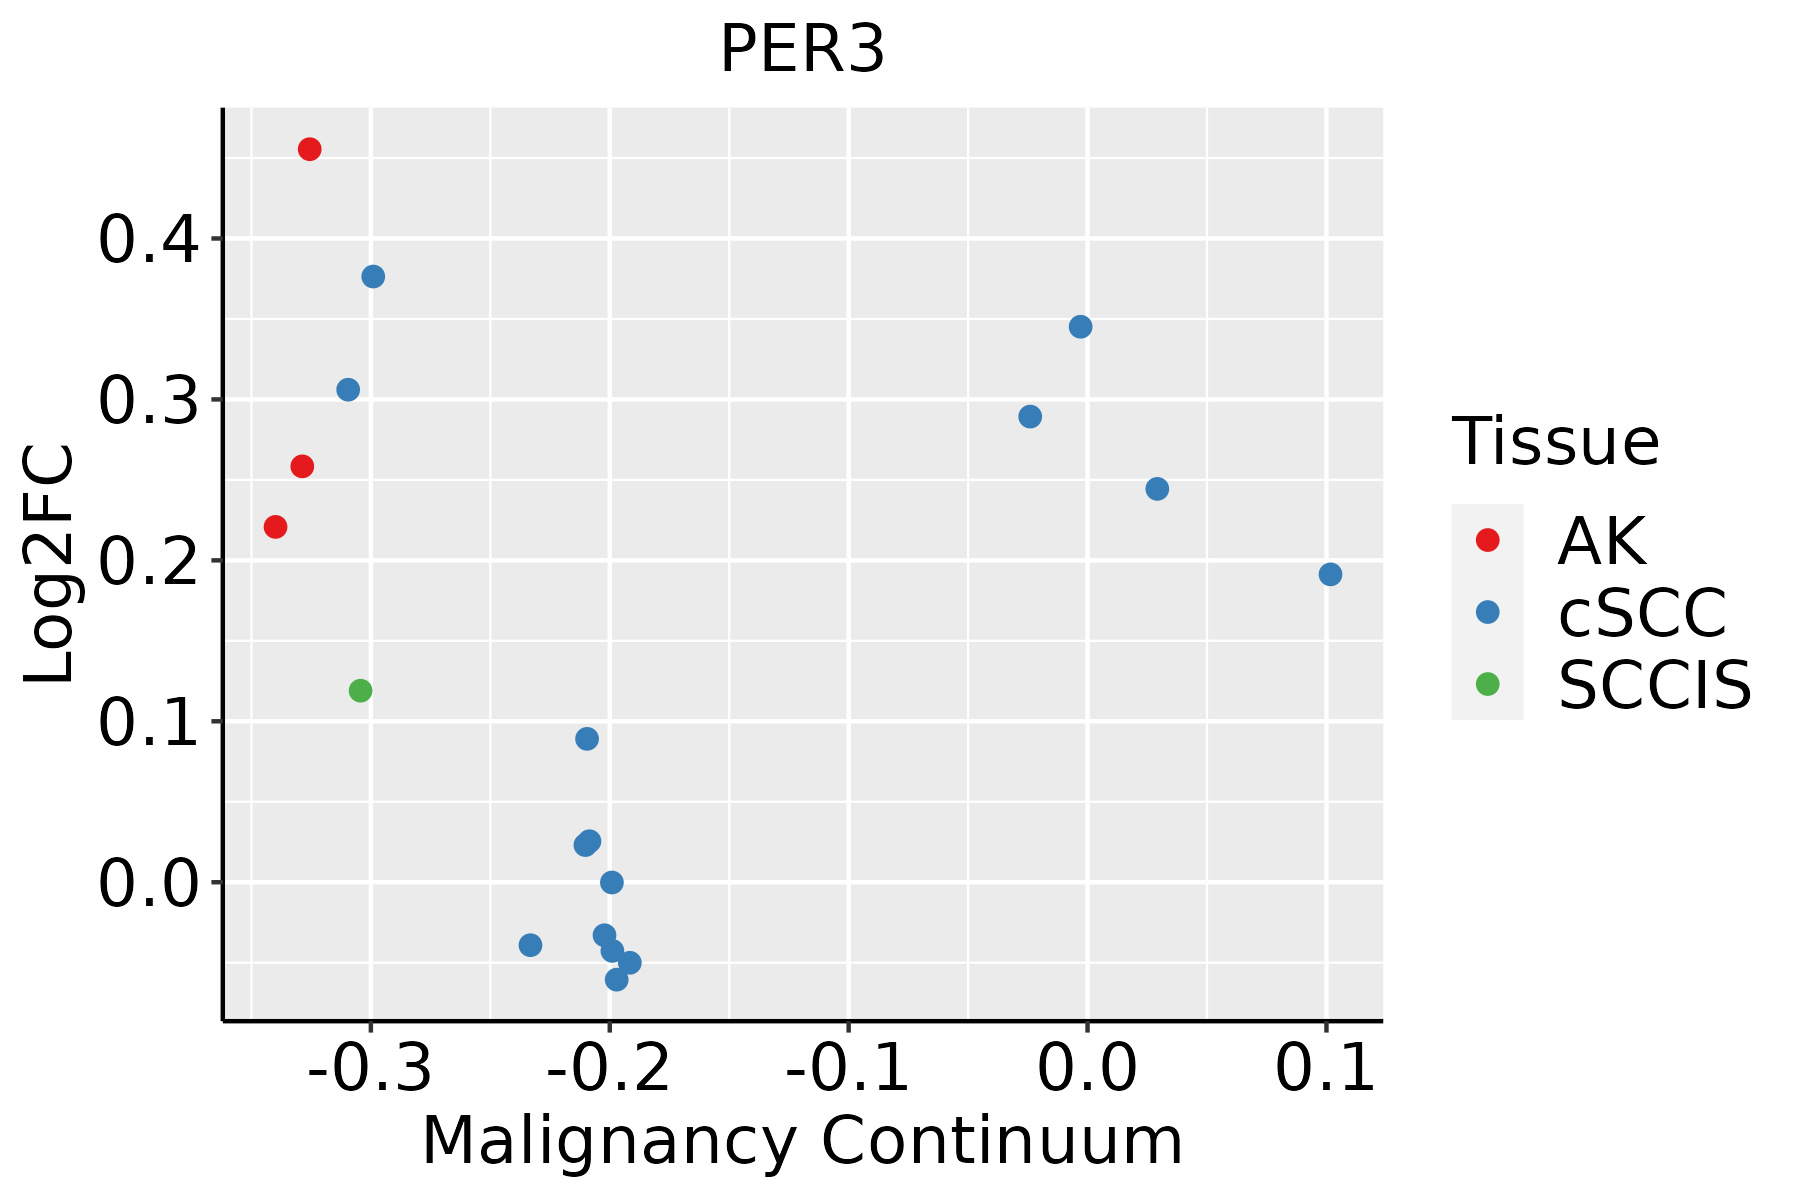 | AK: Actinic keratosis |
| cSCC: Cutaneous squamous cell carcinoma | ||
| SCCIS:squamous cell carcinoma in situ | ||
| Thyroid | 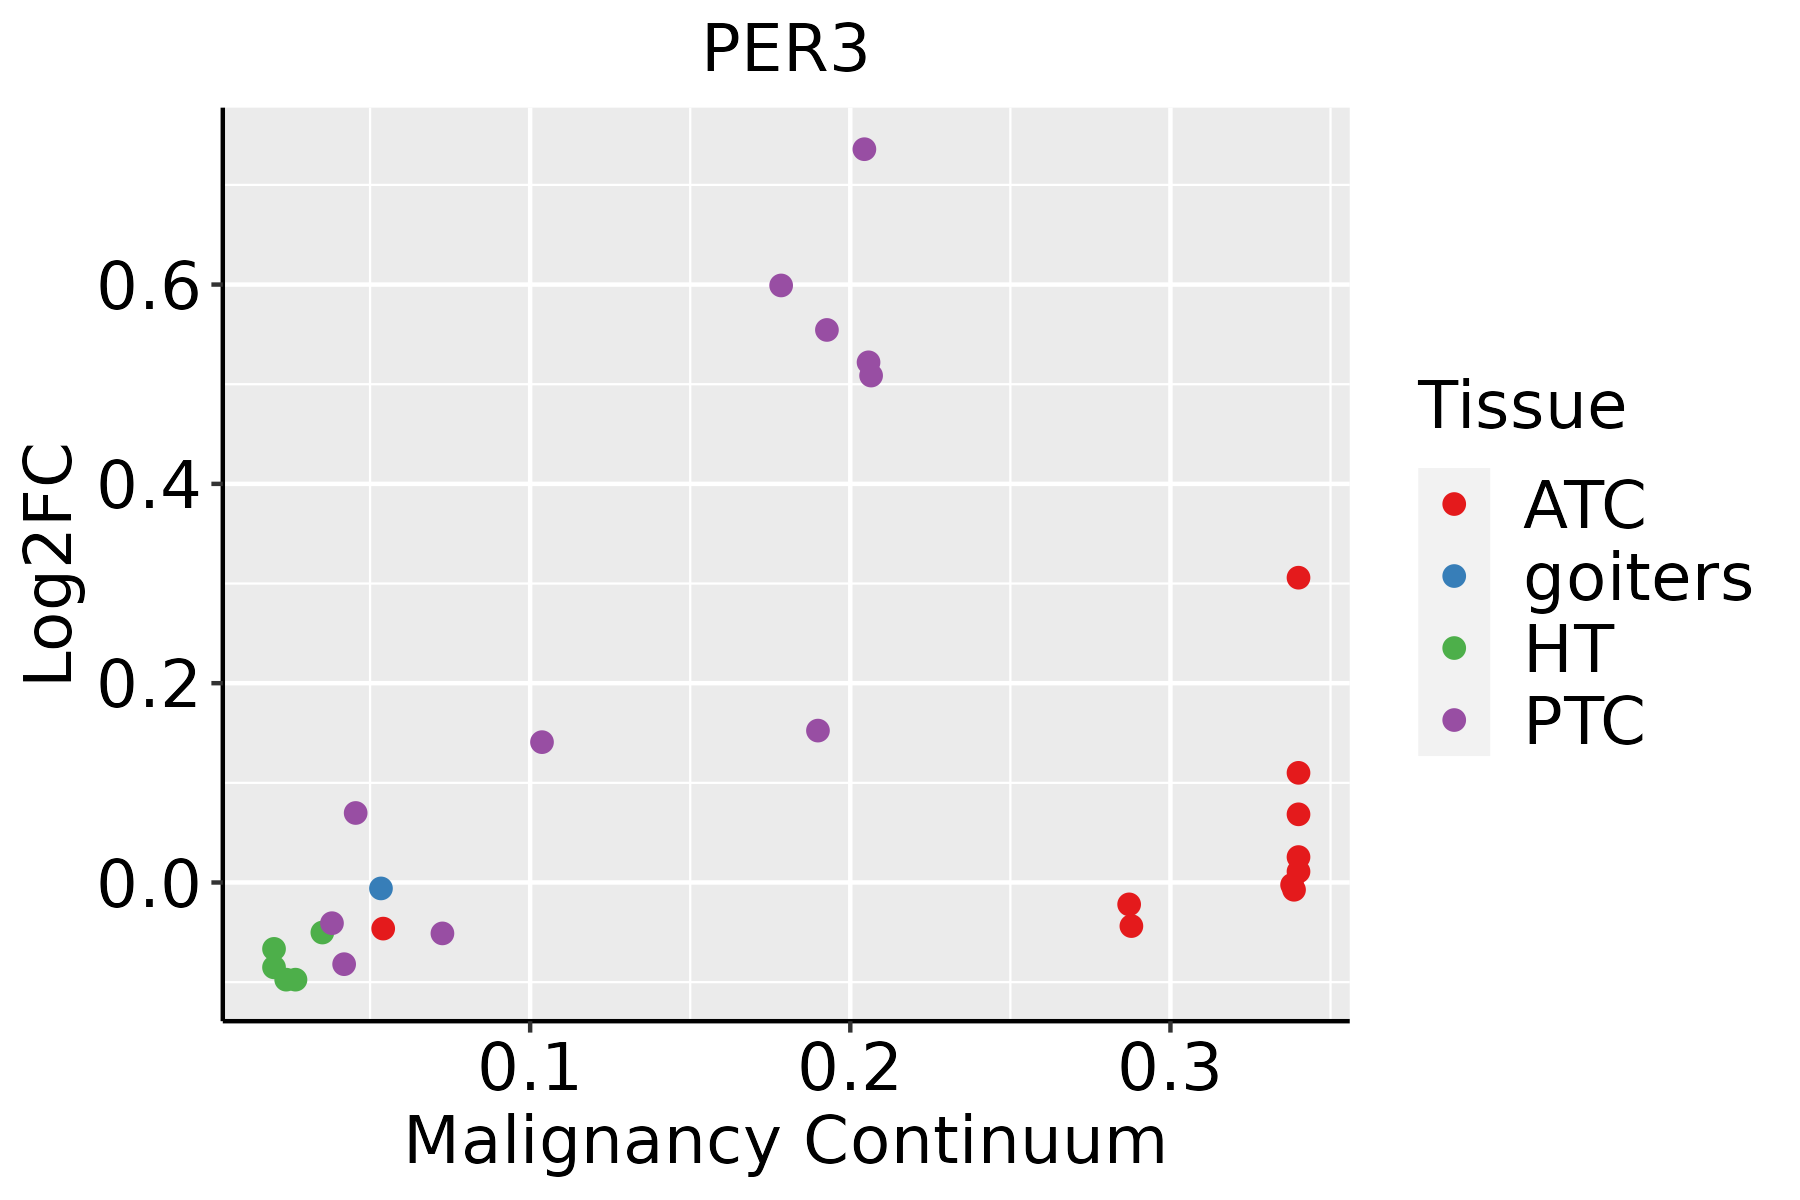 | ATC: Anaplastic thyroid cancer |
| HT: Hashimoto's thyroiditis | ||
| PTC: Papillary thyroid cancer |
| ∗log2FC in expression of this searched gene in stem-like cells from each diseased tissue sample relative to stem-like cells in normal samples in each tissue plotted against the malignancy continuum. Samples are colored based on if they are from different disease stage. |
Top |
Malignant transformation related pathway analysis |
| Find out the enriched GO biological processes and KEGG pathways involved in transition from healthy to precancer to cancer |
| Tissue | Disease Stage | Enriched GO biological Processes |
| Colorectum | AD |  |
| Colorectum | SER |  |
| Colorectum | MSS |  |
| Colorectum | MSI-H |  |
| Colorectum | FAP |  |
| ∗Top 15 enriched GO BP terms are showed in the bar plot of each disease state in each tissue. Each row represents a significant GO biological process which is colored according to the -log10(p.adjust). |
| Page: 1 2 3 4 5 6 7 8 9 |
| GO ID | Tissue | Disease Stage | Description | Gene Ratio | Bg Ratio | pvalue | p.adjust | Count |
| GO:00485118 | Cervix | CC | rhythmic process | 65/2311 | 298/18723 | 2.79e-06 | 8.04e-05 | 65 |
| GO:003164710 | Cervix | CC | regulation of protein stability | 63/2311 | 298/18723 | 1.14e-05 | 2.45e-04 | 63 |
| GO:00093149 | Cervix | CC | response to radiation | 86/2311 | 456/18723 | 3.50e-05 | 5.63e-04 | 86 |
| GO:005082110 | Cervix | CC | protein stabilization | 43/2311 | 191/18723 | 5.90e-05 | 8.54e-04 | 43 |
| GO:00076238 | Cervix | CC | circadian rhythm | 46/2311 | 210/18723 | 6.76e-05 | 9.60e-04 | 46 |
| GO:00329226 | Cervix | CC | circadian regulation of gene expression | 18/2311 | 68/18723 | 1.18e-03 | 9.56e-03 | 18 |
| GO:00094163 | Cervix | CC | response to light stimulus | 54/2311 | 320/18723 | 1.03e-02 | 4.97e-02 | 54 |
| GO:003164727 | Esophagus | HGIN | regulation of protein stability | 96/2587 | 298/18723 | 2.21e-16 | 5.76e-14 | 96 |
| GO:005082127 | Esophagus | HGIN | protein stabilization | 64/2587 | 191/18723 | 3.11e-12 | 4.24e-10 | 64 |
| GO:000931418 | Esophagus | HGIN | response to radiation | 88/2587 | 456/18723 | 6.26e-04 | 8.65e-03 | 88 |
| GO:003292210 | Esophagus | HGIN | circadian regulation of gene expression | 20/2587 | 68/18723 | 6.35e-04 | 8.73e-03 | 20 |
| GO:000762318 | Esophagus | HGIN | circadian rhythm | 45/2587 | 210/18723 | 1.60e-03 | 1.79e-02 | 45 |
| GO:00094165 | Esophagus | HGIN | response to light stimulus | 61/2587 | 320/18723 | 5.20e-03 | 4.30e-02 | 61 |
| GO:0031647111 | Esophagus | ESCC | regulation of protein stability | 223/8552 | 298/18723 | 5.76e-25 | 1.52e-22 | 223 |
| GO:0050821111 | Esophagus | ESCC | protein stabilization | 140/8552 | 191/18723 | 6.50e-15 | 3.61e-13 | 140 |
| GO:000931419 | Esophagus | ESCC | response to radiation | 277/8552 | 456/18723 | 4.42e-11 | 1.43e-09 | 277 |
| GO:000941611 | Esophagus | ESCC | response to light stimulus | 183/8552 | 320/18723 | 2.03e-05 | 1.76e-04 | 183 |
| GO:003292215 | Esophagus | ESCC | circadian regulation of gene expression | 48/8552 | 68/18723 | 2.76e-05 | 2.30e-04 | 48 |
| GO:004851118 | Esophagus | ESCC | rhythmic process | 164/8552 | 298/18723 | 6.80e-04 | 3.57e-03 | 164 |
| GO:000762319 | Esophagus | ESCC | circadian rhythm | 119/8552 | 210/18723 | 8.47e-04 | 4.36e-03 | 119 |
| Page: 1 2 3 4 |
| Pathway ID | Tissue | Disease Stage | Description | Gene Ratio | Bg Ratio | pvalue | p.adjust | qvalue | Count |
| hsa047105 | Esophagus | ESCC | Circadian rhythm | 24/4205 | 34/8465 | 1.09e-02 | 2.51e-02 | 1.29e-02 | 24 |
| hsa0471012 | Esophagus | ESCC | Circadian rhythm | 24/4205 | 34/8465 | 1.09e-02 | 2.51e-02 | 1.29e-02 | 24 |
| hsa047102 | Lung | AIS | Circadian rhythm | 11/961 | 34/8465 | 9.22e-04 | 7.11e-03 | 4.55e-03 | 11 |
| hsa047103 | Lung | AIS | Circadian rhythm | 11/961 | 34/8465 | 9.22e-04 | 7.11e-03 | 4.55e-03 | 11 |
| Page: 1 |
Top |
Cell-cell communication analysis |
| Identification of potential cell-cell interactions between two cell types and their ligand-receptor pairs for different disease states |
| Ligand | Receptor | LRpair | Pathway | Tissue | Disease Stage |
| Page: 1 |
Top |
Single-cell gene regulatory network inference analysis |
| Find out the significant the regulons (TFs) and the target genes of each regulon across cell types for different disease states |
| TF | Cell Type | Tissue | Disease Stage | Target Gene | RSS | Regulon Activity |
| ∗The dot plots of a searched regulon are shown for all cell subpopulations in each disease state of each tissue based on the regulon specific score inferred using pySCENIC and by calculating the average expression. |
| Page: 1 |
Top |
Somatic mutation of malignant transformation related genes |
| Annotation of somatic variants for genes involved in malignant transformation |
| Hugo Symbol | Variant Class | Variant Classification | dbSNP RS | HGVSc | HGVSp | HGVSp Short | SWISSPROT | BIOTYPE | SIFT | PolyPhen | Tumor Sample Barcode | Tissue | Histology | Sex | Age | Stage | Therapy Types | Drugs | Outcome |
| PER3 | SNV | Missense_Mutation | c.2108N>A | p.Arg703Gln | p.R703Q | P56645 | protein_coding | deleterious(0.03) | probably_damaging(0.916) | TCGA-A1-A0SI-01 | Breast | breast invasive carcinoma | Female | <65 | I/II | Unknown | Unknown | SD | |
| PER3 | SNV | Missense_Mutation | c.1811A>C | p.Lys604Thr | p.K604T | P56645 | protein_coding | tolerated(0.49) | benign(0.32) | TCGA-A2-A1G1-01 | Breast | breast invasive carcinoma | Female | >=65 | I/II | Unknown | Unknown | SD | |
| PER3 | SNV | Missense_Mutation | c.1234C>T | p.Leu412Phe | p.L412F | P56645 | protein_coding | tolerated(0.19) | benign(0.219) | TCGA-AN-A046-01 | Breast | breast invasive carcinoma | Female | >=65 | I/II | Unknown | Unknown | SD | |
| PER3 | SNV | Missense_Mutation | rs139934930 | c.2282C>T | p.Ser761Leu | p.S761L | P56645 | protein_coding | tolerated(0.07) | possibly_damaging(0.562) | TCGA-AN-A046-01 | Breast | breast invasive carcinoma | Female | >=65 | I/II | Unknown | Unknown | SD |
| PER3 | SNV | Missense_Mutation | novel | c.2803T>G | p.Leu935Val | p.L935V | P56645 | protein_coding | deleterious(0.03) | probably_damaging(0.996) | TCGA-AN-A046-01 | Breast | breast invasive carcinoma | Female | >=65 | I/II | Unknown | Unknown | SD |
| PER3 | SNV | Missense_Mutation | c.758N>A | p.Leu253His | p.L253H | P56645 | protein_coding | deleterious(0) | probably_damaging(0.999) | TCGA-AN-A0FW-01 | Breast | breast invasive carcinoma | Female | >=65 | III/IV | Unknown | Unknown | SD | |
| PER3 | SNV | Missense_Mutation | rs777226760 | c.1511N>T | p.Ala504Val | p.A504V | P56645 | protein_coding | tolerated(0.48) | possibly_damaging(0.652) | TCGA-AO-A128-01 | Breast | breast invasive carcinoma | Female | <65 | I/II | Chemotherapy | doxorubicin | SD |
| PER3 | SNV | Missense_Mutation | c.2405N>G | p.Gln802Arg | p.Q802R | P56645 | protein_coding | tolerated(0.18) | benign(0.055) | TCGA-GM-A2D9-01 | Breast | breast invasive carcinoma | Female | >=65 | I/II | Hormone Therapy | arimidex | SD | |
| PER3 | insertion | Nonsense_Mutation | novel | c.961_962insGAGTCCTCTAAGGAACTTGCTAAAAGACAGATGCCTGGTCTTA | p.Val321GlyfsTer4 | p.V321Gfs*4 | P56645 | protein_coding | TCGA-A8-A0A6-01 | Breast | breast invasive carcinoma | Female | <65 | III/IV | Chemotherapy | epirubicin | CR | ||
| PER3 | insertion | Nonsense_Mutation | novel | c.2863_2864insCTCAATGTCGTCAGCAATGAGTCCAACTCTGGACCCACCCCCTTC | p.Asn955delinsThrGlnCysArgGlnGlnTerValGlnLeuTrpThrHisProLeuHis | p.N955delinsTQCRQQ*VQLWTHPLH | P56645 | protein_coding | TCGA-BH-A0HY-01 | Breast | breast invasive carcinoma | Female | <65 | I/II | Hormone Therapy | taxotere | CR |
| Page: 1 2 3 4 5 6 7 8 9 10 11 12 |
Top |
Related drugs of malignant transformation related genes |
| Identification of chemicals and drugs interact with genes involved in malignant transfromation |
| (DGIdb 4.0) |
| Entrez ID | Symbol | Category | Interaction Types | Drug Claim Name | Drug Name | PMIDs |
| Page: 1 |

Copyright 2023-Present -The University of Texas Health Science Center at Houston |