| Tissue | Expression Dynamics | Abbreviation |
| Breast | 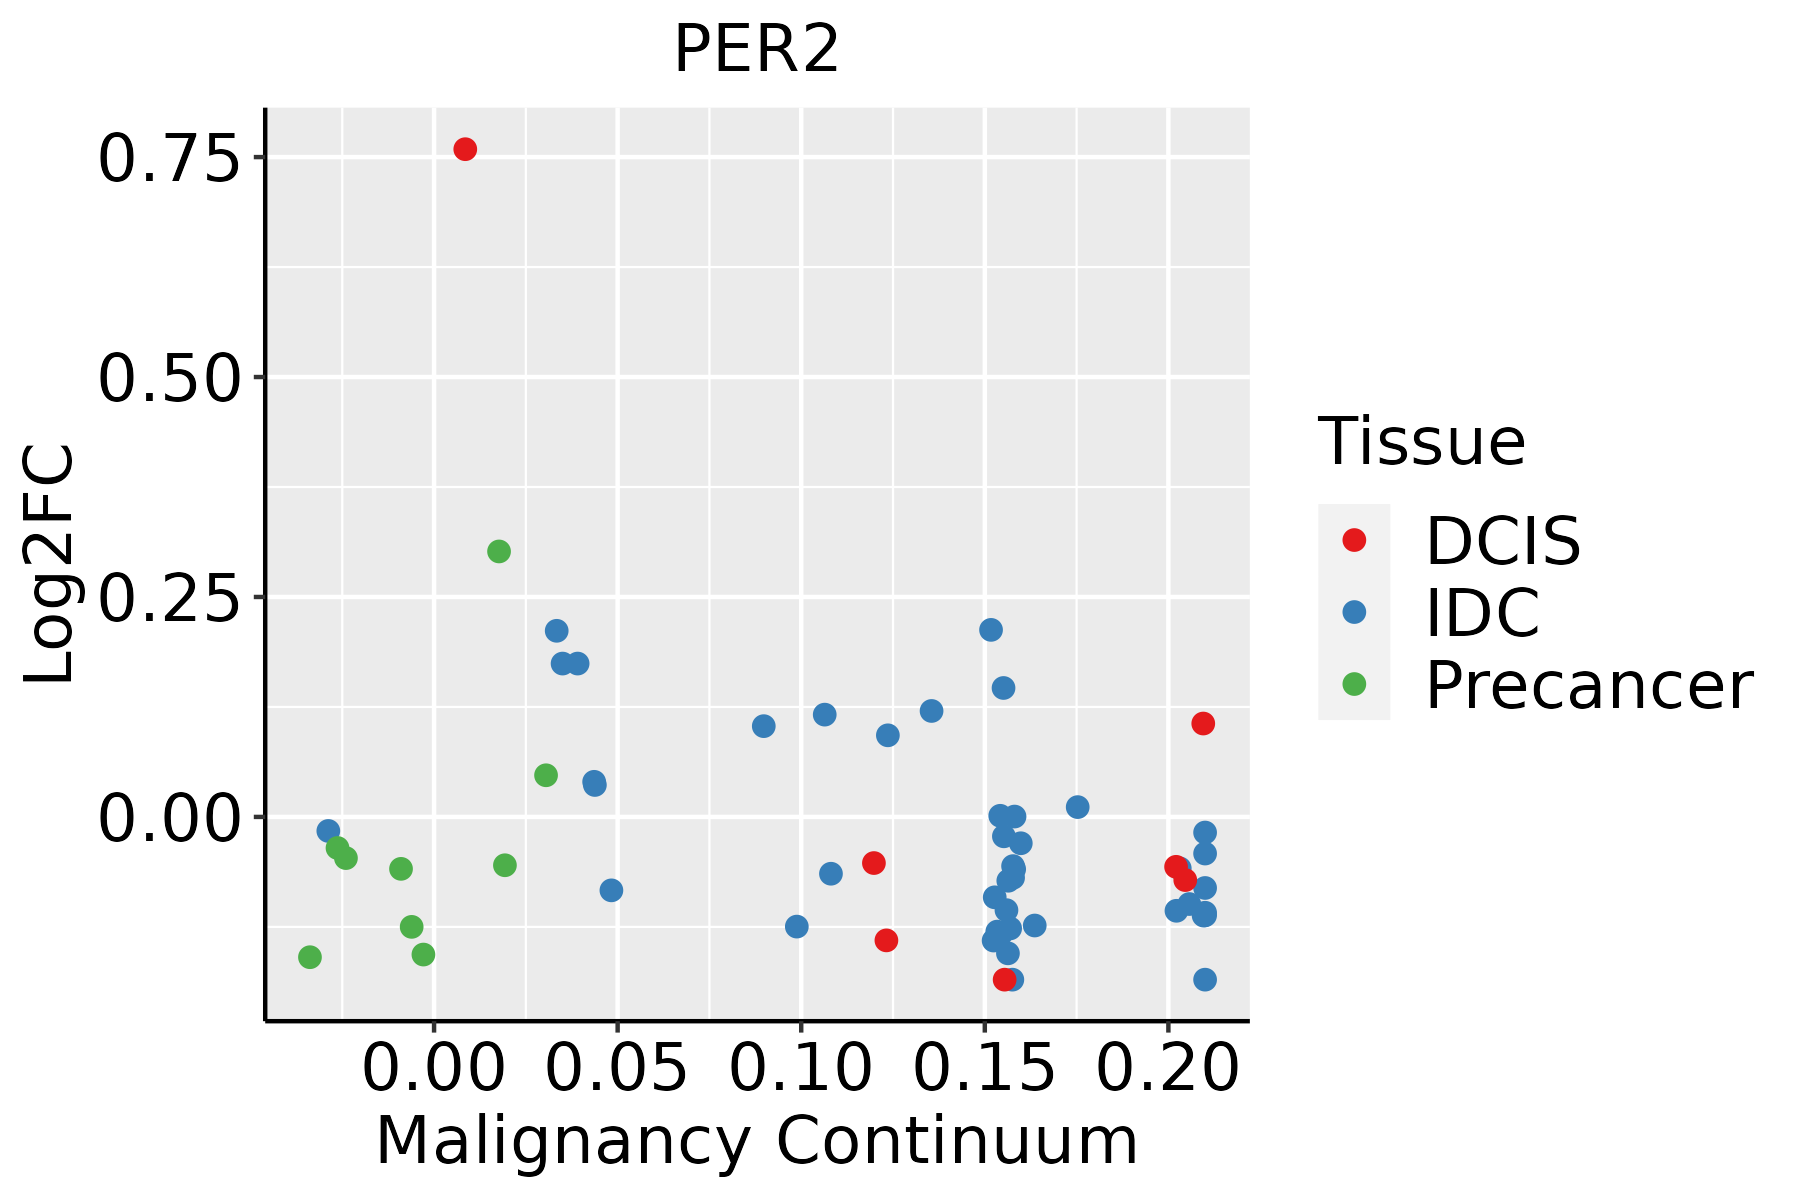 | IDC: Invasive ductal carcinoma |
| DCIS: Ductal carcinoma in situ |
| Precancer(BRCA1-mut): Precancerous lesion from BRCA1 mutation carriers |
| Esophagus | 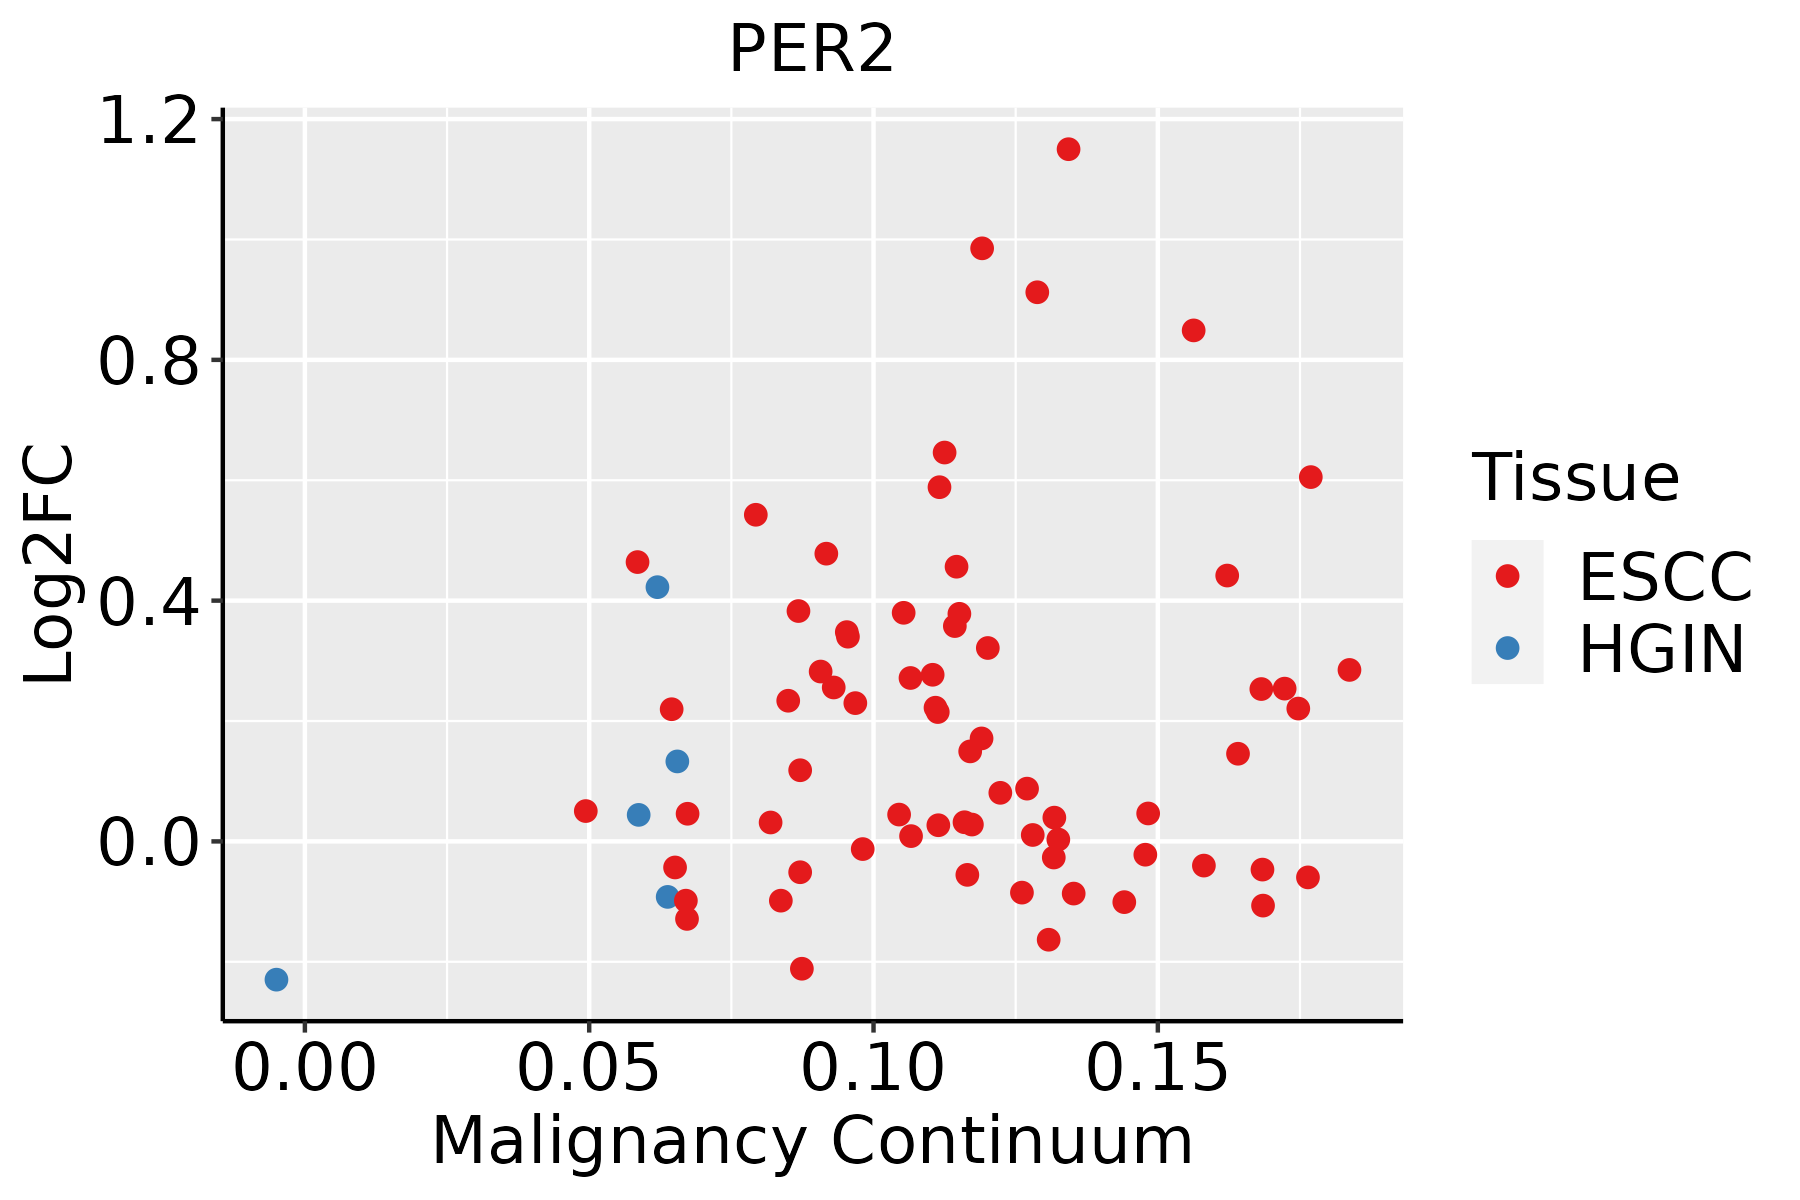 | ESCC: Esophageal squamous cell carcinoma |
| HGIN: High-grade intraepithelial neoplasias |
| LGIN: Low-grade intraepithelial neoplasias |
| Lung | 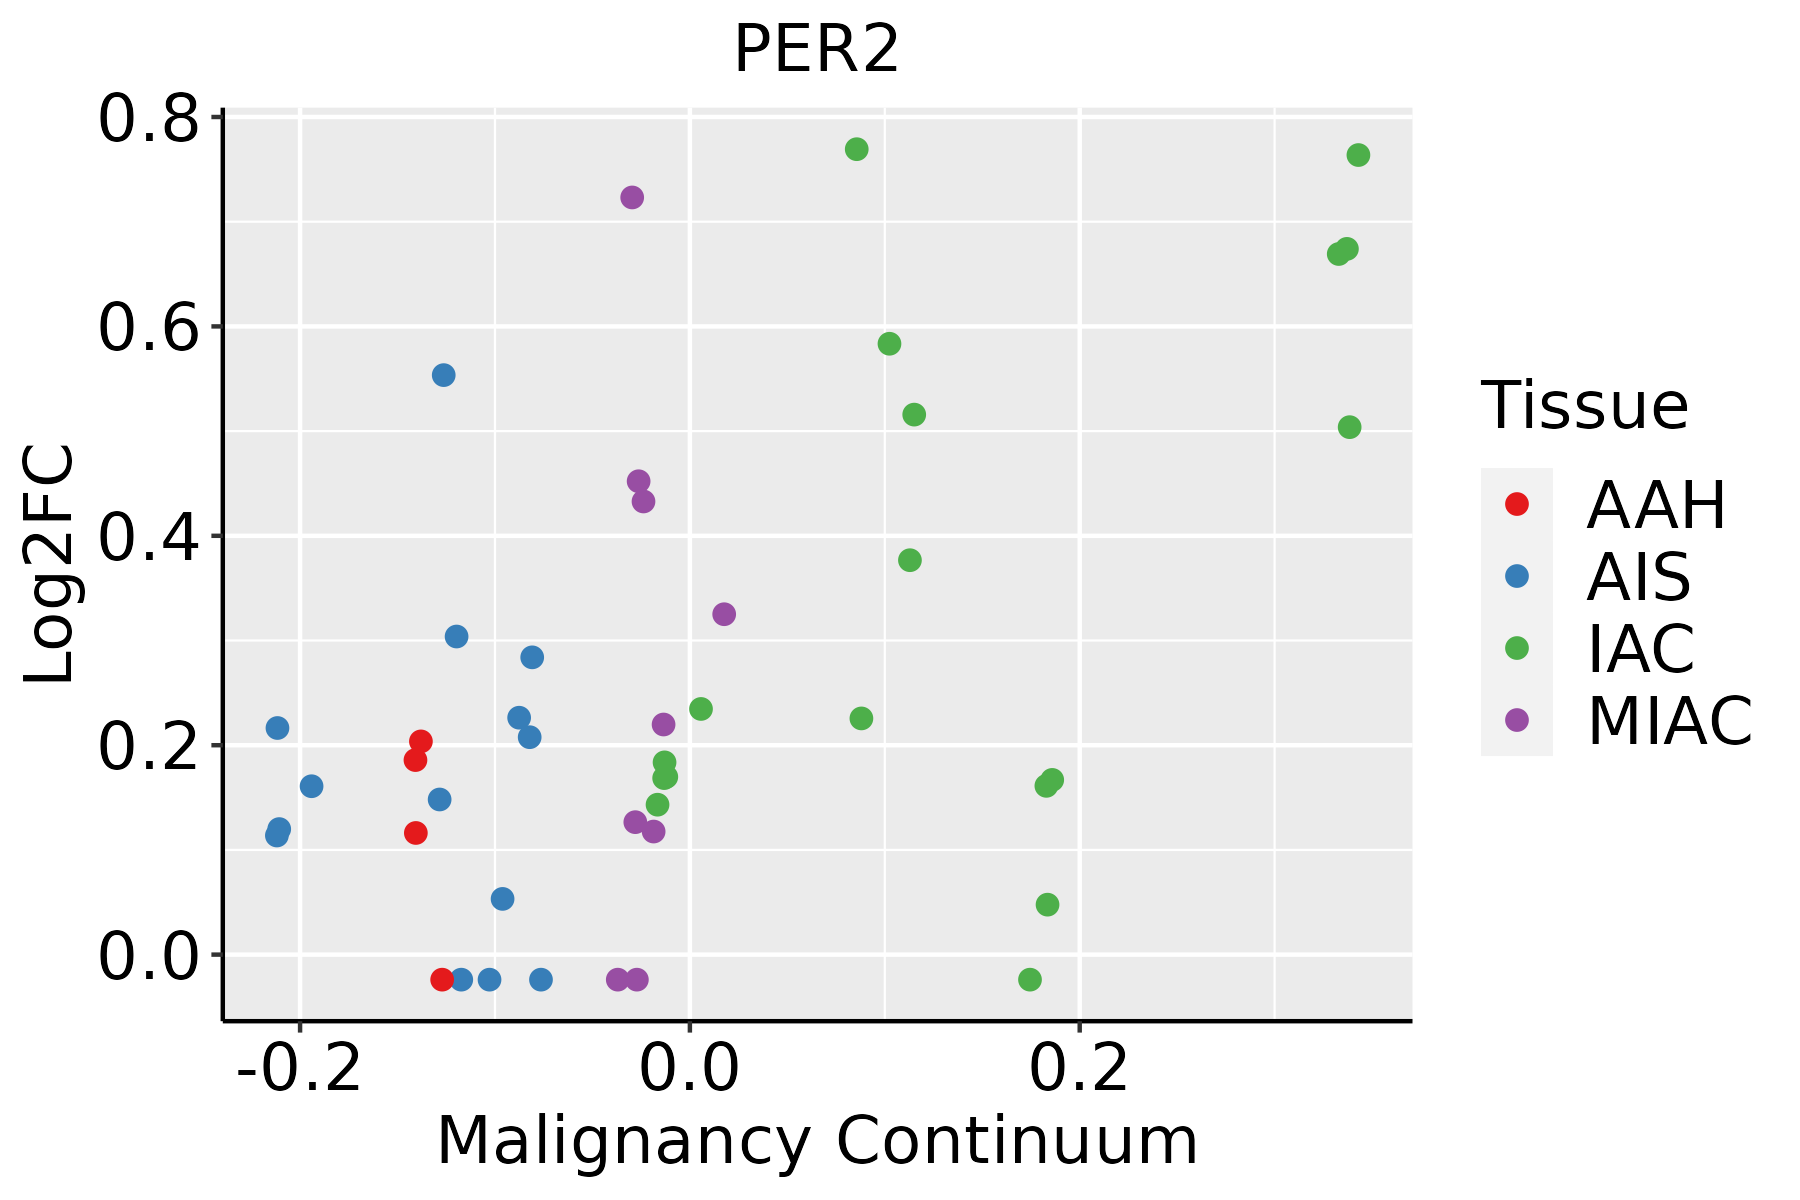 | AAH: Atypical adenomatous hyperplasia |
| AIS: Adenocarcinoma in situ |
| IAC: Invasive lung adenocarcinoma |
| MIA: Minimally invasive adenocarcinoma |
| Prostate | 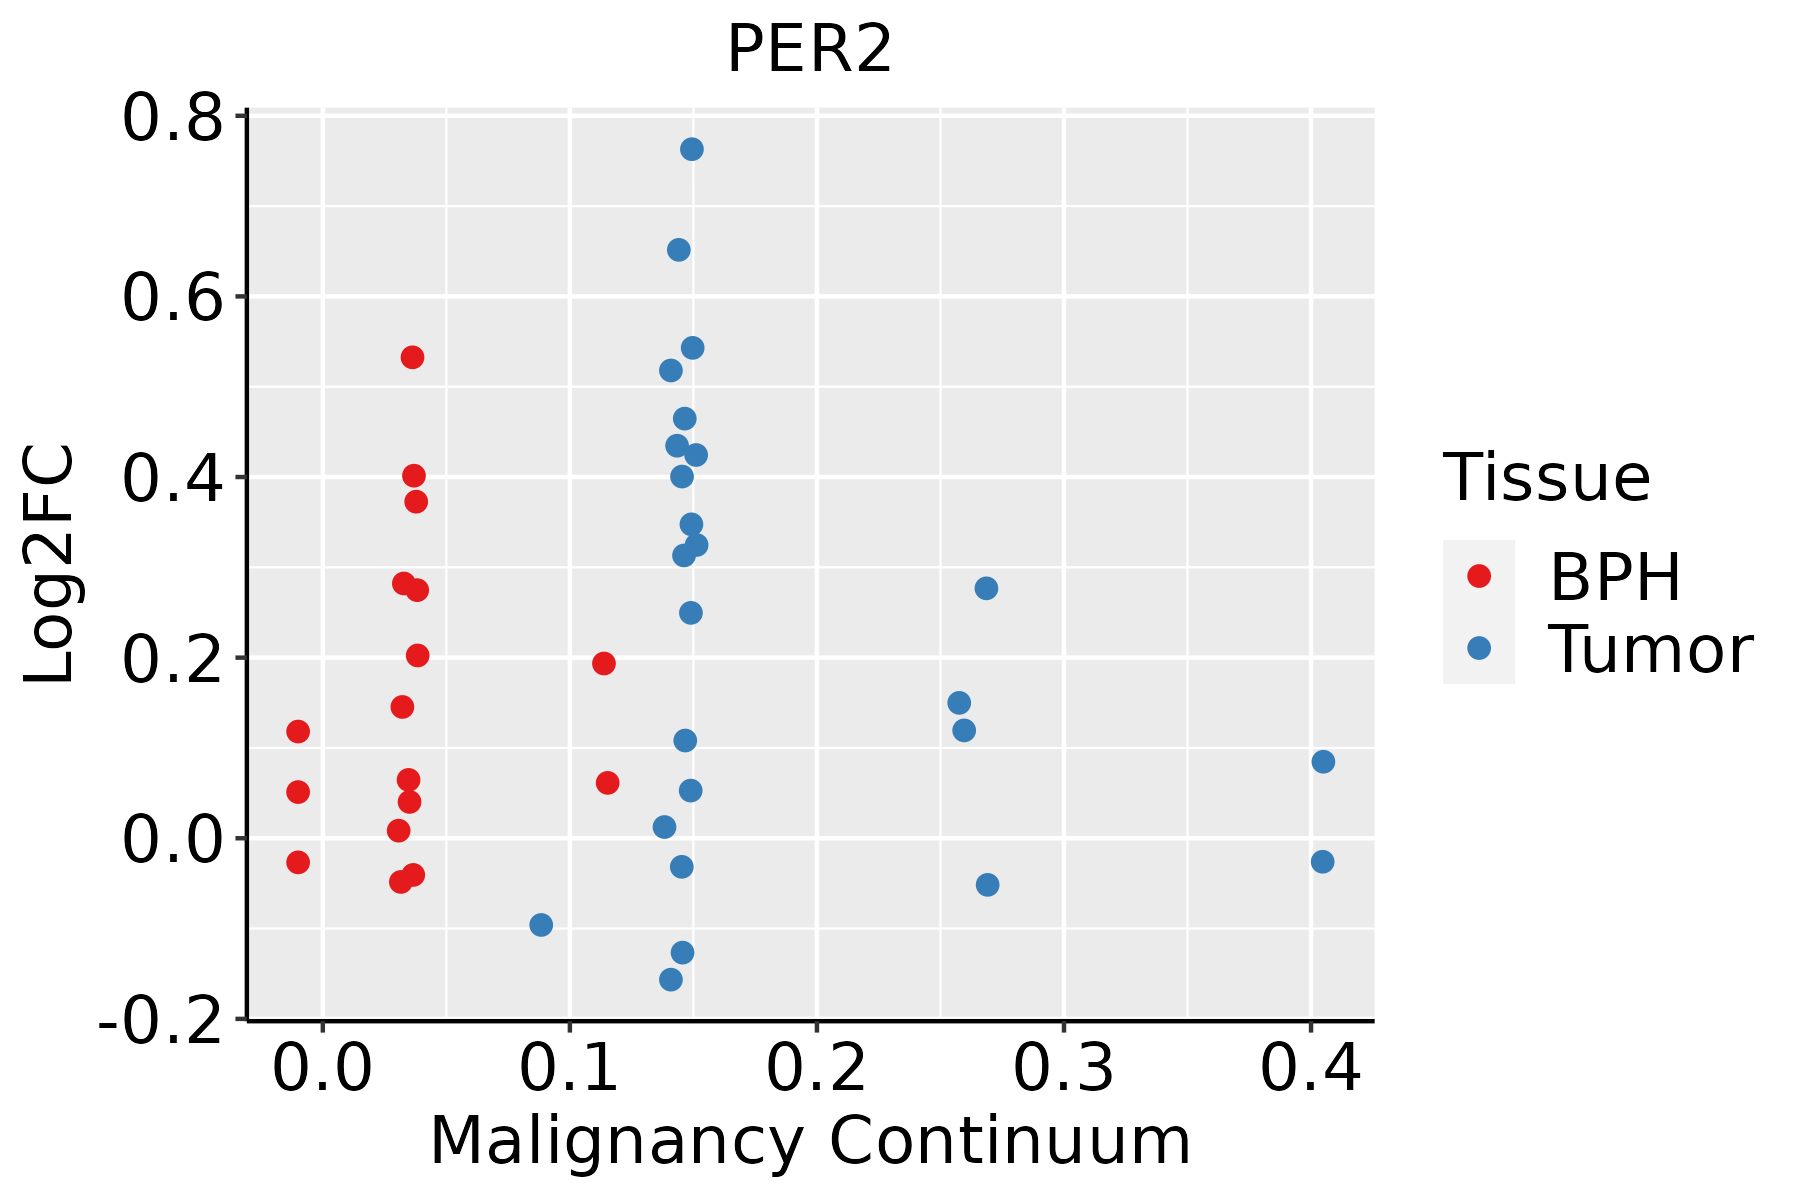 | BPH: Benign Prostatic Hyperplasia |
| Skin |  | AK: Actinic keratosis |
| cSCC: Cutaneous squamous cell carcinoma |
| SCCIS:squamous cell carcinoma in situ |
| Thyroid |  | ATC: Anaplastic thyroid cancer |
| HT: Hashimoto's thyroiditis |
| PTC: Papillary thyroid cancer |
| GO ID | Tissue | Disease Stage | Description | Gene Ratio | Bg Ratio | pvalue | p.adjust | Count |
| GO:00060918 | Breast | Precancer | generation of precursor metabolites and energy | 94/1080 | 490/18723 | 1.54e-25 | 1.64e-22 | 94 |
| GO:00159808 | Breast | Precancer | energy derivation by oxidation of organic compounds | 70/1080 | 318/18723 | 8.33e-23 | 6.37e-20 | 70 |
| GO:00064179 | Breast | Precancer | regulation of translation | 67/1080 | 468/18723 | 4.71e-12 | 7.64e-10 | 67 |
| GO:19033209 | Breast | Precancer | regulation of protein modification by small protein conjugation or removal | 38/1080 | 242/18723 | 1.71e-08 | 1.17e-06 | 38 |
| GO:19033219 | Breast | Precancer | negative regulation of protein modification by small protein conjugation or removal | 21/1080 | 95/18723 | 8.09e-08 | 4.61e-06 | 21 |
| GO:00313969 | Breast | Precancer | regulation of protein ubiquitination | 33/1080 | 210/18723 | 1.45e-07 | 7.82e-06 | 33 |
| GO:00313979 | Breast | Precancer | negative regulation of protein ubiquitination | 19/1080 | 83/18723 | 1.85e-07 | 9.54e-06 | 19 |
| GO:00511019 | Breast | Precancer | regulation of DNA binding | 22/1080 | 118/18723 | 9.28e-07 | 3.71e-05 | 22 |
| GO:00510989 | Breast | Precancer | regulation of binding | 44/1080 | 363/18723 | 2.59e-06 | 8.65e-05 | 44 |
| GO:00093148 | Breast | Precancer | response to radiation | 47/1080 | 456/18723 | 8.39e-05 | 1.62e-03 | 47 |
| GO:0002931 | Breast | Precancer | response to ischemia | 12/1080 | 58/18723 | 9.65e-05 | 1.80e-03 | 12 |
| GO:00454444 | Breast | Precancer | fat cell differentiation | 26/1080 | 229/18723 | 7.60e-04 | 9.04e-03 | 26 |
| GO:00060066 | Breast | Precancer | glucose metabolic process | 23/1080 | 196/18723 | 9.54e-04 | 1.07e-02 | 23 |
| GO:00463946 | Breast | Precancer | carboxylic acid biosynthetic process | 32/1080 | 314/18723 | 1.30e-03 | 1.38e-02 | 32 |
| GO:00723304 | Breast | Precancer | monocarboxylic acid biosynthetic process | 24/1080 | 214/18723 | 1.41e-03 | 1.48e-02 | 24 |
| GO:00160536 | Breast | Precancer | organic acid biosynthetic process | 32/1080 | 316/18723 | 1.44e-03 | 1.50e-02 | 32 |
| GO:00507086 | Breast | Precancer | regulation of protein secretion | 28/1080 | 268/18723 | 1.76e-03 | 1.74e-02 | 28 |
| GO:00059966 | Breast | Precancer | monosaccharide metabolic process | 27/1080 | 257/18723 | 1.94e-03 | 1.88e-02 | 27 |
| GO:00511008 | Breast | Precancer | negative regulation of binding | 19/1080 | 162/18723 | 2.56e-03 | 2.32e-02 | 19 |
| GO:00193186 | Breast | Precancer | hexose metabolic process | 25/1080 | 237/18723 | 2.64e-03 | 2.36e-02 | 25 |
| Pathway ID | Tissue | Disease Stage | Description | Gene Ratio | Bg Ratio | pvalue | p.adjust | qvalue | Count |
| hsa052215 | Esophagus | ESCC | Acute myeloid leukemia | 49/4205 | 67/8465 | 7.43e-05 | 3.07e-04 | 1.57e-04 | 49 |
| hsa052028 | Esophagus | ESCC | Transcriptional misregulation in cancer | 116/4205 | 193/8465 | 2.08e-03 | 5.95e-03 | 3.05e-03 | 116 |
| hsa047105 | Esophagus | ESCC | Circadian rhythm | 24/4205 | 34/8465 | 1.09e-02 | 2.51e-02 | 1.29e-02 | 24 |
| hsa0522113 | Esophagus | ESCC | Acute myeloid leukemia | 49/4205 | 67/8465 | 7.43e-05 | 3.07e-04 | 1.57e-04 | 49 |
| hsa0520213 | Esophagus | ESCC | Transcriptional misregulation in cancer | 116/4205 | 193/8465 | 2.08e-03 | 5.95e-03 | 3.05e-03 | 116 |
| hsa0471012 | Esophagus | ESCC | Circadian rhythm | 24/4205 | 34/8465 | 1.09e-02 | 2.51e-02 | 1.29e-02 | 24 |
| hsa052026 | Lung | IAC | Transcriptional misregulation in cancer | 40/1053 | 193/8465 | 6.90e-04 | 5.90e-03 | 3.92e-03 | 40 |
| hsa04710 | Lung | IAC | Circadian rhythm | 10/1053 | 34/8465 | 6.70e-03 | 2.76e-02 | 1.83e-02 | 10 |
| hsa0520211 | Lung | IAC | Transcriptional misregulation in cancer | 40/1053 | 193/8465 | 6.90e-04 | 5.90e-03 | 3.92e-03 | 40 |
| hsa047101 | Lung | IAC | Circadian rhythm | 10/1053 | 34/8465 | 6.70e-03 | 2.76e-02 | 1.83e-02 | 10 |
| hsa052022 | Lung | AIS | Transcriptional misregulation in cancer | 39/961 | 193/8465 | 2.15e-04 | 2.41e-03 | 1.54e-03 | 39 |
| hsa047102 | Lung | AIS | Circadian rhythm | 11/961 | 34/8465 | 9.22e-04 | 7.11e-03 | 4.55e-03 | 11 |
| hsa052023 | Lung | AIS | Transcriptional misregulation in cancer | 39/961 | 193/8465 | 2.15e-04 | 2.41e-03 | 1.54e-03 | 39 |
| hsa047103 | Lung | AIS | Circadian rhythm | 11/961 | 34/8465 | 9.22e-04 | 7.11e-03 | 4.55e-03 | 11 |
| hsa052024 | Lung | MIAC | Transcriptional misregulation in cancer | 22/507 | 193/8465 | 2.64e-03 | 2.26e-02 | 1.64e-02 | 22 |
| hsa052212 | Lung | MIAC | Acute myeloid leukemia | 10/507 | 67/8465 | 6.16e-03 | 4.07e-02 | 2.95e-02 | 10 |
| hsa052025 | Lung | MIAC | Transcriptional misregulation in cancer | 22/507 | 193/8465 | 2.64e-03 | 2.26e-02 | 1.64e-02 | 22 |
| hsa0522111 | Lung | MIAC | Acute myeloid leukemia | 10/507 | 67/8465 | 6.16e-03 | 4.07e-02 | 2.95e-02 | 10 |
| hsa047104 | Prostate | BPH | Circadian rhythm | 15/1718 | 34/8465 | 1.40e-03 | 5.85e-03 | 3.62e-03 | 15 |
| hsa052027 | Prostate | BPH | Transcriptional misregulation in cancer | 53/1718 | 193/8465 | 9.56e-03 | 2.92e-02 | 1.81e-02 | 53 |
| Hugo Symbol | Variant Class | Variant Classification | dbSNP RS | HGVSc | HGVSp | HGVSp Short | SWISSPROT | BIOTYPE | SIFT | PolyPhen | Tumor Sample Barcode | Tissue | Histology | Sex | Age | Stage | Therapy Types | Drugs | Outcome |
| PER2 | SNV | Missense_Mutation | novel | c.208G>A | p.Glu70Lys | p.E70K | O15055 | protein_coding | tolerated(0.31) | possibly_damaging(0.601) | TCGA-5L-AAT1-01 | Breast | breast invasive carcinoma | Female | <65 | III/IV | Hormone Therapy | letrozol | SD |
| PER2 | SNV | Missense_Mutation | novel | c.913G>A | p.Glu305Lys | p.E305K | O15055 | protein_coding | deleterious(0.04) | benign(0.009) | TCGA-A1-A0SI-01 | Breast | breast invasive carcinoma | Female | <65 | I/II | Unknown | Unknown | SD |
| PER2 | SNV | Missense_Mutation | | c.505N>C | p.Asp169His | p.D169H | O15055 | protein_coding | deleterious(0.05) | benign(0.062) | TCGA-A2-A0YK-01 | Breast | breast invasive carcinoma | Female | <65 | I/II | Chemotherapy | cytoxan | SD |
| PER2 | SNV | Missense_Mutation | novel | c.1843G>T | p.Ala615Ser | p.A615S | O15055 | protein_coding | tolerated(1) | benign(0) | TCGA-A7-A0CJ-01 | Breast | breast invasive carcinoma | Female | <65 | I/II | Chemotherapy | cytoxan | SD |
| PER2 | SNV | Missense_Mutation | | c.1102N>A | p.Val368Met | p.V368M | O15055 | protein_coding | tolerated(0.09) | benign(0.233) | TCGA-AO-A128-01 | Breast | breast invasive carcinoma | Female | <65 | I/II | Chemotherapy | doxorubicin | SD |
| PER2 | SNV | Missense_Mutation | | c.1258N>T | p.Pro420Ser | p.P420S | O15055 | protein_coding | deleterious(0) | probably_damaging(1) | TCGA-BH-A0HF-01 | Breast | breast invasive carcinoma | Female | >=65 | I/II | Hormone Therapy | arimidex | SD |
| PER2 | SNV | Missense_Mutation | | c.697N>T | p.Pro233Ser | p.P233S | O15055 | protein_coding | deleterious(0.02) | probably_damaging(1) | TCGA-BH-A0HF-01 | Breast | breast invasive carcinoma | Female | >=65 | I/II | Hormone Therapy | arimidex | SD |
| PER2 | SNV | Missense_Mutation | rs748039327 | c.3670N>A | p.Glu1224Lys | p.E1224K | O15055 | protein_coding | deleterious(0.01) | possibly_damaging(0.689) | TCGA-D8-A1J8-01 | Breast | breast invasive carcinoma | Female | >=65 | I/II | Hormone Therapy | nolvadex | SD |
| PER2 | insertion | Frame_Shift_Ins | novel | c.1841_1842insTCCTATGAATAAACATTGGGGACAA | p.Ala615ProfsTer14 | p.A615Pfs*14 | O15055 | protein_coding | | | TCGA-A7-A0CJ-01 | Breast | breast invasive carcinoma | Female | <65 | I/II | Chemotherapy | cytoxan | SD |
| PER2 | insertion | In_Frame_Ins | novel | c.3477_3478insCTTATCAGGCCCCAGCTGGTGGGTTGGCAGATTGTCTGGGTT | p.Glu1159_Ala1160insLeuIleArgProGlnLeuValGlyTrpGlnIleValTrpVal | p.E1159_A1160insLIRPQLVGWQIVWV | O15055 | protein_coding | | | TCGA-AN-A04C-01 | Breast | breast invasive carcinoma | Female | <65 | I/II | Unknown | Unknown | SD |


