
|
|||||
|
 | |
| |
| |
| |
| |
| |
|
Gene: PEPD |
Gene summary for PEPD |
| Gene information | Species | Human | Gene symbol | PEPD | Gene ID | 5184 |
| Gene name | peptidase D | |
| Gene Alias | PROLIDASE | |
| Cytomap | 19q13.11 | |
| Gene Type | protein-coding | GO ID | GO:0006082 | UniProtAcc | A0A140VJR2 |
Top |
Malignant transformation analysis |
| Identification of the aberrant gene expression in precancerous and cancerous lesions by comparing the gene expression of stem-like cells in diseased tissues with normal stem cells |
| Entrez ID | Symbol | Replicates | Species | Organ | Tissue | Adj P-value | Log2FC | Malignancy |
| 5184 | PEPD | HTA11_2487_2000001011 | Human | Colorectum | SER | 1.87e-07 | 4.34e-01 | -0.1808 |
| 5184 | PEPD | HTA11_1391_2000001011 | Human | Colorectum | AD | 2.39e-07 | 3.84e-01 | -0.059 |
| 5184 | PEPD | HTA11_866_3004761011 | Human | Colorectum | AD | 1.74e-08 | 3.16e-01 | 0.096 |
| 5184 | PEPD | HTA11_7696_3000711011 | Human | Colorectum | AD | 4.23e-08 | 3.02e-01 | 0.0674 |
| 5184 | PEPD | HTA11_6818_2000001021 | Human | Colorectum | AD | 1.62e-02 | 1.66e-01 | 0.0588 |
| 5184 | PEPD | HTA11_99999965104_69814 | Human | Colorectum | MSS | 5.24e-03 | 2.70e-01 | 0.281 |
| 5184 | PEPD | HTA11_99999974143_84620 | Human | Colorectum | MSS | 1.14e-04 | 2.96e-01 | 0.3005 |
| 5184 | PEPD | A002-C-016 | Human | Colorectum | FAP | 3.61e-02 | -6.26e-02 | 0.0521 |
| 5184 | PEPD | LZE4T | Human | Esophagus | ESCC | 6.22e-12 | 4.91e-01 | 0.0811 |
| 5184 | PEPD | LZE5T | Human | Esophagus | ESCC | 2.49e-02 | 4.20e-01 | 0.0514 |
| 5184 | PEPD | LZE7T | Human | Esophagus | ESCC | 1.12e-06 | 5.76e-01 | 0.0667 |
| 5184 | PEPD | LZE8T | Human | Esophagus | ESCC | 1.05e-03 | 1.84e-01 | 0.067 |
| 5184 | PEPD | LZE22T | Human | Esophagus | ESCC | 2.03e-08 | 7.85e-01 | 0.068 |
| 5184 | PEPD | LZE24T | Human | Esophagus | ESCC | 1.79e-26 | 8.15e-01 | 0.0596 |
| 5184 | PEPD | LZE6T | Human | Esophagus | ESCC | 4.34e-06 | 4.07e-01 | 0.0845 |
| 5184 | PEPD | P1T-E | Human | Esophagus | ESCC | 3.55e-12 | 6.66e-01 | 0.0875 |
| 5184 | PEPD | P2T-E | Human | Esophagus | ESCC | 2.00e-26 | 4.28e-01 | 0.1177 |
| 5184 | PEPD | P4T-E | Human | Esophagus | ESCC | 1.09e-25 | 7.28e-01 | 0.1323 |
| 5184 | PEPD | P5T-E | Human | Esophagus | ESCC | 2.13e-10 | 2.80e-01 | 0.1327 |
| 5184 | PEPD | P8T-E | Human | Esophagus | ESCC | 3.91e-43 | 8.31e-01 | 0.0889 |
| Page: 1 2 3 4 5 6 7 |
| Tissue | Expression Dynamics | Abbreviation |
| Colorectum (GSE201348) |  | FAP: Familial adenomatous polyposis |
| CRC: Colorectal cancer | ||
| Colorectum (HTA11) |  | AD: Adenomas |
| SER: Sessile serrated lesions | ||
| MSI-H: Microsatellite-high colorectal cancer | ||
| MSS: Microsatellite stable colorectal cancer | ||
| Esophagus | 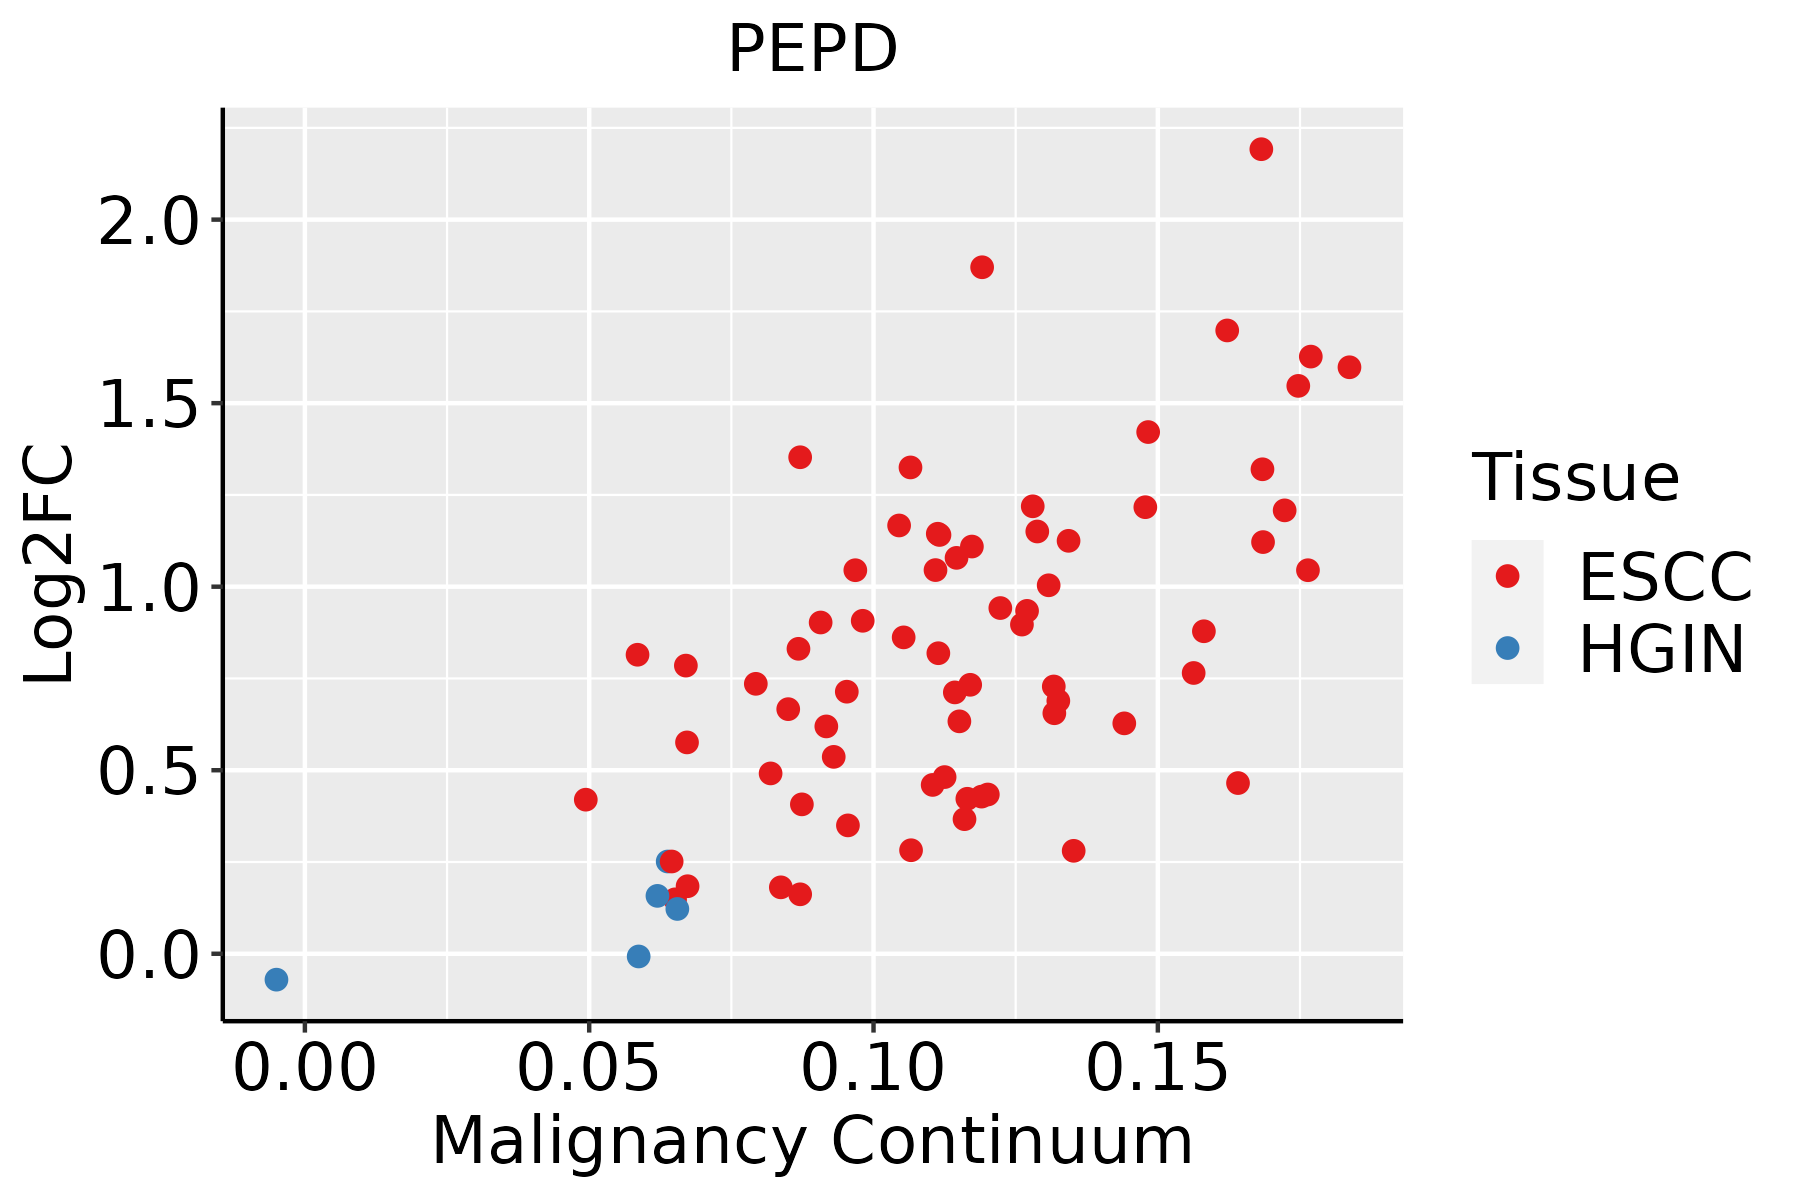 | ESCC: Esophageal squamous cell carcinoma |
| HGIN: High-grade intraepithelial neoplasias | ||
| LGIN: Low-grade intraepithelial neoplasias | ||
| GC |  | CAG: Chronic atrophic gastritis |
| CAG with IM: Chronic atrophic gastritis with intestinal metaplasia | ||
| CSG: Chronic superficial gastritis | ||
| GC: Gastric cancer | ||
| SIM: Severe intestinal metaplasia | ||
| WIM: Wild intestinal metaplasia | ||
| Liver |  | HCC: Hepatocellular carcinoma |
| NAFLD: Non-alcoholic fatty liver disease | ||
| Oral Cavity | 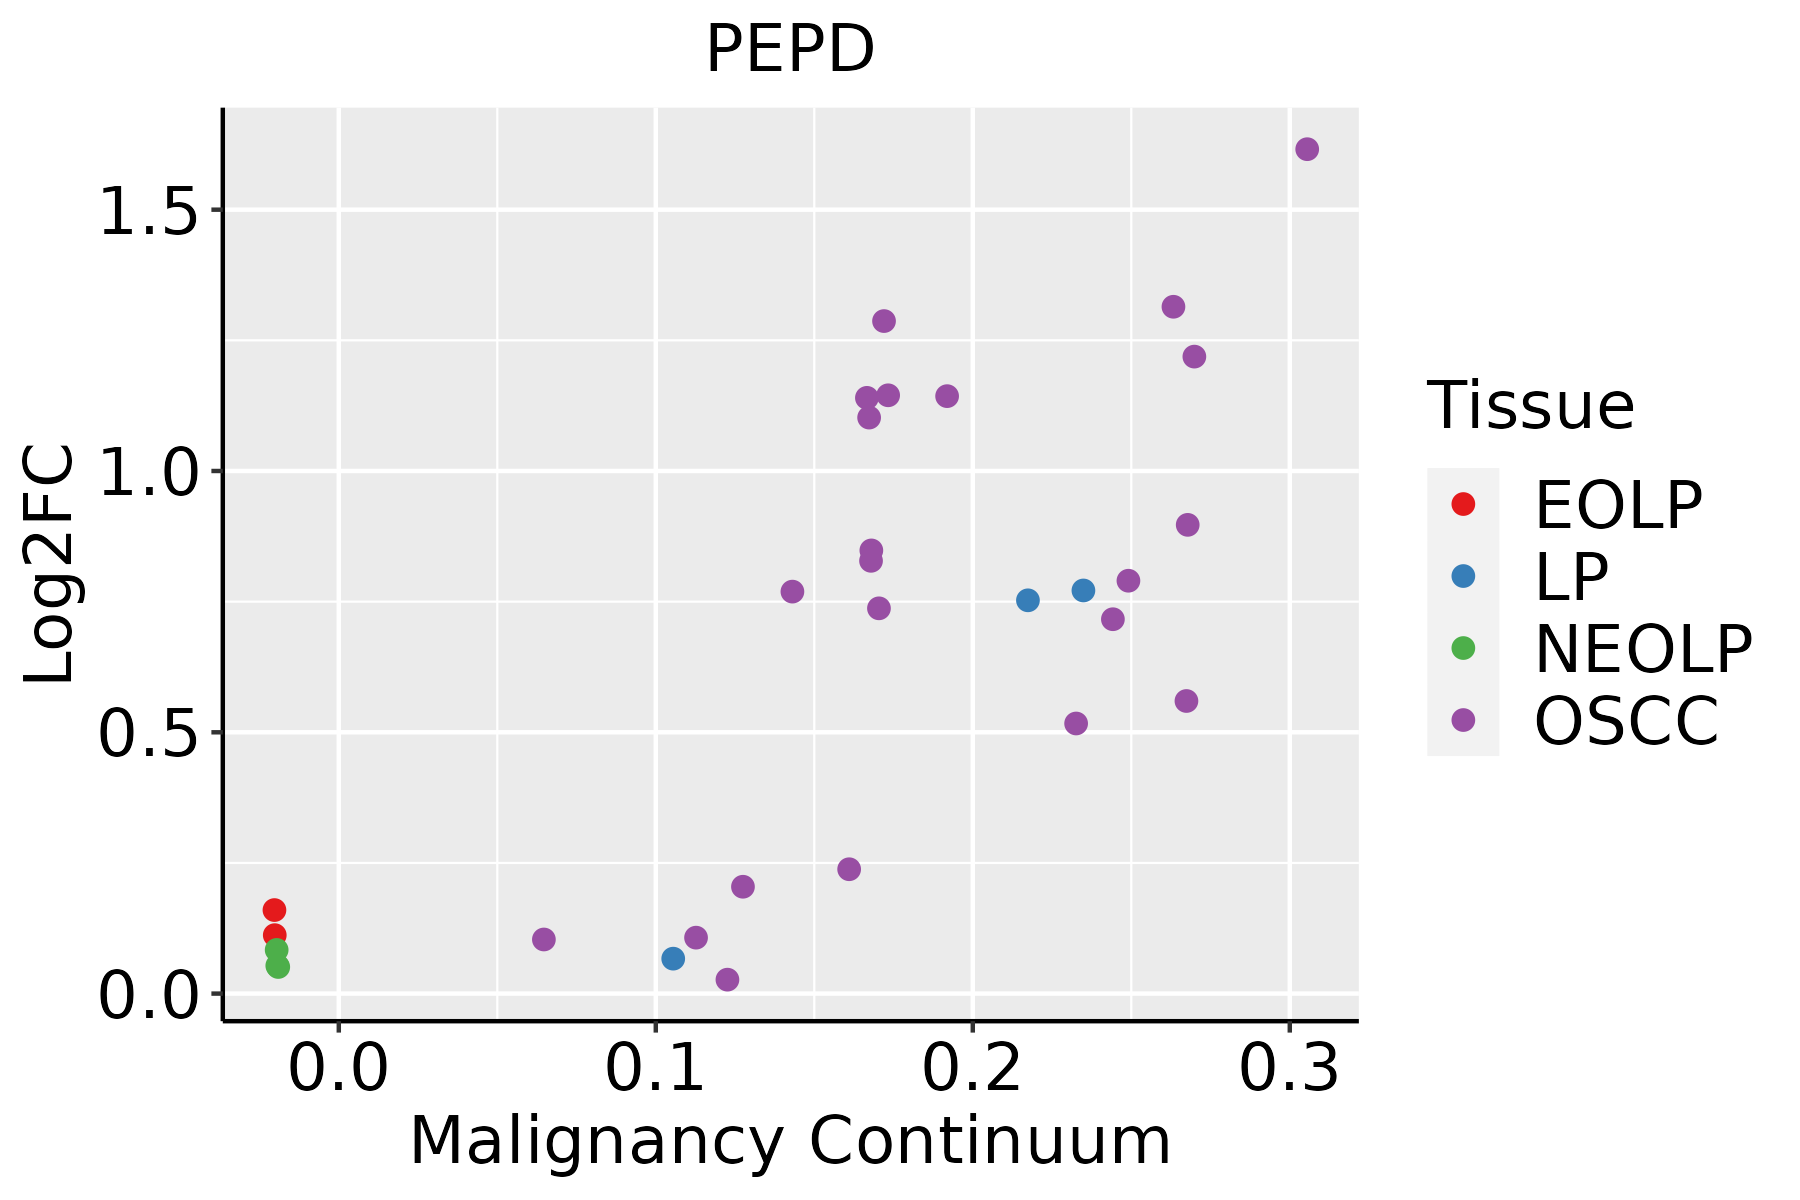 | EOLP: Erosive Oral lichen planus |
| LP: leukoplakia | ||
| NEOLP: Non-erosive oral lichen planus | ||
| OSCC: Oral squamous cell carcinoma | ||
| Skin | 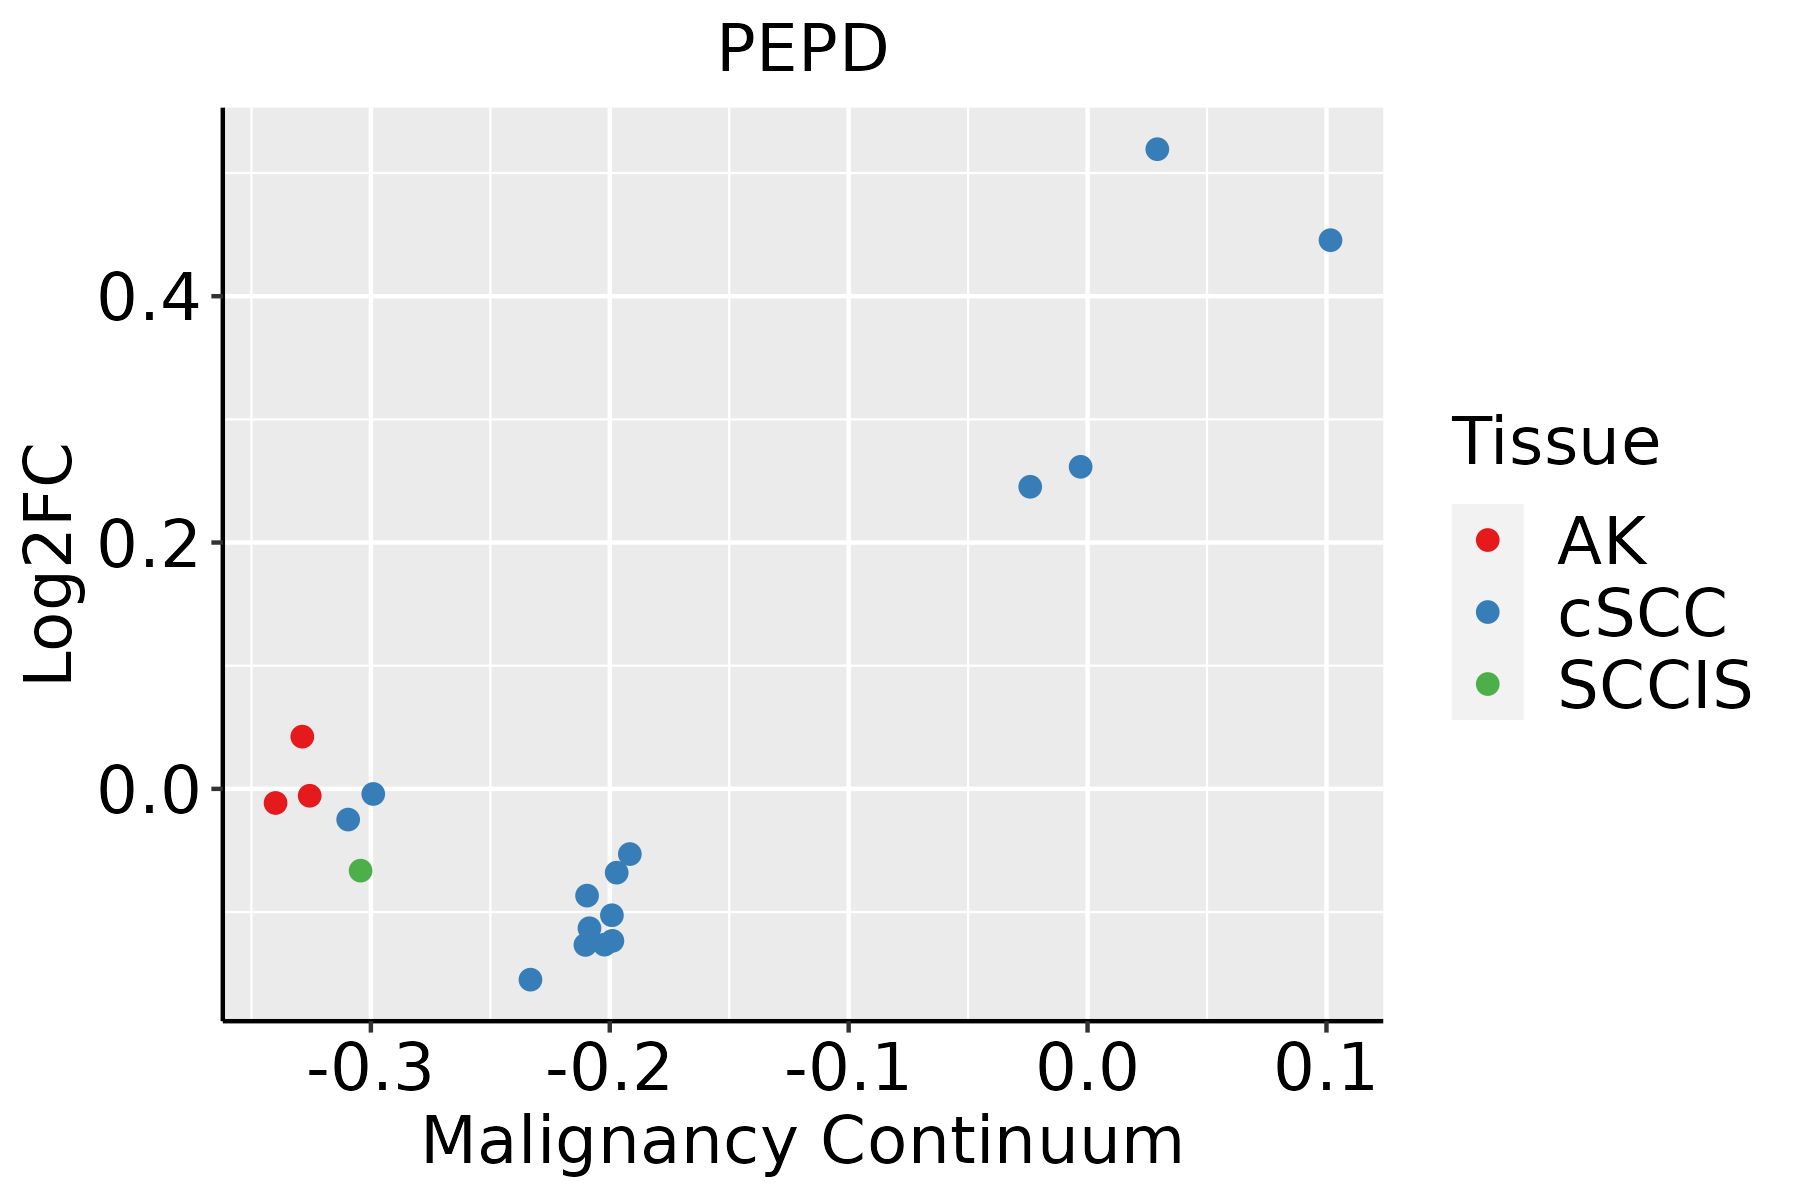 | AK: Actinic keratosis |
| cSCC: Cutaneous squamous cell carcinoma | ||
| SCCIS:squamous cell carcinoma in situ | ||
| Thyroid | 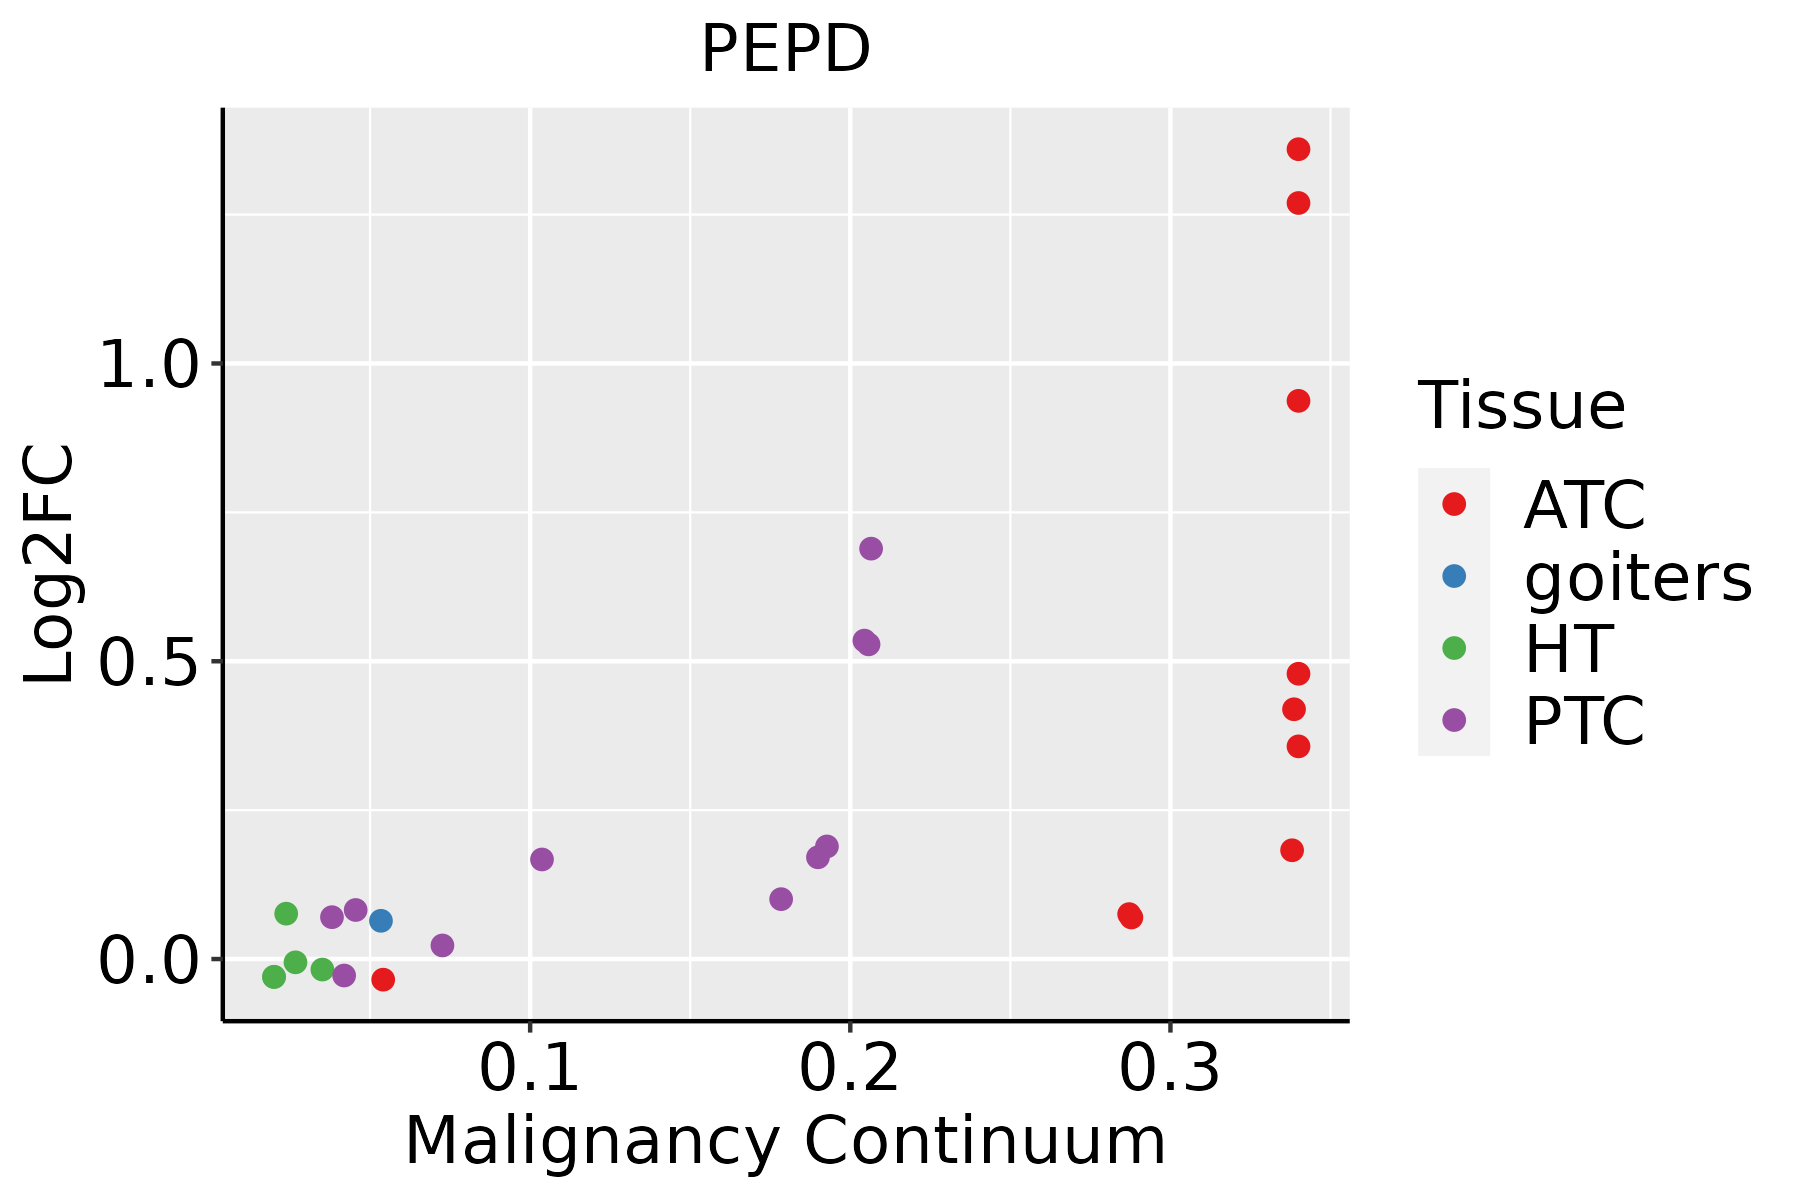 | ATC: Anaplastic thyroid cancer |
| HT: Hashimoto's thyroiditis | ||
| PTC: Papillary thyroid cancer |
| ∗log2FC in expression of this searched gene in stem-like cells from each diseased tissue sample relative to stem-like cells in normal samples in each tissue plotted against the malignancy continuum. Samples are colored based on if they are from different disease stage. |
Top |
Malignant transformation related pathway analysis |
| Find out the enriched GO biological processes and KEGG pathways involved in transition from healthy to precancer to cancer |
| Tissue | Disease Stage | Enriched GO biological Processes |
| Colorectum | AD |  |
| Colorectum | SER |  |
| Colorectum | MSS |  |
| Colorectum | MSI-H |  |
| Colorectum | FAP |  |
| ∗Top 15 enriched GO BP terms are showed in the bar plot of each disease state in each tissue. Each row represents a significant GO biological process which is colored according to the -log10(p.adjust). |
| Page: 1 2 3 4 5 6 7 8 9 |
| GO ID | Tissue | Disease Stage | Description | Gene Ratio | Bg Ratio | pvalue | p.adjust | Count |
| GO:0006520 | Colorectum | AD | cellular amino acid metabolic process | 81/3918 | 284/18723 | 1.37e-03 | 1.19e-02 | 81 |
| GO:00065201 | Colorectum | SER | cellular amino acid metabolic process | 61/2897 | 284/18723 | 4.20e-03 | 3.41e-02 | 61 |
| GO:00329631 | Esophagus | ESCC | collagen metabolic process | 62/8552 | 104/18723 | 2.90e-03 | 1.22e-02 | 62 |
| GO:00065203 | Liver | NAFLD | cellular amino acid metabolic process | 63/1882 | 284/18723 | 1.14e-09 | 2.17e-07 | 63 |
| GO:000652011 | Liver | Cirrhotic | cellular amino acid metabolic process | 103/4634 | 284/18723 | 8.88e-06 | 1.30e-04 | 103 |
| GO:00065202 | Liver | HCC | cellular amino acid metabolic process | 167/7958 | 284/18723 | 1.91e-08 | 4.56e-07 | 167 |
| GO:0032963 | Oral cavity | OSCC | collagen metabolic process | 54/7305 | 104/18723 | 5.00e-03 | 1.96e-02 | 54 |
| GO:00329633 | Thyroid | ATC | collagen metabolic process | 52/6293 | 104/18723 | 3.94e-04 | 2.38e-03 | 52 |
| Page: 1 |
| Pathway ID | Tissue | Disease Stage | Description | Gene Ratio | Bg Ratio | pvalue | p.adjust | qvalue | Count |
| Page: 1 |
Top |
Cell-cell communication analysis |
| Identification of potential cell-cell interactions between two cell types and their ligand-receptor pairs for different disease states |
| Ligand | Receptor | LRpair | Pathway | Tissue | Disease Stage |
| Page: 1 |
Top |
Single-cell gene regulatory network inference analysis |
| Find out the significant the regulons (TFs) and the target genes of each regulon across cell types for different disease states |
| TF | Cell Type | Tissue | Disease Stage | Target Gene | RSS | Regulon Activity |
| ∗The dot plots of a searched regulon are shown for all cell subpopulations in each disease state of each tissue based on the regulon specific score inferred using pySCENIC and by calculating the average expression. |
| Page: 1 |
Top |
Somatic mutation of malignant transformation related genes |
| Annotation of somatic variants for genes involved in malignant transformation |
| Hugo Symbol | Variant Class | Variant Classification | dbSNP RS | HGVSc | HGVSp | HGVSp Short | SWISSPROT | BIOTYPE | SIFT | PolyPhen | Tumor Sample Barcode | Tissue | Histology | Sex | Age | Stage | Therapy Types | Drugs | Outcome |
| PEPD | SNV | Missense_Mutation | rs376817734 | c.991N>T | p.Arg331Cys | p.R331C | P12955 | protein_coding | tolerated(0.13) | benign(0.048) | TCGA-BH-A0B6-01 | Breast | breast invasive carcinoma | Female | <65 | I/II | Unknown | Unknown | SD |
| PEPD | SNV | Missense_Mutation | rs368547324 | c.736N>A | p.Gly246Ser | p.G246S | P12955 | protein_coding | tolerated(0.06) | possibly_damaging(0.471) | TCGA-LL-A6FQ-01 | Breast | breast invasive carcinoma | Female | >=65 | III/IV | Unknown | Unknown | SD |
| PEPD | insertion | In_Frame_Ins | novel | c.790_791insTGCTCACAGTTCTTC | p.Asp264delinsValLeuThrValLeuHis | p.D264delinsVLTVLH | P12955 | protein_coding | TCGA-A2-A0D2-01 | Breast | breast invasive carcinoma | Female | <65 | I/II | Chemotherapy | adriamycin | SD | ||
| PEPD | deletion | Frame_Shift_Del | novel | c.642delN | p.Val215TrpfsTer3 | p.V215Wfs*3 | P12955 | protein_coding | TCGA-EW-A2FV-01 | Breast | breast invasive carcinoma | Female | <65 | III/IV | Chemotherapy | docetaxel | SD | ||
| PEPD | SNV | Missense_Mutation | rs559002568 | c.1255N>A | p.Asp419Asn | p.D419N | P12955 | protein_coding | tolerated(0.13) | benign(0.015) | TCGA-IR-A3LF-01 | Cervix | cervical & endocervical cancer | Female | <65 | I/II | Unknown | Unknown | SD |
| PEPD | SNV | Missense_Mutation | novel | c.1436T>C | p.Met479Thr | p.M479T | P12955 | protein_coding | deleterious(0) | probably_damaging(0.971) | TCGA-AA-A00N-01 | Colorectum | colon adenocarcinoma | Male | >=65 | I/II | Unknown | Unknown | PD |
| PEPD | SNV | Missense_Mutation | c.956N>T | p.Ala319Val | p.A319V | P12955 | protein_coding | deleterious(0.04) | benign(0.035) | TCGA-AA-A01R-01 | Colorectum | colon adenocarcinoma | Male | <65 | III/IV | Chemotherapy | 5-fluorouracil | PD | |
| PEPD | SNV | Missense_Mutation | novel | c.1330N>T | p.Arg444Cys | p.R444C | P12955 | protein_coding | deleterious(0.01) | benign(0.359) | TCGA-AZ-4315-01 | Colorectum | colon adenocarcinoma | Male | <65 | I/II | Unknown | Unknown | SD |
| PEPD | SNV | Missense_Mutation | rs763642654 | c.1292G>A | p.Arg431His | p.R431H | P12955 | protein_coding | tolerated(0.55) | benign(0.003) | TCGA-AZ-4615-01 | Colorectum | colon adenocarcinoma | Male | >=65 | III/IV | Chemotherapy | xeloda | PD |
| PEPD | SNV | Missense_Mutation | rs1063319 | c.932N>A | p.Arg311Gln | p.R311Q | P12955 | protein_coding | tolerated(0.22) | benign(0.02) | TCGA-AZ-6601-01 | Colorectum | colon adenocarcinoma | Male | >=65 | I/II | Unknown | Unknown | PD |
| Page: 1 2 3 4 5 |
Top |
Related drugs of malignant transformation related genes |
| Identification of chemicals and drugs interact with genes involved in malignant transfromation |
| (DGIdb 4.0) |
| Entrez ID | Symbol | Category | Interaction Types | Drug Claim Name | Drug Name | PMIDs |
| Page: 1 |

Copyright 2023-Present -The University of Texas Health Science Center at Houston |