
|
|||||
|
 | |
| |
| |
| |
| |
| |
|
Gene: PELO |
Gene summary for PELO |
| Gene information | Species | Human | Gene symbol | PELO | Gene ID | 53918 |
| Gene name | pelota mRNA surveillance and ribosome rescue factor | |
| Gene Alias | CGI-17 | |
| Cytomap | 5q11.2 | |
| Gene Type | protein-coding | GO ID | GO:0000956 | UniProtAcc | Q9BRX2 |
Top |
Malignant transformation analysis |
| Identification of the aberrant gene expression in precancerous and cancerous lesions by comparing the gene expression of stem-like cells in diseased tissues with normal stem cells |
| Entrez ID | Symbol | Replicates | Species | Organ | Tissue | Adj P-value | Log2FC | Malignancy |
| 53918 | PELO | LZE2T | Human | Esophagus | ESCC | 2.41e-02 | 2.83e-01 | 0.082 |
| 53918 | PELO | LZE4T | Human | Esophagus | ESCC | 1.70e-07 | 2.39e-01 | 0.0811 |
| 53918 | PELO | LZE7T | Human | Esophagus | ESCC | 3.72e-09 | 2.67e-01 | 0.0667 |
| 53918 | PELO | LZE8T | Human | Esophagus | ESCC | 4.29e-06 | 3.50e-02 | 0.067 |
| 53918 | PELO | LZE24T | Human | Esophagus | ESCC | 3.93e-11 | 1.14e-01 | 0.0596 |
| 53918 | PELO | LZE6T | Human | Esophagus | ESCC | 4.74e-05 | 1.79e-01 | 0.0845 |
| 53918 | PELO | P1T-E | Human | Esophagus | ESCC | 7.33e-03 | 1.81e-01 | 0.0875 |
| 53918 | PELO | P2T-E | Human | Esophagus | ESCC | 4.95e-19 | 4.93e-01 | 0.1177 |
| 53918 | PELO | P4T-E | Human | Esophagus | ESCC | 4.43e-14 | 3.60e-01 | 0.1323 |
| 53918 | PELO | P5T-E | Human | Esophagus | ESCC | 1.71e-14 | 3.19e-01 | 0.1327 |
| 53918 | PELO | P8T-E | Human | Esophagus | ESCC | 7.82e-10 | 1.93e-01 | 0.0889 |
| 53918 | PELO | P9T-E | Human | Esophagus | ESCC | 3.71e-16 | 2.35e-01 | 0.1131 |
| 53918 | PELO | P10T-E | Human | Esophagus | ESCC | 1.95e-11 | 1.08e-01 | 0.116 |
| 53918 | PELO | P11T-E | Human | Esophagus | ESCC | 2.55e-20 | 7.61e-01 | 0.1426 |
| 53918 | PELO | P12T-E | Human | Esophagus | ESCC | 2.88e-13 | 2.86e-01 | 0.1122 |
| 53918 | PELO | P15T-E | Human | Esophagus | ESCC | 1.04e-14 | 3.16e-01 | 0.1149 |
| 53918 | PELO | P16T-E | Human | Esophagus | ESCC | 3.05e-09 | 1.58e-01 | 0.1153 |
| 53918 | PELO | P17T-E | Human | Esophagus | ESCC | 1.09e-05 | 2.55e-01 | 0.1278 |
| 53918 | PELO | P19T-E | Human | Esophagus | ESCC | 3.69e-05 | 4.91e-01 | 0.1662 |
| 53918 | PELO | P20T-E | Human | Esophagus | ESCC | 1.10e-14 | 1.12e-01 | 0.1124 |
| Page: 1 2 3 4 5 |
| Tissue | Expression Dynamics | Abbreviation |
| Esophagus | 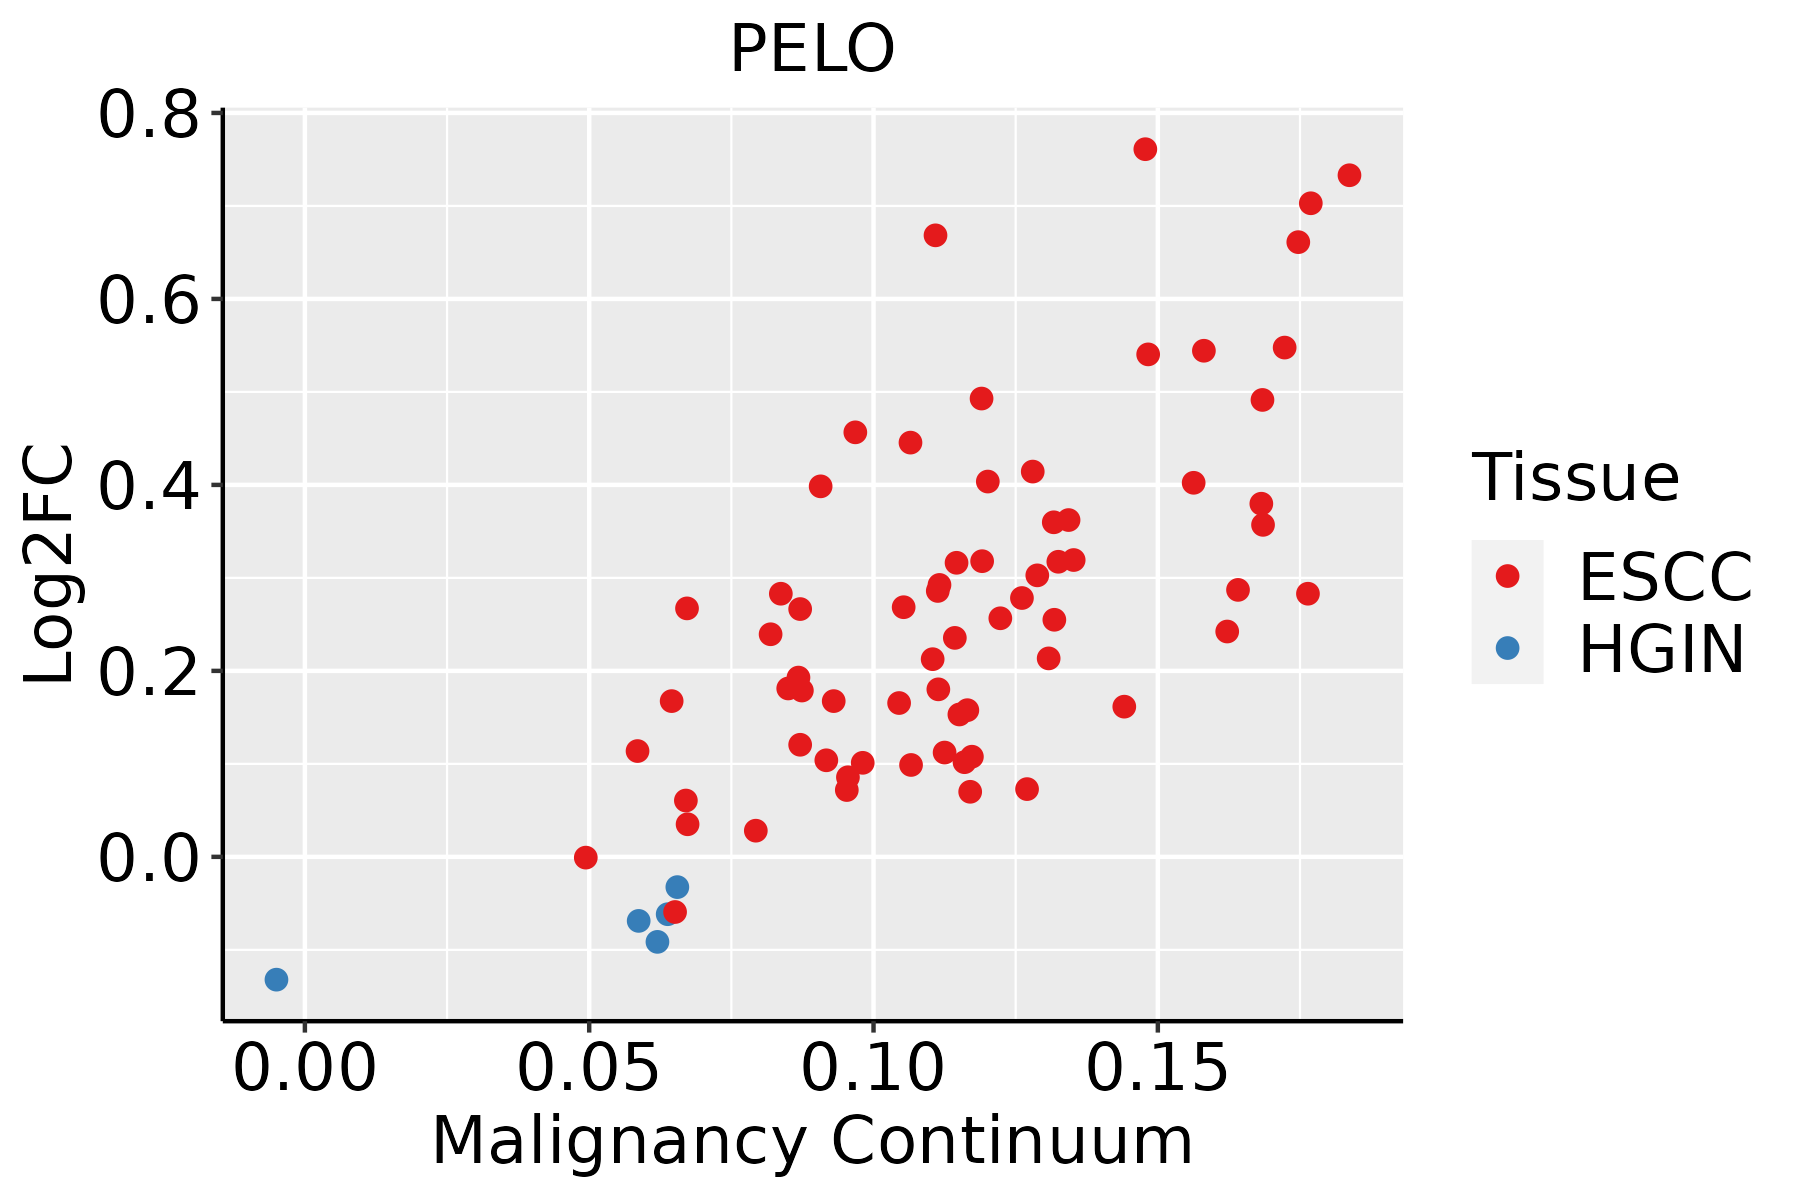 | ESCC: Esophageal squamous cell carcinoma |
| HGIN: High-grade intraepithelial neoplasias | ||
| LGIN: Low-grade intraepithelial neoplasias | ||
| Liver |  | HCC: Hepatocellular carcinoma |
| NAFLD: Non-alcoholic fatty liver disease | ||
| Oral Cavity | 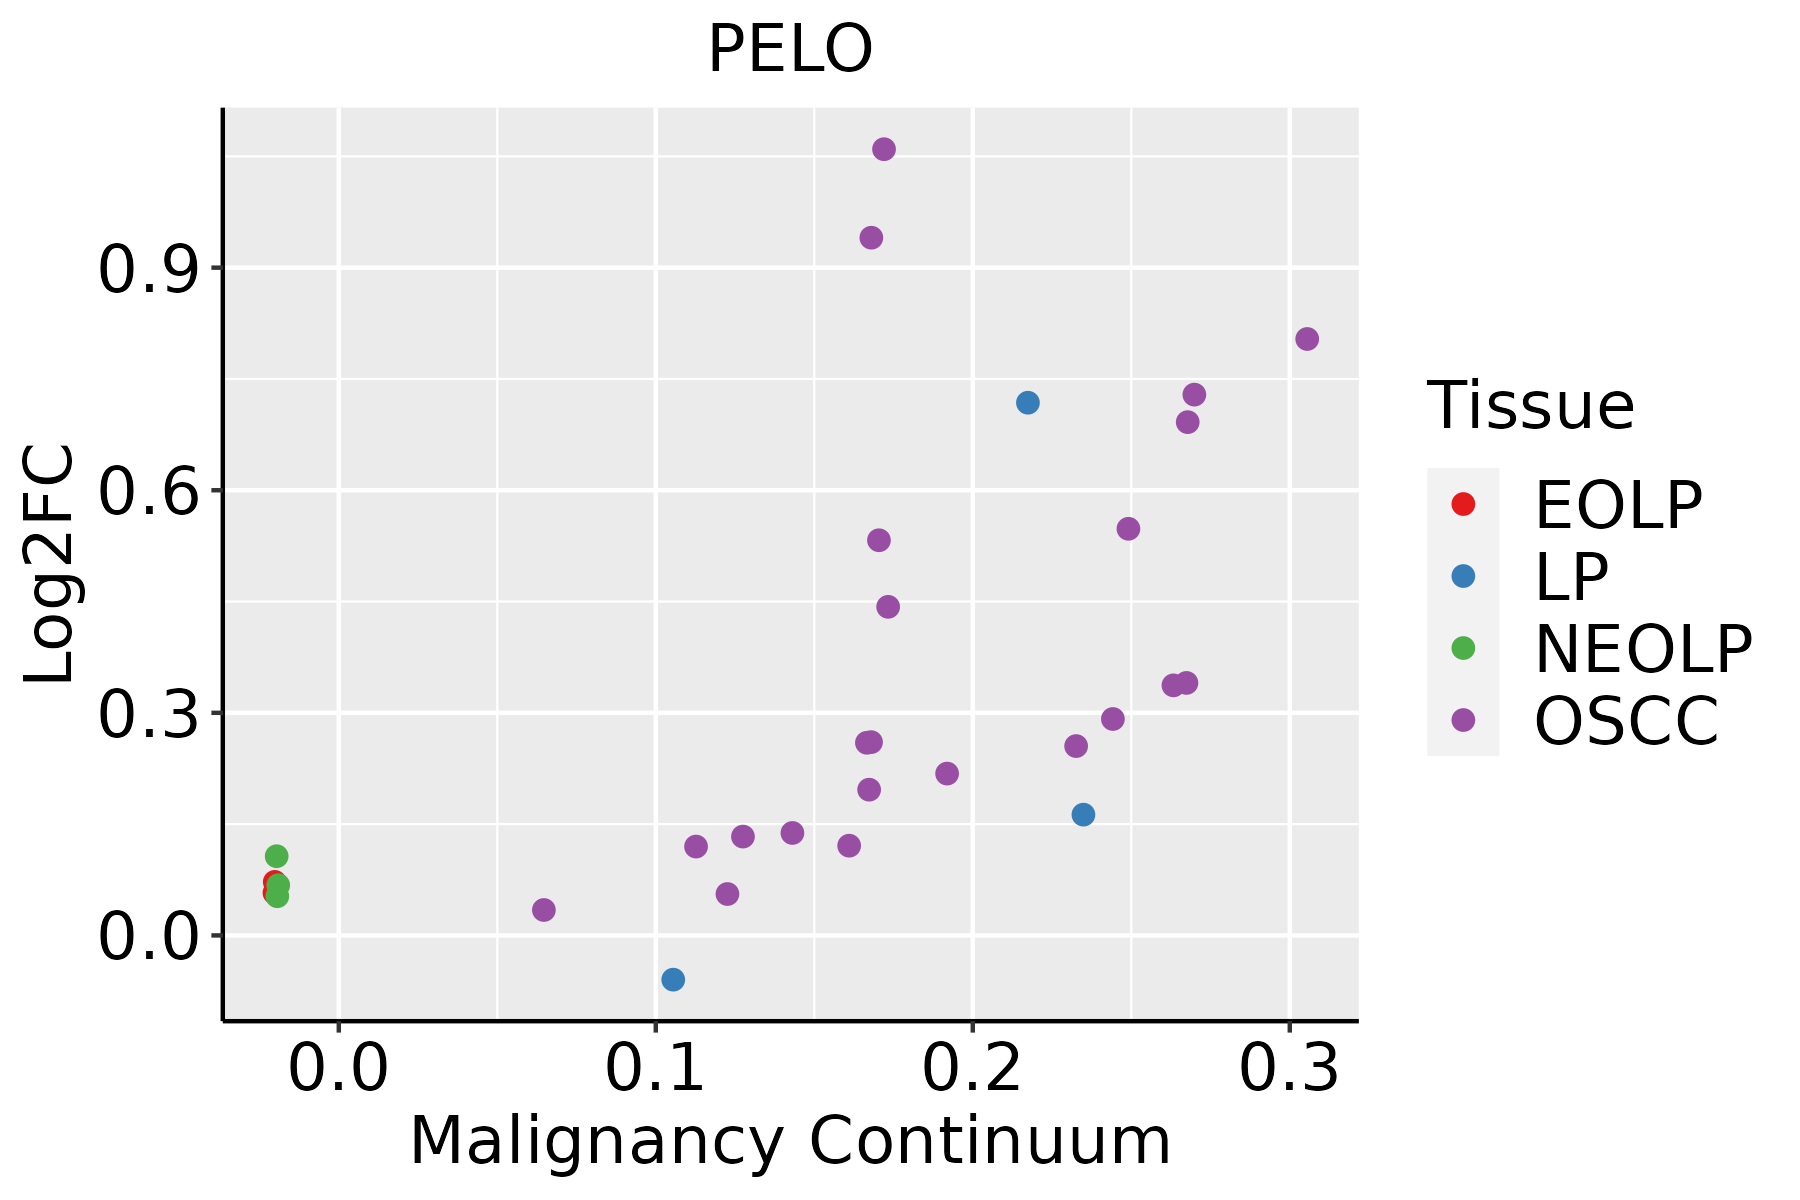 | EOLP: Erosive Oral lichen planus |
| LP: leukoplakia | ||
| NEOLP: Non-erosive oral lichen planus | ||
| OSCC: Oral squamous cell carcinoma |
| ∗log2FC in expression of this searched gene in stem-like cells from each diseased tissue sample relative to stem-like cells in normal samples in each tissue plotted against the malignancy continuum. Samples are colored based on if they are from different disease stage. |
Top |
Malignant transformation related pathway analysis |
| Find out the enriched GO biological processes and KEGG pathways involved in transition from healthy to precancer to cancer |
| Tissue | Disease Stage | Enriched GO biological Processes |
| Colorectum | AD |  |
| Colorectum | SER |  |
| Colorectum | MSS |  |
| Colorectum | MSI-H |  |
| Colorectum | FAP |  |
| ∗Top 15 enriched GO BP terms are showed in the bar plot of each disease state in each tissue. Each row represents a significant GO biological process which is colored according to the -log10(p.adjust). |
| Page: 1 2 3 4 5 6 7 8 9 |
| GO ID | Tissue | Disease Stage | Description | Gene Ratio | Bg Ratio | pvalue | p.adjust | Count |
| GO:0016072110 | Esophagus | ESCC | rRNA metabolic process | 197/8552 | 236/18723 | 1.31e-33 | 1.18e-30 | 197 |
| GO:003466012 | Esophagus | ESCC | ncRNA metabolic process | 346/8552 | 485/18723 | 4.35e-31 | 2.51e-28 | 346 |
| GO:0022411111 | Esophagus | ESCC | cellular component disassembly | 305/8552 | 443/18723 | 1.94e-23 | 4.57e-21 | 305 |
| GO:0006401110 | Esophagus | ESCC | RNA catabolic process | 204/8552 | 278/18723 | 3.39e-21 | 5.66e-19 | 204 |
| GO:0034655110 | Esophagus | ESCC | nucleobase-containing compound catabolic process | 272/8552 | 407/18723 | 2.92e-18 | 2.90e-16 | 272 |
| GO:0006402110 | Esophagus | ESCC | mRNA catabolic process | 170/8552 | 232/18723 | 8.70e-18 | 8.00e-16 | 170 |
| GO:0006417111 | Esophagus | ESCC | regulation of translation | 304/8552 | 468/18723 | 1.53e-17 | 1.33e-15 | 304 |
| GO:000170119 | Esophagus | ESCC | in utero embryonic development | 243/8552 | 367/18723 | 1.00e-15 | 6.86e-14 | 243 |
| GO:004670018 | Esophagus | ESCC | heterocycle catabolic process | 286/8552 | 445/18723 | 1.12e-15 | 7.47e-14 | 286 |
| GO:004427019 | Esophagus | ESCC | cellular nitrogen compound catabolic process | 288/8552 | 451/18723 | 3.03e-15 | 1.79e-13 | 288 |
| GO:001943918 | Esophagus | ESCC | aromatic compound catabolic process | 295/8552 | 467/18723 | 1.09e-14 | 5.98e-13 | 295 |
| GO:190136118 | Esophagus | ESCC | organic cyclic compound catabolic process | 307/8552 | 495/18723 | 9.99e-14 | 4.80e-12 | 307 |
| GO:000095618 | Esophagus | ESCC | nuclear-transcribed mRNA catabolic process | 88/8552 | 112/18723 | 9.41e-13 | 4.14e-11 | 88 |
| GO:190300816 | Esophagus | ESCC | organelle disassembly | 89/8552 | 114/18723 | 1.36e-12 | 5.80e-11 | 89 |
| GO:00903053 | Esophagus | ESCC | nucleic acid phosphodiester bond hydrolysis | 163/8552 | 261/18723 | 3.07e-08 | 5.73e-07 | 163 |
| GO:009872714 | Esophagus | ESCC | maintenance of cell number | 90/8552 | 134/18723 | 3.94e-07 | 5.43e-06 | 90 |
| GO:001982714 | Esophagus | ESCC | stem cell population maintenance | 88/8552 | 131/18723 | 5.23e-07 | 6.97e-06 | 88 |
| GO:000182412 | Esophagus | ESCC | blastocyst development | 73/8552 | 106/18723 | 1.13e-06 | 1.40e-05 | 73 |
| GO:00074926 | Esophagus | ESCC | endoderm development | 54/8552 | 77/18723 | 1.20e-05 | 1.12e-04 | 54 |
| GO:00346613 | Esophagus | ESCC | ncRNA catabolic process | 33/8552 | 43/18723 | 3.25e-05 | 2.69e-04 | 33 |
| Page: 1 2 3 4 5 6 |
| Pathway ID | Tissue | Disease Stage | Description | Gene Ratio | Bg Ratio | pvalue | p.adjust | qvalue | Count |
| hsa0301524 | Esophagus | ESCC | mRNA surveillance pathway | 72/4205 | 97/8465 | 6.12e-07 | 4.10e-06 | 2.10e-06 | 72 |
| hsa0301534 | Esophagus | ESCC | mRNA surveillance pathway | 72/4205 | 97/8465 | 6.12e-07 | 4.10e-06 | 2.10e-06 | 72 |
| hsa030154 | Liver | Cirrhotic | mRNA surveillance pathway | 46/2530 | 97/8465 | 1.92e-04 | 1.30e-03 | 8.03e-04 | 46 |
| hsa0301511 | Liver | Cirrhotic | mRNA surveillance pathway | 46/2530 | 97/8465 | 1.92e-04 | 1.30e-03 | 8.03e-04 | 46 |
| hsa0301521 | Liver | HCC | mRNA surveillance pathway | 66/4020 | 97/8465 | 3.16e-05 | 1.88e-04 | 1.04e-04 | 66 |
| hsa0301531 | Liver | HCC | mRNA surveillance pathway | 66/4020 | 97/8465 | 3.16e-05 | 1.88e-04 | 1.04e-04 | 66 |
| hsa030158 | Oral cavity | OSCC | mRNA surveillance pathway | 75/3704 | 97/8465 | 1.30e-11 | 2.01e-10 | 1.02e-10 | 75 |
| hsa0301513 | Oral cavity | OSCC | mRNA surveillance pathway | 75/3704 | 97/8465 | 1.30e-11 | 2.01e-10 | 1.02e-10 | 75 |
| hsa0301541 | Oral cavity | EOLP | mRNA surveillance pathway | 30/1218 | 97/8465 | 2.26e-05 | 1.20e-04 | 7.07e-05 | 30 |
| hsa0301551 | Oral cavity | EOLP | mRNA surveillance pathway | 30/1218 | 97/8465 | 2.26e-05 | 1.20e-04 | 7.07e-05 | 30 |
| Page: 1 |
Top |
Cell-cell communication analysis |
| Identification of potential cell-cell interactions between two cell types and their ligand-receptor pairs for different disease states |
| Ligand | Receptor | LRpair | Pathway | Tissue | Disease Stage |
| Page: 1 |
Top |
Single-cell gene regulatory network inference analysis |
| Find out the significant the regulons (TFs) and the target genes of each regulon across cell types for different disease states |
| TF | Cell Type | Tissue | Disease Stage | Target Gene | RSS | Regulon Activity |
| ∗The dot plots of a searched regulon are shown for all cell subpopulations in each disease state of each tissue based on the regulon specific score inferred using pySCENIC and by calculating the average expression. |
| Page: 1 |
Top |
Somatic mutation of malignant transformation related genes |
| Annotation of somatic variants for genes involved in malignant transformation |
| Hugo Symbol | Variant Class | Variant Classification | dbSNP RS | HGVSc | HGVSp | HGVSp Short | SWISSPROT | BIOTYPE | SIFT | PolyPhen | Tumor Sample Barcode | Tissue | Histology | Sex | Age | Stage | Therapy Types | Drugs | Outcome |
| PELO | SNV | Missense_Mutation | novel | c.320A>C | p.Asn107Thr | p.N107T | Q9BRX2 | protein_coding | deleterious(0.01) | probably_damaging(0.937) | TCGA-A2-A1G6-01 | Breast | breast invasive carcinoma | Female | <65 | III/IV | Chemotherapy | adriamycin | SD |
| PELO | deletion | Frame_Shift_Del | novel | c.575delN | p.Ala192ValfsTer11 | p.A192Vfs*11 | Q9BRX2 | protein_coding | TCGA-D8-A27V-01 | Breast | breast invasive carcinoma | Female | <65 | I/II | Hormone Therapy | tamoxiphen | SD | ||
| PELO | SNV | Missense_Mutation | novel | c.1018G>A | p.Ala340Thr | p.A340T | Q9BRX2 | protein_coding | deleterious(0.01) | benign(0.005) | TCGA-2W-A8YY-01 | Cervix | cervical & endocervical cancer | Female | <65 | I/II | Chemotherapy | cisplatin | CR |
| PELO | SNV | Missense_Mutation | c.1142N>C | p.Ser381Thr | p.S381T | Q9BRX2 | protein_coding | tolerated(0.29) | possibly_damaging(0.827) | TCGA-DR-A0ZM-01 | Cervix | cervical & endocervical cancer | Female | <65 | III/IV | Unspecific | Cisplatin | SD | |
| PELO | SNV | Missense_Mutation | novel | c.862N>A | p.Glu288Lys | p.E288K | Q9BRX2 | protein_coding | deleterious(0) | benign(0.328) | TCGA-MA-AA41-01 | Cervix | cervical & endocervical cancer | Female | <65 | I/II | Unknown | Unknown | SD |
| PELO | SNV | Missense_Mutation | novel | c.919N>A | p.Ala307Thr | p.A307T | Q9BRX2 | protein_coding | deleterious(0) | probably_damaging(0.989) | TCGA-AA-3949-01 | Colorectum | colon adenocarcinoma | Female | >=65 | III/IV | Unknown | Unknown | SD |
| PELO | SNV | Missense_Mutation | c.1039T>G | p.Ser347Ala | p.S347A | Q9BRX2 | protein_coding | deleterious(0) | probably_damaging(0.992) | TCGA-AD-A5EJ-01 | Colorectum | colon adenocarcinoma | Female | >=65 | I/II | Unknown | Unknown | SD | |
| PELO | SNV | Missense_Mutation | c.331A>T | p.Thr111Ser | p.T111S | Q9BRX2 | protein_coding | tolerated(0.33) | benign(0.088) | TCGA-AY-A69D-01 | Colorectum | colon adenocarcinoma | Female | <65 | I/II | Unknown | Unknown | SD | |
| PELO | SNV | Missense_Mutation | novel | c.265C>A | p.Gln89Lys | p.Q89K | Q9BRX2 | protein_coding | tolerated(0.77) | benign(0.012) | TCGA-AG-3909-01 | Colorectum | rectum adenocarcinoma | Female | >=65 | III/IV | Chemotherapy | folinic | CR |
| PELO | SNV | Missense_Mutation | novel | c.270G>T | p.Glu90Asp | p.E90D | Q9BRX2 | protein_coding | deleterious(0.01) | possibly_damaging(0.838) | TCGA-AG-A002-01 | Colorectum | rectum adenocarcinoma | Male | <65 | I/II | Unknown | Unknown | SD |
| Page: 1 2 3 4 |
Top |
Related drugs of malignant transformation related genes |
| Identification of chemicals and drugs interact with genes involved in malignant transfromation |
| (DGIdb 4.0) |
| Entrez ID | Symbol | Category | Interaction Types | Drug Claim Name | Drug Name | PMIDs |
| Page: 1 |

Copyright 2023-Present -The University of Texas Health Science Center at Houston |