Schematic overview of the cellular and molecular mechanisms involved in the cancer progression, including the proposed cellular and molecular mechanisms in cancer cells trajectory. AT1: alveolar type 1 cells; AT2: alveolar type 2 cells; AAH: atypical adenomatous hyperplasia; AIS: adenocarcinoma in situ; MIA: minimally invasive adenocarcinoma; IA: invasive adenocarcinoma; EMT: epithelial-mesenchymal transition

Home

Download

Statistics

Help

Contact

Center for Computational Systems Medicine
leaf

Gene summary

leaf

Malignant transformation analysis

leaf

Malignant transformation related pathway analysis

leaf

Cell-cell communication analysis

leaf

Single-cell gene regulatory network inference analysis

leaf

Somatic mutation of malignant transformation related genes

leaf

Related drugs of malignant transformation related genes

Gene: PELI2

Gene summary for PELI2

check button Gene summary.

Gene informationSpeciesHuman
Gene symbol

PELI2

Gene ID

57161

Gene namepellino E3 ubiquitin protein ligase family member 2
Gene AliasPELI2
Cytomap14q22.3
Gene Typeprotein-coding
GO ID

GO:0000165

UniProtAcc

Q9H716


Top

Malignant transformation analysis

check button Identification of the aberrant gene expression in precancerous and cancerous lesions by comparing the gene expression of stem-like cells in diseased tissues with normal stem cells
check button Malignant transformation involving gene list.
Entrez IDSymbolReplicatesSpeciesOrganTissueAdj P-valueLog2FCMalignancy
57161PELI2CCI_1HumanCervixCC1.63e-139.06e-010.528
57161PELI2CCI_2HumanCervixCC3.07e-081.17e+000.5249
57161PELI2CCI_3HumanCervixCC9.89e-064.16e-010.516
57161PELI2AEH-subject1HumanEndometriumAEH5.13e-042.41e-01-0.3059
57161PELI2AEH-subject4HumanEndometriumAEH5.31e-083.99e-01-0.2657
57161PELI2AEH-subject5HumanEndometriumAEH3.09e-155.81e-01-0.2953
57161PELI2EEC-subject1HumanEndometriumEEC2.08e-022.58e-01-0.2682
57161PELI2GSM6177621_NYU_UCEC2_lib1_lib1HumanEndometriumEEC3.29e-02-7.54e-02-0.1934
57161PELI2LZE24THumanEsophagusESCC3.33e-164.30e-010.0596
57161PELI2P2T-EHumanEsophagusESCC1.83e-081.79e-010.1177
57161PELI2P8T-EHumanEsophagusESCC6.82e-112.10e-010.0889
57161PELI2P9T-EHumanEsophagusESCC1.86e-061.91e-010.1131
57161PELI2P10T-EHumanEsophagusESCC6.02e-253.86e-010.116
57161PELI2P12T-EHumanEsophagusESCC4.80e-265.43e-010.1122
57161PELI2P15T-EHumanEsophagusESCC2.02e-296.55e-010.1149
57161PELI2P16T-EHumanEsophagusESCC4.46e-051.31e-010.1153
57161PELI2P22T-EHumanEsophagusESCC1.39e-099.72e-020.1236
57161PELI2P23T-EHumanEsophagusESCC2.30e-041.35e-010.108
57161PELI2P26T-EHumanEsophagusESCC1.21e-446.73e-010.1276
57161PELI2P27T-EHumanEsophagusESCC1.09e-121.63e-010.1055
Page: 1 2 3 

check button Transcriptomic changes along malignancy continuum.
TissueExpression DynamicsAbbreviation
CervixThe image shows the transcriptomic changes along malignancy continuum.log2FC in expression of this searched gene in stem-like cells from each diseased tissue sample relative to stem-like cells in normal samples in each tissue plotted against the malignancy continuum. Samples are colored based on if they are from different disease stage.CC: Cervix cancer
HSIL_HPV: HPV-infected high-grade squamous intraepithelial lesions
N_HPV: HPV-infected normal cervix
EndometriumThe image shows the transcriptomic changes along malignancy continuum.log2FC in expression of this searched gene in stem-like cells from each diseased tissue sample relative to stem-like cells in normal samples in each tissue plotted against the malignancy continuum. Samples are colored based on if they are from different disease stage.AEH: Atypical endometrial hyperplasia
EEC: Endometrioid Cancer
EsophagusThe image shows the transcriptomic changes along malignancy continuum.log2FC in expression of this searched gene in stem-like cells from each diseased tissue sample relative to stem-like cells in normal samples in each tissue plotted against the malignancy continuum. Samples are colored based on if they are from different disease stage.
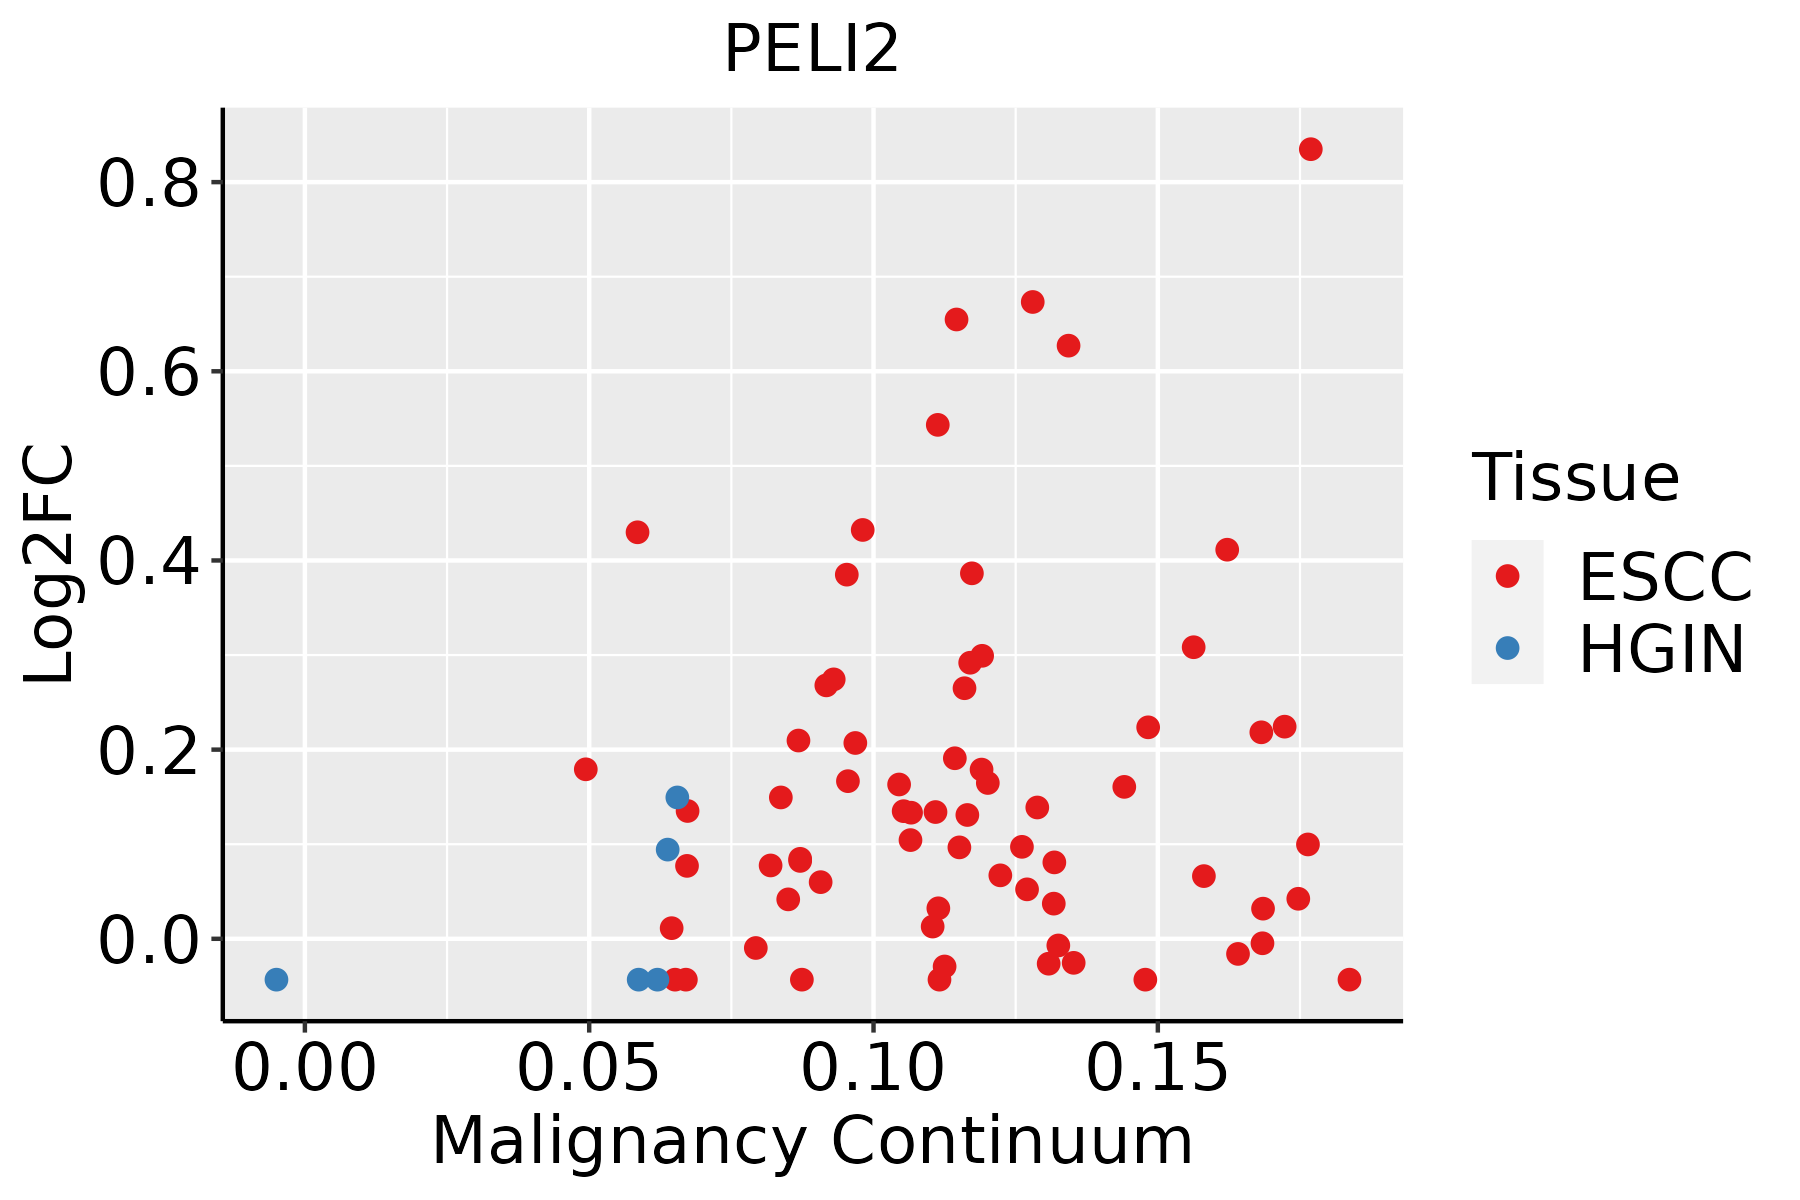
ESCC: Esophageal squamous cell carcinoma
HGIN: High-grade intraepithelial neoplasias
LGIN: Low-grade intraepithelial neoplasias
LungThe image shows the transcriptomic changes along malignancy continuum.log2FC in expression of this searched gene in stem-like cells from each diseased tissue sample relative to stem-like cells in normal samples in each tissue plotted against the malignancy continuum. Samples are colored based on if they are from different disease stage.AAH: Atypical adenomatous hyperplasia
AIS: Adenocarcinoma in situ
IAC: Invasive lung adenocarcinoma
MIA: Minimally invasive adenocarcinoma
SkinThe image shows the transcriptomic changes along malignancy continuum.log2FC in expression of this searched gene in stem-like cells from each diseased tissue sample relative to stem-like cells in normal samples in each tissue plotted against the malignancy continuum. Samples are colored based on if they are from different disease stage.
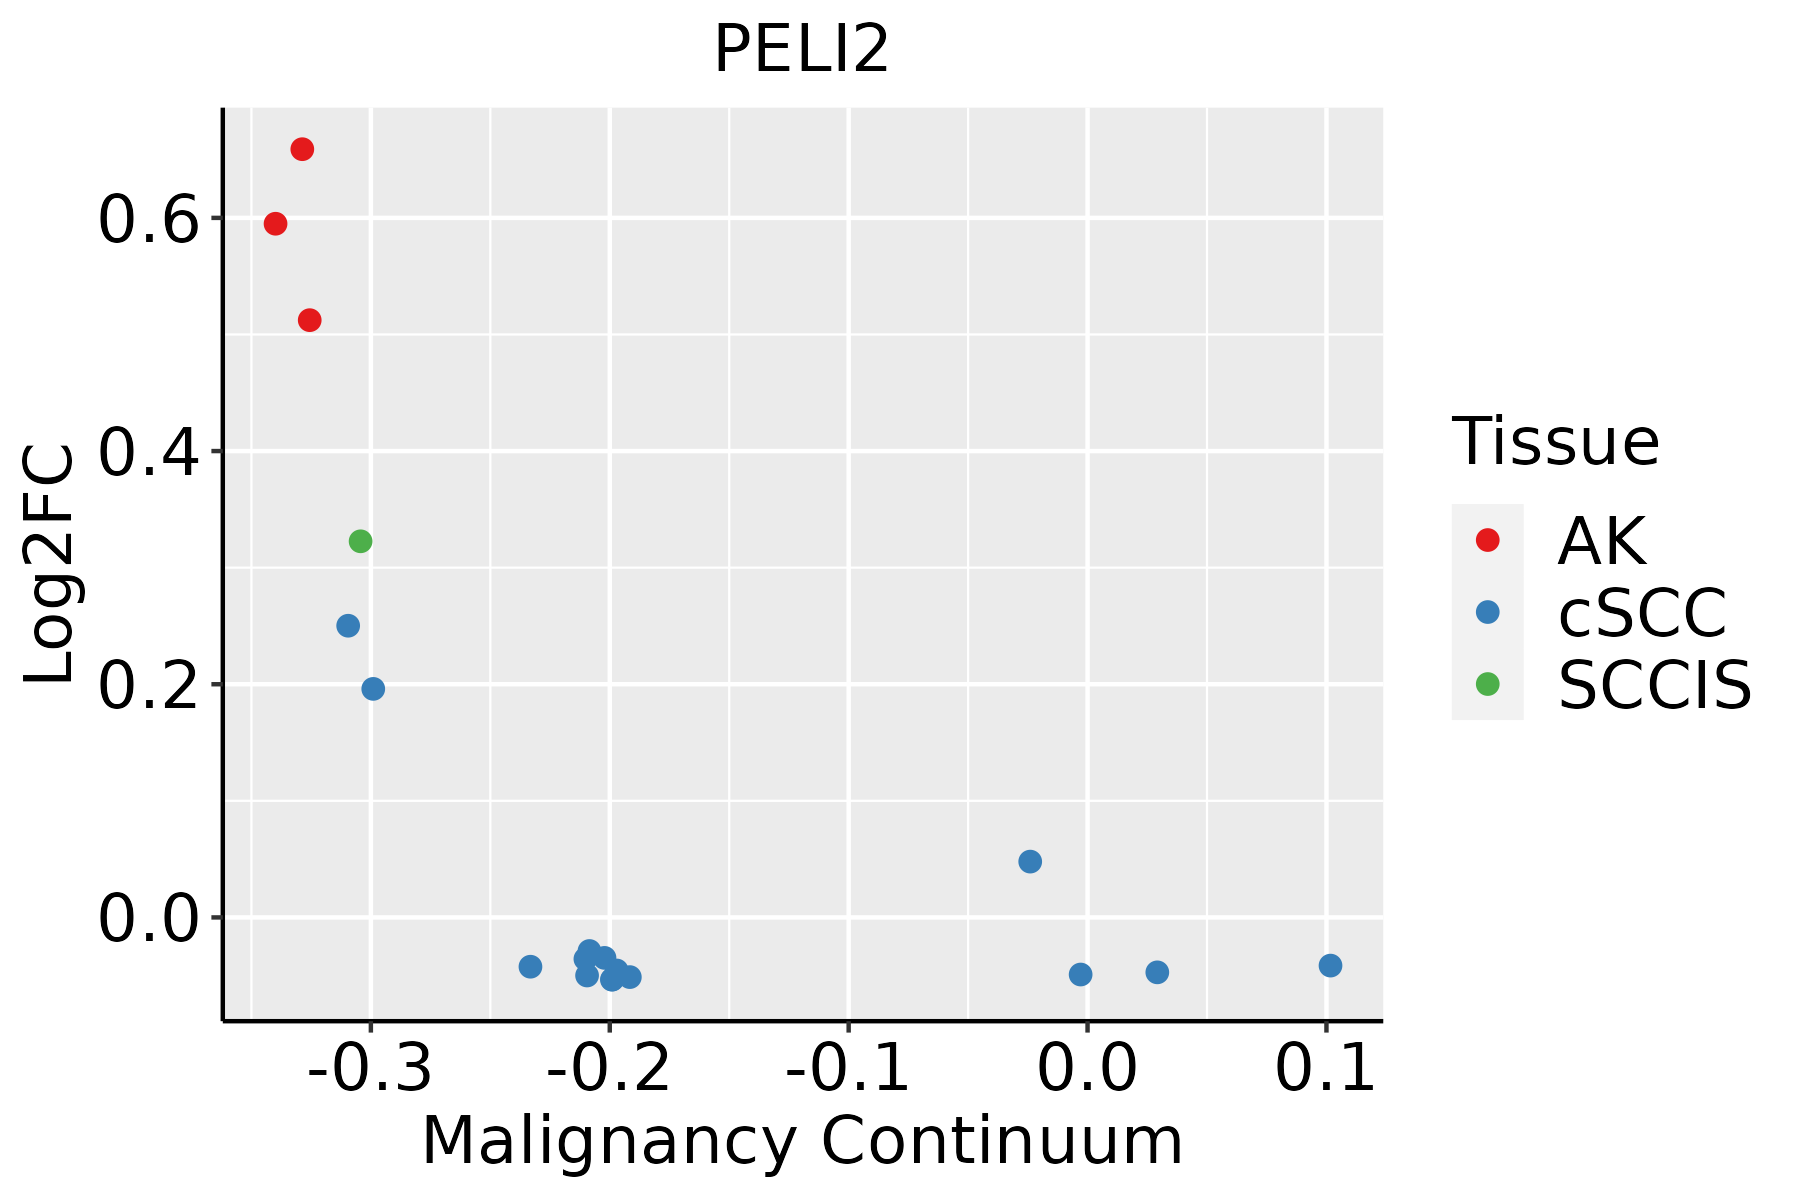
AK: Actinic keratosis
cSCC: Cutaneous squamous cell carcinoma
SCCIS:squamous cell carcinoma in situ
∗log2FC in expression of this searched gene in stem-like cells from each diseased tissue sample relative to stem-like cells in normal samples in each tissue plotted against the malignancy continuum. Samples are colored based on if they are from different disease stage.

Top

Malignant transformation related pathway analysis

check buttonFind out the enriched GO biological processes and KEGG pathways involved in transition from healthy to precancer to cancer
check button Figure of enriched GO biological processes.
TissueDisease StageEnriched GO biological Processes
ColorectumADGO analysis - Figure of enriched GO biological processes: Top 15 enriched GO BP terms are showed in the bar plot of each disease state in each tissue. Each row represents a significant GO biological process which is colored according to the -log10(p.adjust).
ColorectumSERGO analysis - Figure of enriched GO biological processes: Top 15 enriched GO BP terms are showed in the bar plot of each disease state in each tissue. Each row represents a significant GO biological process which is colored according to the -log10(p.adjust).
ColorectumMSSGO analysis - Figure of enriched GO biological processes: Top 15 enriched GO BP terms are showed in the bar plot of each disease state in each tissue. Each row represents a significant GO biological process which is colored according to the -log10(p.adjust).
ColorectumMSI-HGO analysis - Figure of enriched GO biological processes: Top 15 enriched GO BP terms are showed in the bar plot of each disease state in each tissue. Each row represents a significant GO biological process which is colored according to the -log10(p.adjust).
ColorectumFAPGO analysis - Figure of enriched GO biological processes: Top 15 enriched GO BP terms are showed in the bar plot of each disease state in each tissue. Each row represents a significant GO biological process which is colored according to the -log10(p.adjust).
∗Top 15 enriched GO BP terms are showed in the bar plot of each disease state in each tissue. Each row represents a significant GO biological process which is colored according to the -log10(p.adjust).
Page: 1 2 3 4 5 6 7 8 9 

check button Enriched GO biological processes.
GO IDTissueDisease StageDescriptionGene RatioBg Ratiopvaluep.adjustCount
GO:00002097CervixCCprotein polyubiquitination58/2311236/187231.57e-077.41e-0658
GO:00434104CervixCCpositive regulation of MAPK cascade90/2311480/187232.92e-054.83e-0490
GO:00431228CervixCCregulation of I-kappaB kinase/NF-kappaB signaling53/2311249/187234.50e-056.87e-0453
GO:00072497CervixCCI-kappaB kinase/NF-kappaB signaling56/2311281/187231.81e-042.12e-0356
GO:00431237CervixCCpositive regulation of I-kappaB kinase/NF-kappaB signaling37/2311186/187232.15e-031.55e-0237
GO:00431229EndometriumAEHregulation of I-kappaB kinase/NF-kappaB signaling52/2100249/187236.58e-061.59e-0452
GO:00431238EndometriumAEHpositive regulation of I-kappaB kinase/NF-kappaB signaling41/2100186/187231.59e-053.32e-0441
GO:00434105EndometriumAEHpositive regulation of MAPK cascade84/2100480/187232.19e-054.25e-0484
GO:00072498EndometriumAEHI-kappaB kinase/NF-kappaB signaling55/2100281/187232.60e-054.88e-0455
GO:00002098EndometriumAEHprotein polyubiquitination44/2100236/187234.83e-044.97e-0344
GO:004341011EndometriumEECpositive regulation of MAPK cascade89/2168480/187234.21e-061.08e-0489
GO:004312216EndometriumEECregulation of I-kappaB kinase/NF-kappaB signaling53/2168249/187237.59e-061.73e-0453
GO:004312314EndometriumEECpositive regulation of I-kappaB kinase/NF-kappaB signaling42/2168186/187231.47e-052.87e-0442
GO:000724915EndometriumEECI-kappaB kinase/NF-kappaB signaling57/2168281/187231.60e-053.12e-0457
GO:000020913EndometriumEECprotein polyubiquitination46/2168236/187232.65e-043.04e-0346
GO:000020917EsophagusESCCprotein polyubiquitination170/8552236/187231.40e-161.09e-14170
GO:004312318EsophagusESCCpositive regulation of I-kappaB kinase/NF-kappaB signaling132/8552186/187232.07e-128.58e-11132
GO:0043122110EsophagusESCCregulation of I-kappaB kinase/NF-kappaB signaling167/8552249/187236.11e-122.32e-10167
GO:000724919EsophagusESCCI-kappaB kinase/NF-kappaB signaling183/8552281/187233.02e-111.01e-09183
GO:00072495LungIACI-kappaB kinase/NF-kappaB signaling56/2061281/187237.39e-062.62e-0456
Page: 1 2 3 

check button Enriched KEGG pathways.
Pathway IDTissueDisease StageDescriptionGene RatioBg Ratiopvaluep.adjustqvalueCount
Page: 1 

Top

Cell-cell communication analysis

check buttonIdentification of potential cell-cell interactions between two cell types and their ligand-receptor pairs for different disease states
LigandReceptorLRpairPathwayTissueDisease Stage
Page: 1 

Top

Single-cell gene regulatory network inference analysis

check buttonFind out the significant the regulons (TFs) and the target genes of each regulon across cell types for different disease states
TFCell TypeTissueDisease StageTarget GeneRSSRegulon Activity
∗The dot plots of a searched regulon are shown for all cell subpopulations in each disease state of each tissue based on the regulon specific score inferred using pySCENIC and by calculating the average expression.
Page: 1 

Top

Somatic mutation of malignant transformation related genes

check buttonAnnotation of somatic variants for genes involved in malignant transformation
Hugo SymbolVariant ClassVariant ClassificationdbSNP RSHGVScHGVSpHGVSp ShortSWISSPROTBIOTYPESIFTPolyPhenTumor Sample BarcodeTissueHistologySexAgeStageTherapy TypesDrugsOutcome
PELI2SNVMissense_Mutationrs749388627c.686N>Ap.Arg229Glnp.R229QQ9HAT8protein_codingdeleterious(0.05)possibly_damaging(0.582)TCGA-3C-AALI-01Breastbreast invasive carcinomaFemale<65I/IIUnspecificPoly EComplete Response
PELI2SNVMissense_Mutationnovelc.416T>Ap.Phe139Tyrp.F139YQ9HAT8protein_codingtolerated(0.39)benign(0.019)TCGA-A8-A09A-01Breastbreast invasive carcinomaFemale<65I/IIHormone TherapytamoxiphenSD
PELI2SNVMissense_Mutationrs200311934c.974G>Ap.Arg325Glnp.R325QQ9HAT8protein_codingtolerated(0.24)possibly_damaging(0.598)TCGA-A8-A09Q-01Breastbreast invasive carcinomaFemale>=65III/IVHormone TherapyanastrozoleSD
PELI2SNVMissense_Mutationc.801N>Cp.Gln267Hisp.Q267HQ9HAT8protein_codingtolerated(0.51)possibly_damaging(0.77)TCGA-AC-A23H-01Breastbreast invasive carcinomaFemale>=65I/IIUnknownUnknownPD
PELI2SNVMissense_Mutationc.841C>Tp.Arg281Trpp.R281WQ9HAT8protein_codingdeleterious(0)probably_damaging(0.998)TCGA-AR-A24S-01Breastbreast invasive carcinomaFemale<65I/IIHormone TherapyanastrozoleSD
PELI2SNVMissense_Mutationrs557894615c.601N>Ap.Glu201Lysp.E201KQ9HAT8protein_codingtolerated(0.44)benign(0.146)TCGA-E2-A10C-01Breastbreast invasive carcinomaFemale<65I/IIChemotherapycytoxanSD
PELI2insertionFrame_Shift_Insnovelc.978_979insATCTTCAAATATTTTTTTGCTTGTTCTGAGAGGAAAGAATCTTGGAp.Asp327IlefsTer41p.D327Ifs*41Q9HAT8protein_codingTCGA-A2-A0D1-01Breastbreast invasive carcinomaFemale>=65I/IIChemotherapytaxotereSD
PELI2SNVMissense_Mutationnovelc.1187C>Gp.Ala396Glyp.A396GQ9HAT8protein_codingdeleterious(0.01)probably_damaging(0.994)TCGA-C5-A8XH-01Cervixcervical & endocervical cancerFemale<65I/IIUnknownUnknownSD
PELI2SNVMissense_Mutationc.275N>Gp.Glu92Glyp.E92GQ9HAT8protein_codingdeleterious(0.02)probably_damaging(0.922)TCGA-EA-A3HQ-01Cervixcervical & endocervical cancerFemale<65I/IIUnknownUnknownSD
PELI2SNVMissense_Mutationrs375391259c.616N>Ap.Gly206Argp.G206RQ9HAT8protein_codingdeleterious(0.01)probably_damaging(1)TCGA-JW-A852-01Cervixcervical & endocervical cancerFemale<65I/IIUnknownUnknownPD
Page: 1 2 3 4 5 6 

Top

Related drugs of malignant transformation related genes

check buttonIdentification of chemicals and drugs interact with genes involved in malignant transfromation
(DGIdb 4.0)
Entrez IDSymbolCategoryInteraction TypesDrug Claim NameDrug NamePMIDs
Page: 1