
|
|||||
|
 | |
| |
| |
| |
| |
| |
|
Gene: PEG10 |
Gene summary for PEG10 |
| Gene information | Species | Human | Gene symbol | PEG10 | Gene ID | 23089 |
| Gene name | paternally expressed 10 | |
| Gene Alias | EDR | |
| Cytomap | 7q21.3 | |
| Gene Type | protein-coding | GO ID | GO:0006915 | UniProtAcc | Q86TG7 |
Top |
Malignant transformation analysis |
| Identification of the aberrant gene expression in precancerous and cancerous lesions by comparing the gene expression of stem-like cells in diseased tissues with normal stem cells |
| Entrez ID | Symbol | Replicates | Species | Organ | Tissue | Adj P-value | Log2FC | Malignancy |
| 23089 | PEG10 | GSM4909285 | Human | Breast | IDC | 2.41e-02 | 1.08e-01 | 0.21 |
| 23089 | PEG10 | GSM4909287 | Human | Breast | IDC | 3.28e-04 | -1.89e-01 | 0.2057 |
| 23089 | PEG10 | GSM4909291 | Human | Breast | IDC | 7.78e-04 | -2.03e-01 | 0.1753 |
| 23089 | PEG10 | GSM4909297 | Human | Breast | IDC | 7.43e-04 | -2.01e-01 | 0.1517 |
| 23089 | PEG10 | GSM4909302 | Human | Breast | IDC | 6.60e-08 | -2.03e-01 | 0.1545 |
| 23089 | PEG10 | GSM4909304 | Human | Breast | IDC | 4.57e-02 | -1.85e-01 | 0.1636 |
| 23089 | PEG10 | GSM4909306 | Human | Breast | IDC | 9.49e-36 | 8.11e-01 | 0.1564 |
| 23089 | PEG10 | GSM4909311 | Human | Breast | IDC | 8.35e-03 | -1.92e-01 | 0.1534 |
| 23089 | PEG10 | GSM4909312 | Human | Breast | IDC | 1.65e-04 | -2.03e-01 | 0.1552 |
| 23089 | PEG10 | GSM4909313 | Human | Breast | IDC | 1.12e-02 | 3.47e-01 | 0.0391 |
| 23089 | PEG10 | GSM4909315 | Human | Breast | IDC | 3.32e-03 | -2.03e-01 | 0.21 |
| 23089 | PEG10 | GSM4909319 | Human | Breast | IDC | 7.16e-08 | 2.72e-02 | 0.1563 |
| 23089 | PEG10 | brca10 | Human | Breast | Precancer | 2.57e-04 | -1.96e-01 | -0.0029 |
| 23089 | PEG10 | M2 | Human | Breast | IDC | 1.25e-14 | 9.65e-01 | 0.21 |
| 23089 | PEG10 | NCCBC14 | Human | Breast | DCIS | 1.62e-02 | -1.92e-02 | 0.2021 |
| 23089 | PEG10 | NCCBC3 | Human | Breast | DCIS | 1.21e-05 | 3.64e-01 | 0.1198 |
| 23089 | PEG10 | NCCBC5 | Human | Breast | DCIS | 1.28e-02 | -1.56e-01 | 0.2046 |
| 23089 | PEG10 | P1 | Human | Breast | IDC | 6.17e-06 | -2.03e-01 | 0.1527 |
| 23089 | PEG10 | P3 | Human | Breast | IDC | 1.62e-02 | 5.56e-01 | 0.1542 |
| 23089 | PEG10 | DCIS2 | Human | Breast | DCIS | 1.92e-16 | 7.94e-02 | 0.0085 |
| Page: 1 2 3 |
| Tissue | Expression Dynamics | Abbreviation |
| Breast | 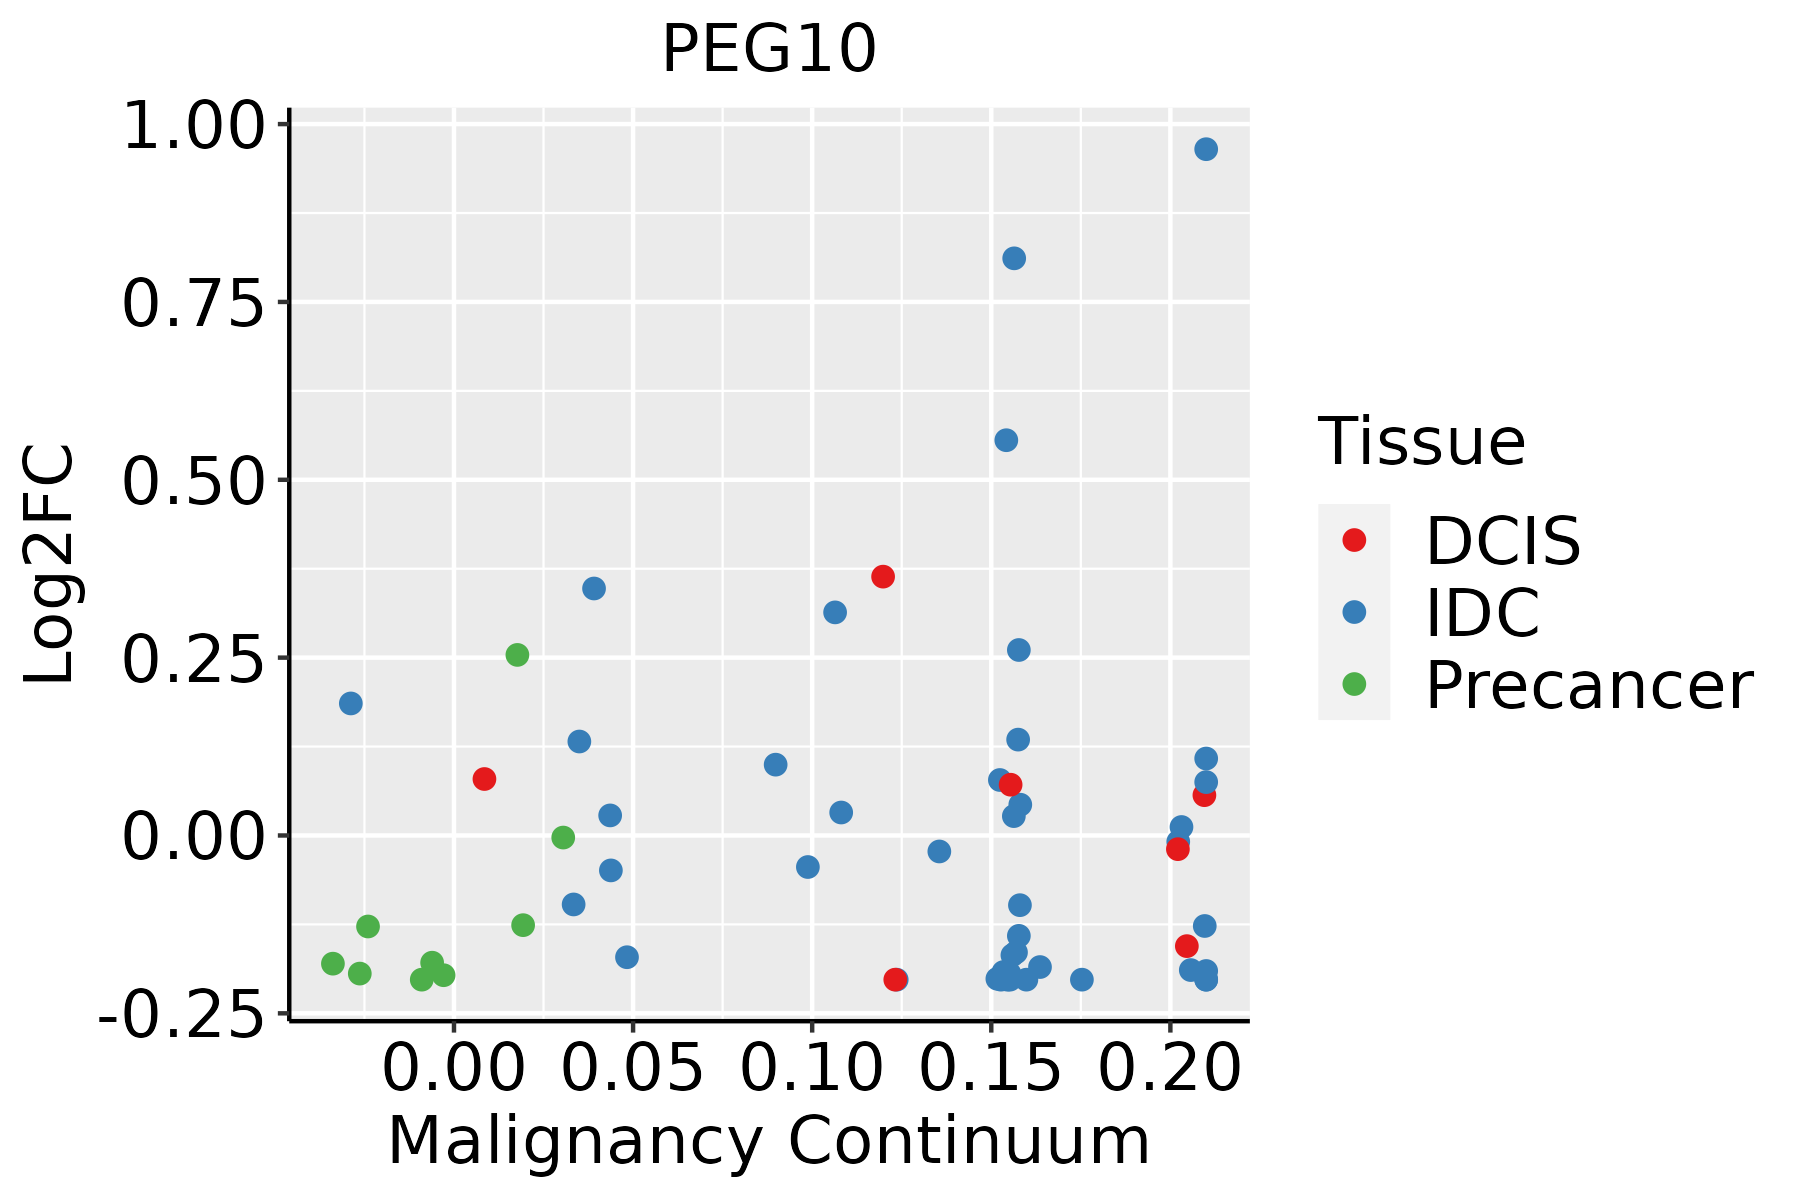 | IDC: Invasive ductal carcinoma |
| DCIS: Ductal carcinoma in situ | ||
| Precancer(BRCA1-mut): Precancerous lesion from BRCA1 mutation carriers | ||
| Esophagus | 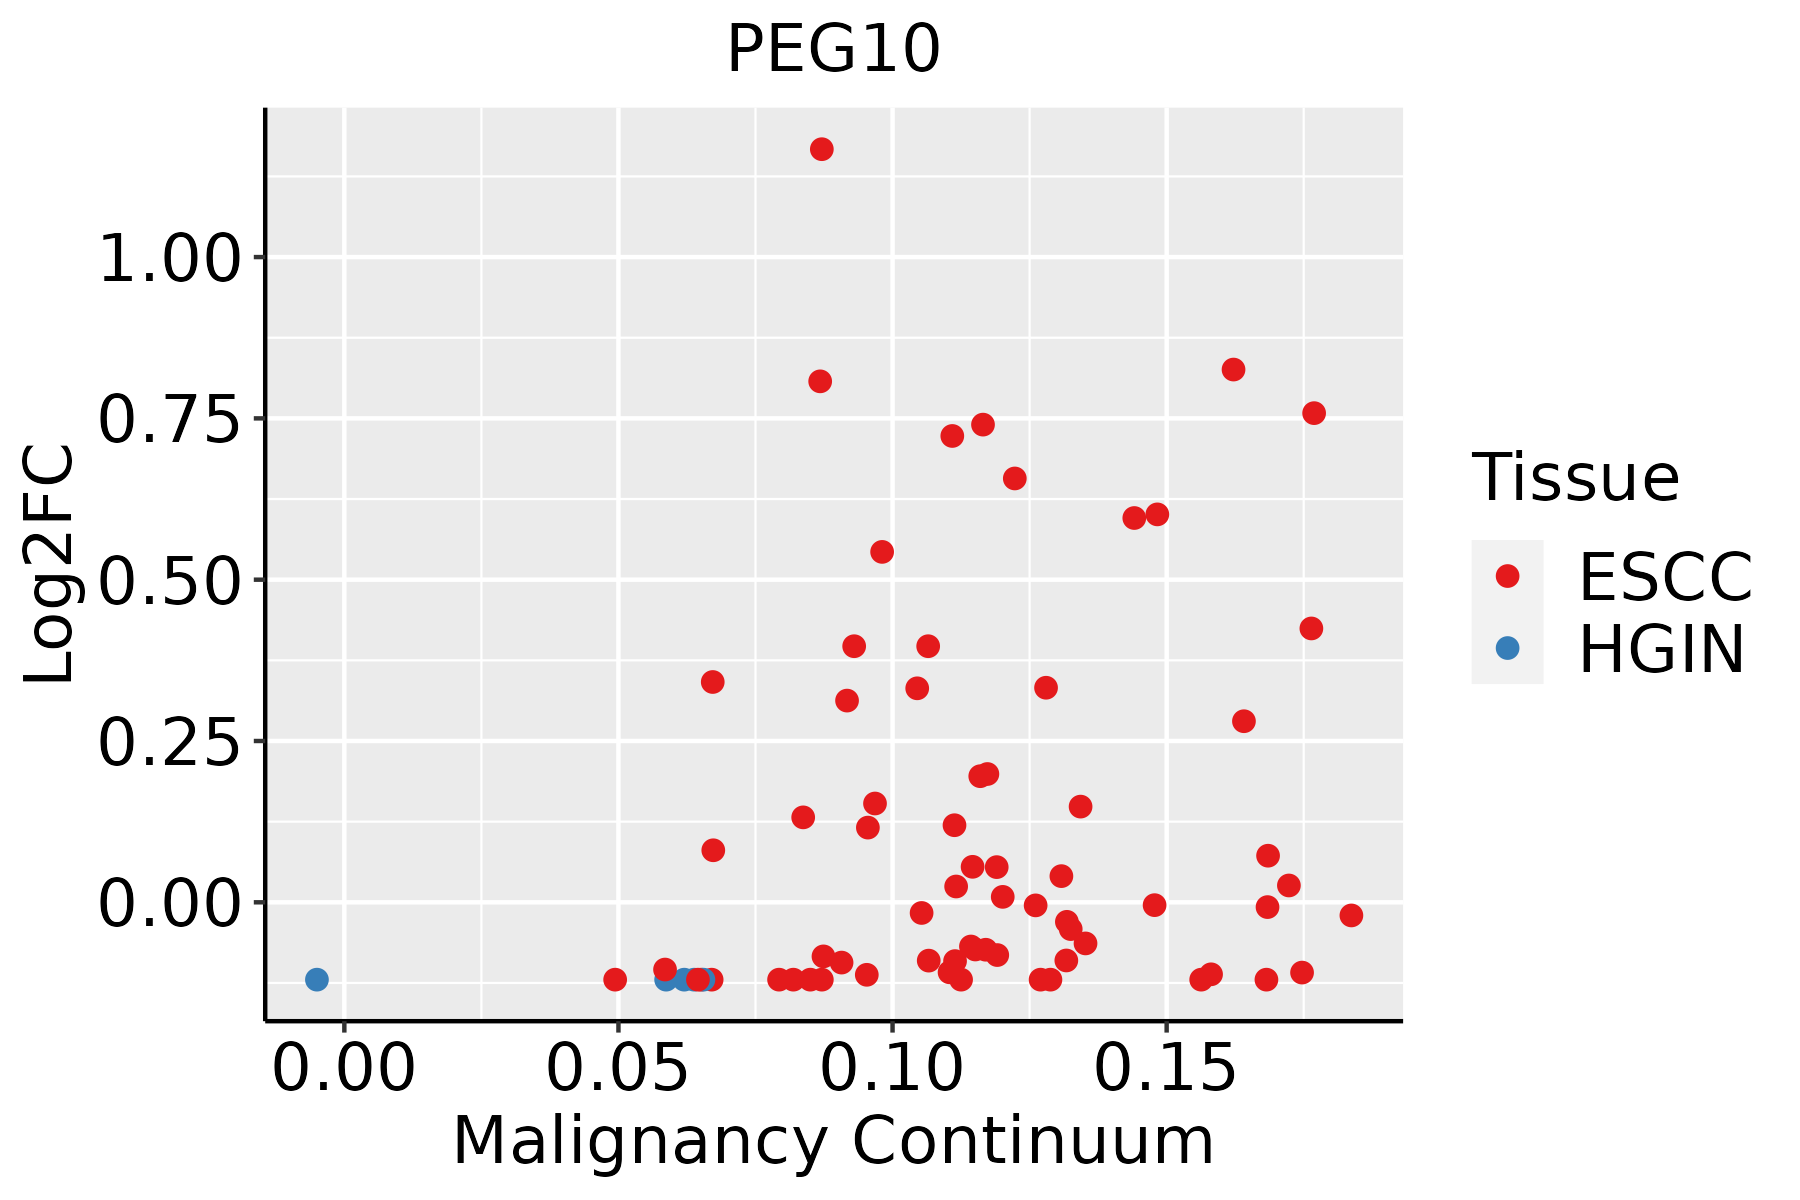 | ESCC: Esophageal squamous cell carcinoma |
| HGIN: High-grade intraepithelial neoplasias | ||
| LGIN: Low-grade intraepithelial neoplasias | ||
| Liver |  | HCC: Hepatocellular carcinoma |
| NAFLD: Non-alcoholic fatty liver disease |
| ∗log2FC in expression of this searched gene in stem-like cells from each diseased tissue sample relative to stem-like cells in normal samples in each tissue plotted against the malignancy continuum. Samples are colored based on if they are from different disease stage. |
Top |
Malignant transformation related pathway analysis |
| Find out the enriched GO biological processes and KEGG pathways involved in transition from healthy to precancer to cancer |
| Tissue | Disease Stage | Enriched GO biological Processes |
| Colorectum | AD |  |
| Colorectum | SER |  |
| Colorectum | MSS |  |
| Colorectum | MSI-H |  |
| Colorectum | FAP |  |
| ∗Top 15 enriched GO BP terms are showed in the bar plot of each disease state in each tissue. Each row represents a significant GO biological process which is colored according to the -log10(p.adjust). |
| Page: 1 2 3 4 5 6 7 8 9 |
| GO ID | Tissue | Disease Stage | Description | Gene Ratio | Bg Ratio | pvalue | p.adjust | Count |
| GO:00715599 | Esophagus | ESCC | response to transforming growth factor beta | 157/8552 | 256/18723 | 2.95e-07 | 4.23e-06 | 157 |
| GO:00715609 | Esophagus | ESCC | cellular response to transforming growth factor beta stimulus | 151/8552 | 250/18723 | 1.78e-06 | 2.10e-05 | 151 |
| GO:00071799 | Esophagus | ESCC | transforming growth factor beta receptor signaling pathway | 121/8552 | 198/18723 | 8.26e-06 | 8.03e-05 | 121 |
| GO:000717810 | Esophagus | ESCC | transmembrane receptor protein serine/threonine kinase signaling pathway | 195/8552 | 355/18723 | 2.58e-04 | 1.58e-03 | 195 |
| GO:00170156 | Esophagus | ESCC | regulation of transforming growth factor beta receptor signaling pathway | 75/8552 | 128/18723 | 2.19e-03 | 9.71e-03 | 75 |
| GO:19038447 | Esophagus | ESCC | regulation of cellular response to transforming growth factor beta stimulus | 76/8552 | 131/18723 | 2.96e-03 | 1.24e-02 | 76 |
| GO:007155921 | Liver | HCC | response to transforming growth factor beta | 141/7958 | 256/18723 | 3.08e-05 | 3.16e-04 | 141 |
| GO:007156021 | Liver | HCC | cellular response to transforming growth factor beta stimulus | 137/7958 | 250/18723 | 5.47e-05 | 5.14e-04 | 137 |
| GO:000717921 | Liver | HCC | transforming growth factor beta receptor signaling pathway | 106/7958 | 198/18723 | 1.09e-03 | 6.23e-03 | 106 |
| GO:19038442 | Liver | HCC | regulation of cellular response to transforming growth factor beta stimulus | 72/7958 | 131/18723 | 2.65e-03 | 1.27e-02 | 72 |
| GO:001701511 | Liver | HCC | regulation of transforming growth factor beta receptor signaling pathway | 70/7958 | 128/18723 | 3.56e-03 | 1.59e-02 | 70 |
| Page: 1 |
| Pathway ID | Tissue | Disease Stage | Description | Gene Ratio | Bg Ratio | pvalue | p.adjust | qvalue | Count |
| Page: 1 |
Top |
Cell-cell communication analysis |
| Identification of potential cell-cell interactions between two cell types and their ligand-receptor pairs for different disease states |
| Ligand | Receptor | LRpair | Pathway | Tissue | Disease Stage |
| Page: 1 |
Top |
Single-cell gene regulatory network inference analysis |
| Find out the significant the regulons (TFs) and the target genes of each regulon across cell types for different disease states |
| TF | Cell Type | Tissue | Disease Stage | Target Gene | RSS | Regulon Activity |
| ∗The dot plots of a searched regulon are shown for all cell subpopulations in each disease state of each tissue based on the regulon specific score inferred using pySCENIC and by calculating the average expression. |
| Page: 1 |
Top |
Somatic mutation of malignant transformation related genes |
| Annotation of somatic variants for genes involved in malignant transformation |
| Hugo Symbol | Variant Class | Variant Classification | dbSNP RS | HGVSc | HGVSp | HGVSp Short | SWISSPROT | BIOTYPE | SIFT | PolyPhen | Tumor Sample Barcode | Tissue | Histology | Sex | Age | Stage | Therapy Types | Drugs | Outcome |
| PEG10 | SNV | Missense_Mutation | rs763296537 | c.719N>A | p.Arg240Gln | p.R240Q | protein_coding | tolerated(0.3) | possibly_damaging(0.602) | TCGA-EW-A1J2-01 | Breast | breast invasive carcinoma | Female | <65 | I/II | Chemotherapy | taxotere | SD | |
| PEG10 | SNV | Missense_Mutation | novel | c.242G>A | p.Arg81Lys | p.R81K | protein_coding | tolerated_low_confidence(0.15) | benign(0) | TCGA-LD-A74U-01 | Breast | breast invasive carcinoma | Female | >=65 | III/IV | Chemotherapy | taxotere | SD | |
| PEG10 | deletion | Frame_Shift_Del | novel | c.395delN | p.Asp132ValfsTer19 | p.D132Vfs*19 | protein_coding | TCGA-D8-A27V-01 | Breast | breast invasive carcinoma | Female | <65 | I/II | Hormone Therapy | tamoxiphen | SD | |||
| PEG10 | SNV | Missense_Mutation | novel | c.703N>A | p.Glu235Lys | p.E235K | protein_coding | deleterious(0.02) | possibly_damaging(0.868) | TCGA-PN-A8MA-01 | Cervix | cervical & endocervical cancer | Female | <65 | I/II | Chemotherapy | cisplatin | SD | |
| PEG10 | SNV | Missense_Mutation | novel | c.387N>T | p.Glu129Asp | p.E129D | protein_coding | tolerated(0.14) | benign(0.017) | TCGA-VS-A9U6-01 | Cervix | cervical & endocervical cancer | Female | <65 | I/II | Chemotherapy | cisplatin | PD | |
| PEG10 | SNV | Missense_Mutation | c.575N>C | p.Val192Ala | p.V192A | protein_coding | tolerated(0.46) | benign(0.003) | TCGA-A6-2686-01 | Colorectum | colon adenocarcinoma | Female | >=65 | I/II | Unknown | Unknown | SD | ||
| PEG10 | SNV | Missense_Mutation | c.611G>A | p.Arg204His | p.R204H | protein_coding | deleterious(0.04) | probably_damaging(0.995) | TCGA-CM-6162-01 | Colorectum | colon adenocarcinoma | Female | <65 | III/IV | Chemotherapy | oxaliplatin | SD | ||
| PEG10 | SNV | Missense_Mutation | c.362G>A | p.Arg121Gln | p.R121Q | protein_coding | tolerated(0.18) | benign(0.011) | TCGA-NH-A5IV-01 | Colorectum | colon adenocarcinoma | Female | >=65 | I/II | Unknown | Unknown | SD | ||
| PEG10 | SNV | Missense_Mutation | rs774623837 | c.746N>A | p.Arg249His | p.R249H | protein_coding | deleterious(0) | probably_damaging(0.971) | TCGA-AG-4022-01 | Colorectum | rectum adenocarcinoma | Female | <65 | I/II | Chemotherapy | 5-fluorouracil | CR | |
| PEG10 | SNV | Missense_Mutation | c.752N>A | p.Arg251His | p.R251H | protein_coding | deleterious(0) | benign(0.108) | TCGA-AG-A020-01 | Colorectum | rectum adenocarcinoma | Female | <65 | III/IV | Chemotherapy | folinic | CR |
| Page: 1 2 3 4 5 6 |
Top |
Related drugs of malignant transformation related genes |
| Identification of chemicals and drugs interact with genes involved in malignant transfromation |
| (DGIdb 4.0) |
| Entrez ID | Symbol | Category | Interaction Types | Drug Claim Name | Drug Name | PMIDs |
| Page: 1 |

Copyright 2023-Present -The University of Texas Health Science Center at Houston |