
|
|||||
|
 | |
| |
| |
| |
| |
| |
|
Gene: PECAM1 |
Gene summary for PECAM1 |
| Gene information | Species | Human | Gene symbol | PECAM1 | Gene ID | 5175 |
| Gene name | platelet and endothelial cell adhesion molecule 1 | |
| Gene Alias | CD31 | |
| Cytomap | 17q23.3 | |
| Gene Type | protein-coding | GO ID | GO:0001568 | UniProtAcc | A0A075B738 |
Top |
Malignant transformation analysis |
| Identification of the aberrant gene expression in precancerous and cancerous lesions by comparing the gene expression of stem-like cells in diseased tissues with normal stem cells |
| Entrez ID | Symbol | Replicates | Species | Organ | Tissue | Adj P-value | Log2FC | Malignancy |
| 5175 | PECAM1 | EEC-subject3 | Human | Endometrium | EEC | 1.15e-02 | 1.12e-01 | -0.2525 |
| 5175 | PECAM1 | HCC1 | Human | Liver | HCC | 6.77e-03 | 3.77e+00 | 0.5336 |
| 5175 | PECAM1 | HCC2 | Human | Liver | HCC | 1.67e-02 | 3.52e-01 | 0.5341 |
| 5175 | PECAM1 | HCC5 | Human | Liver | HCC | 5.58e-08 | 2.50e+00 | 0.4932 |
| 5175 | PECAM1 | S028 | Human | Liver | HCC | 4.80e-02 | 4.08e-02 | 0.2503 |
| 5175 | PECAM1 | S029 | Human | Liver | HCC | 1.98e-04 | 2.98e-01 | 0.2581 |
| Page: 1 |
| Tissue | Expression Dynamics | Abbreviation |
| Endometrium | 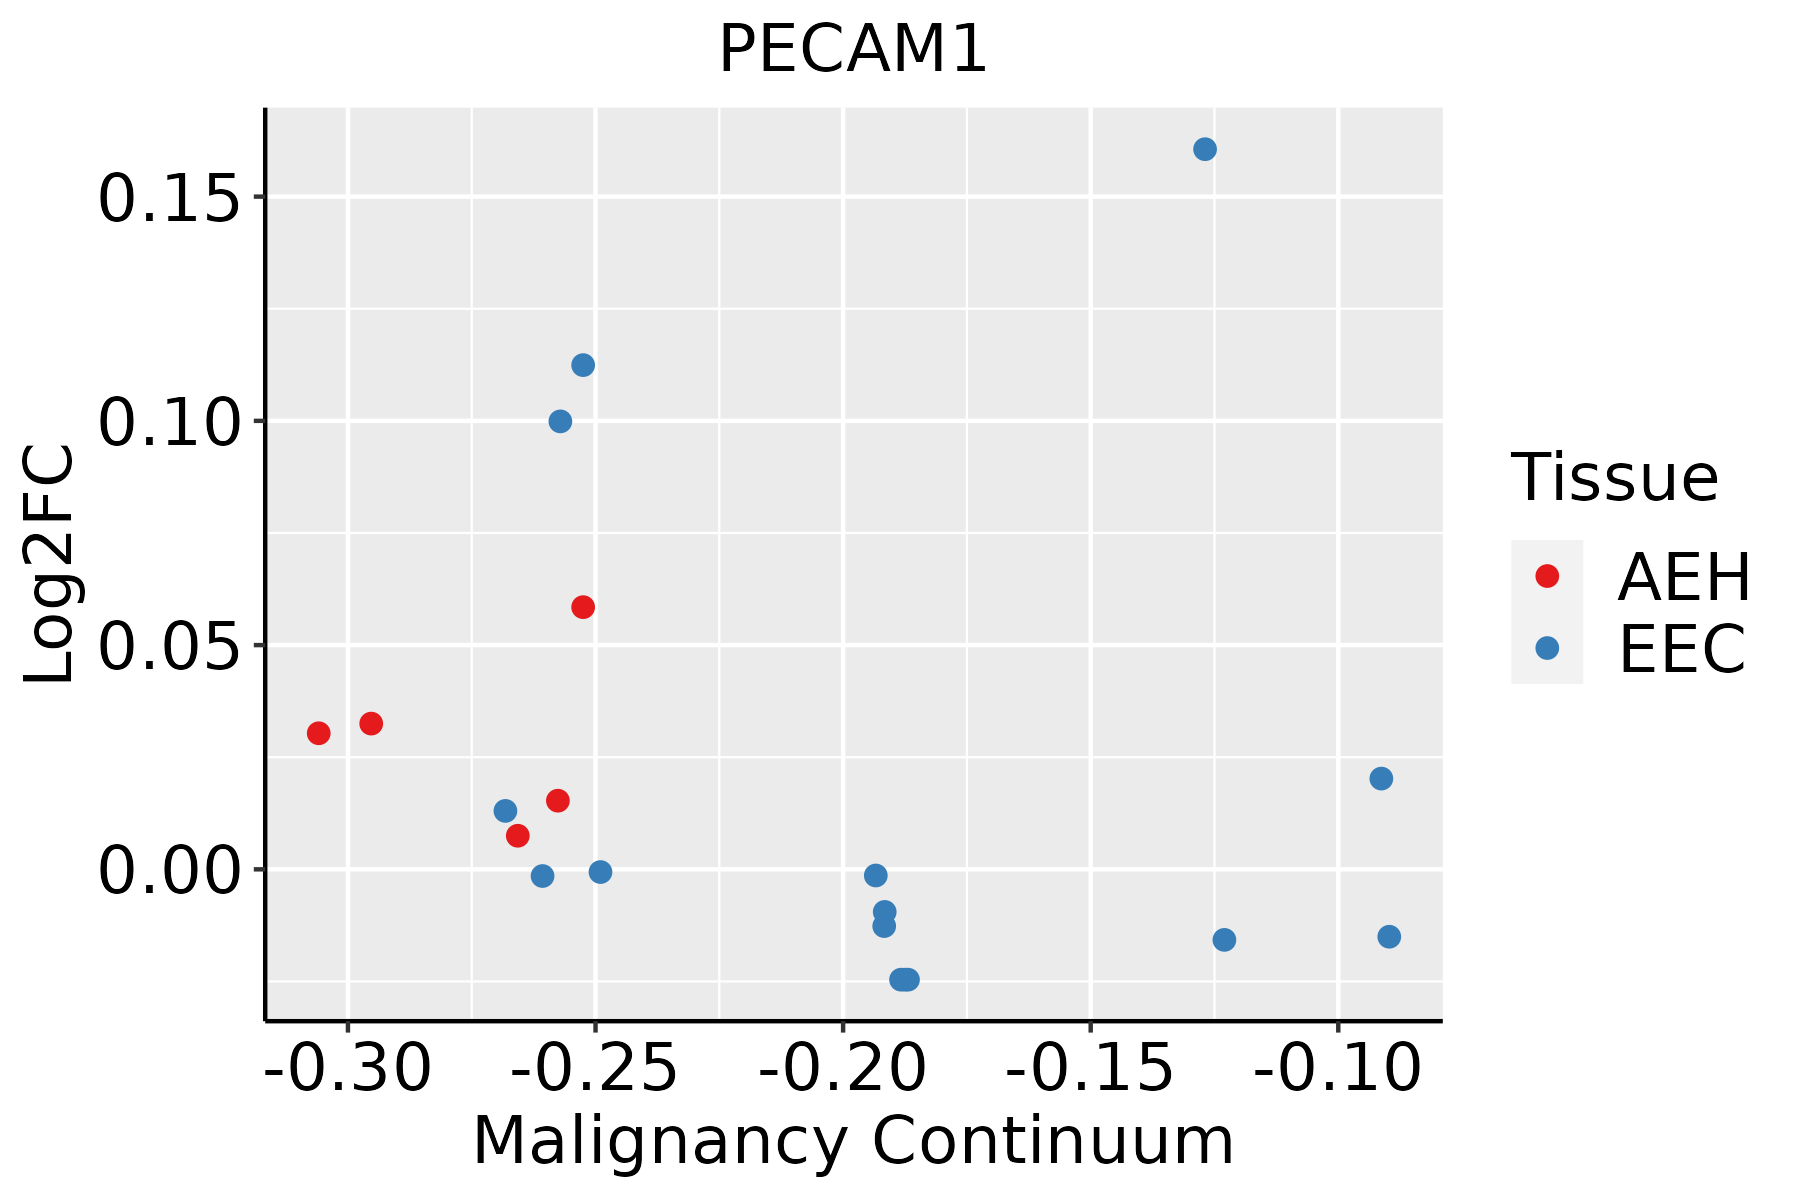 | AEH: Atypical endometrial hyperplasia |
| EEC: Endometrioid Cancer | ||
| Liver | 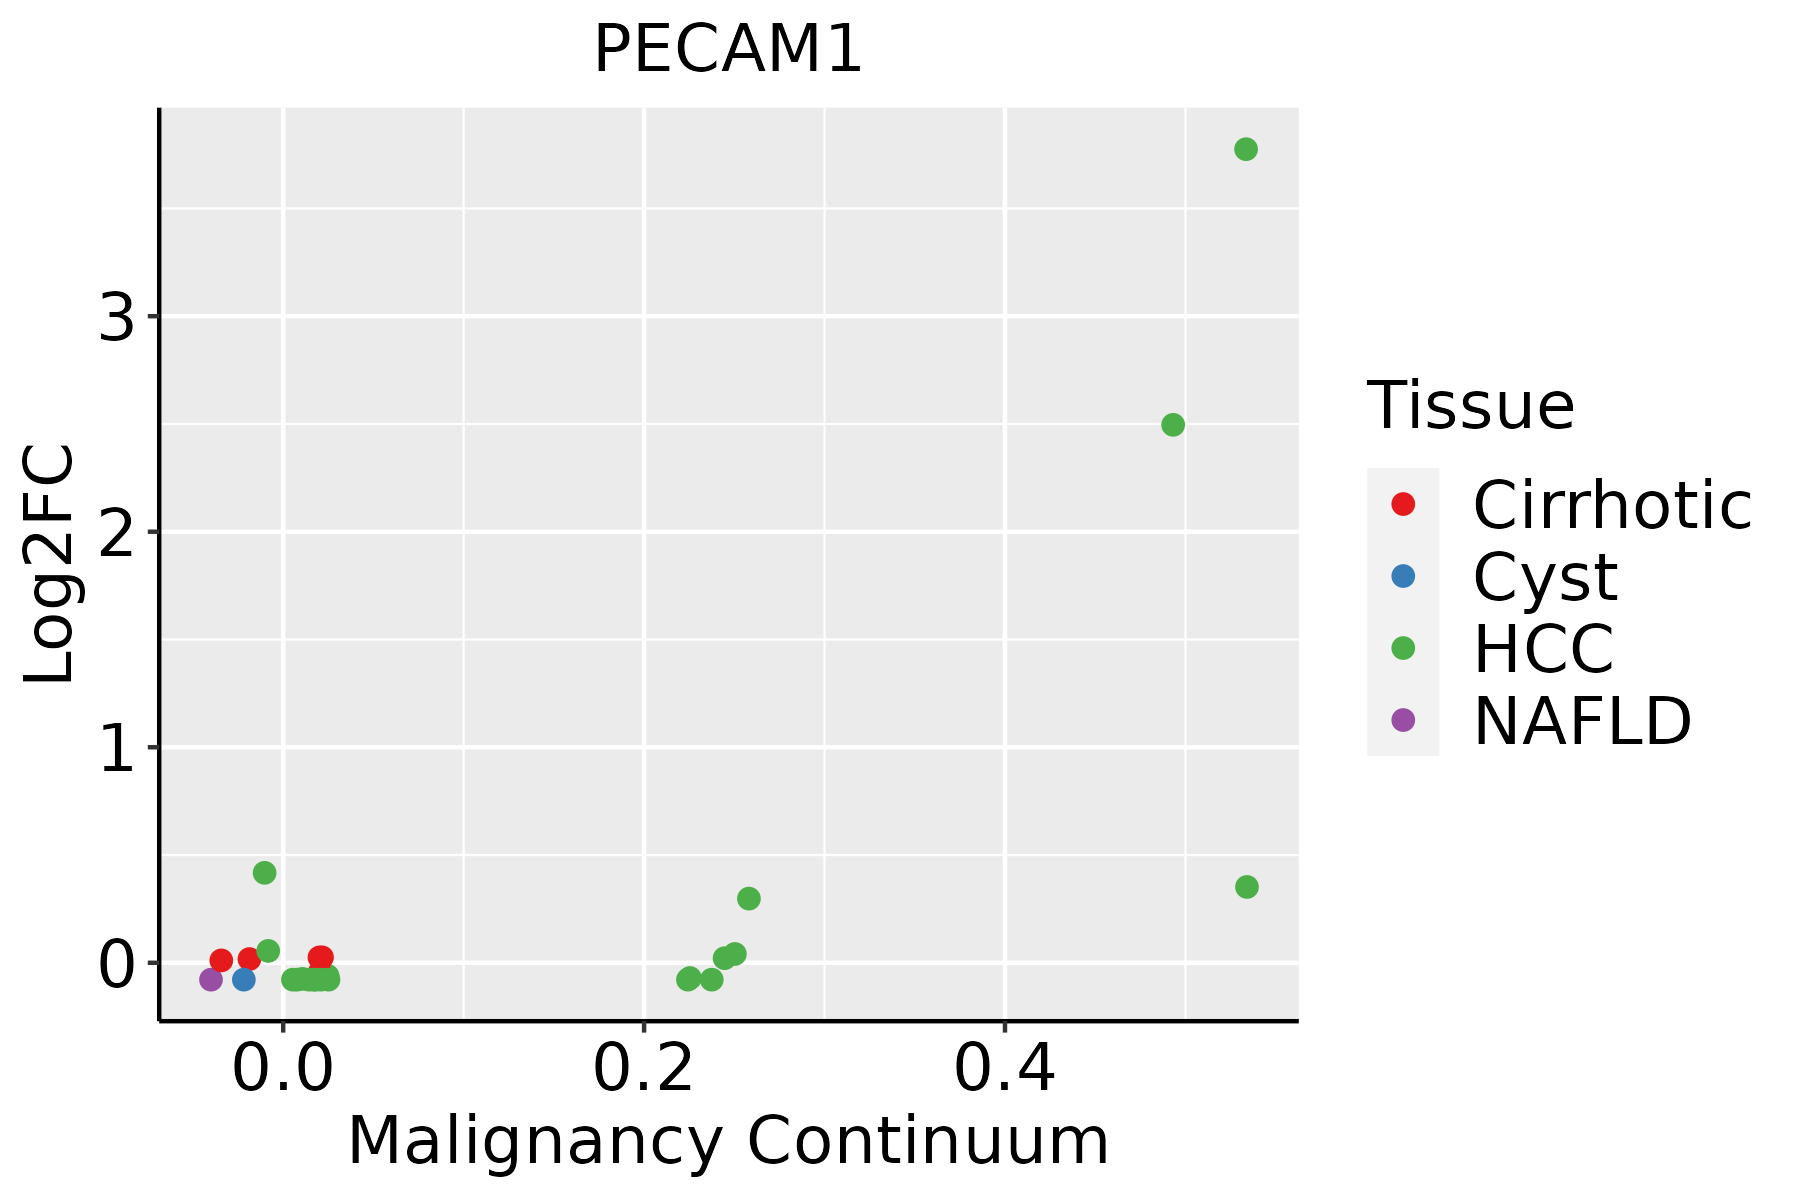 | HCC: Hepatocellular carcinoma |
| NAFLD: Non-alcoholic fatty liver disease |
| ∗log2FC in expression of this searched gene in stem-like cells from each diseased tissue sample relative to stem-like cells in normal samples in each tissue plotted against the malignancy continuum. Samples are colored based on if they are from different disease stage. |
Top |
Malignant transformation related pathway analysis |
| Find out the enriched GO biological processes and KEGG pathways involved in transition from healthy to precancer to cancer |
| Tissue | Disease Stage | Enriched GO biological Processes |
| Colorectum | AD |  |
| Colorectum | SER |  |
| Colorectum | MSS |  |
| Colorectum | MSI-H |  |
| Colorectum | FAP |  |
| ∗Top 15 enriched GO BP terms are showed in the bar plot of each disease state in each tissue. Each row represents a significant GO biological process which is colored according to the -log10(p.adjust). |
| Page: 1 2 3 4 5 6 7 8 9 |
| GO ID | Tissue | Disease Stage | Description | Gene Ratio | Bg Ratio | pvalue | p.adjust | Count |
| GO:000165512 | Endometrium | EEC | urogenital system development | 69/2168 | 338/18723 | 1.70e-06 | 5.18e-05 | 69 |
| GO:007200112 | Endometrium | EEC | renal system development | 63/2168 | 302/18723 | 2.24e-06 | 6.59e-05 | 63 |
| GO:003432914 | Endometrium | EEC | cell junction assembly | 79/2168 | 420/18723 | 8.37e-06 | 1.85e-04 | 79 |
| GO:000182212 | Endometrium | EEC | kidney development | 59/2168 | 293/18723 | 1.44e-05 | 2.87e-04 | 59 |
| GO:003563314 | Endometrium | EEC | maintenance of blood-brain barrier | 14/2168 | 35/18723 | 1.62e-05 | 3.14e-04 | 14 |
| GO:000315813 | Endometrium | EEC | endothelium development | 32/2168 | 136/18723 | 6.37e-05 | 9.48e-04 | 32 |
| GO:004521615 | Endometrium | EEC | cell-cell junction organization | 42/2168 | 200/18723 | 8.84e-05 | 1.25e-03 | 42 |
| GO:000206416 | Endometrium | EEC | epithelial cell development | 45/2168 | 220/18723 | 9.73e-05 | 1.35e-03 | 45 |
| GO:005090013 | Endometrium | EEC | leukocyte migration | 67/2168 | 369/18723 | 1.19e-04 | 1.59e-03 | 67 |
| GO:000715914 | Endometrium | EEC | leukocyte cell-cell adhesion | 67/2168 | 371/18723 | 1.41e-04 | 1.82e-03 | 67 |
| GO:000189415 | Endometrium | EEC | tissue homeostasis | 51/2168 | 268/18723 | 2.34e-04 | 2.75e-03 | 51 |
| GO:007207313 | Endometrium | EEC | kidney epithelium development | 30/2168 | 136/18723 | 3.55e-04 | 3.90e-03 | 30 |
| GO:006102814 | Endometrium | EEC | establishment of endothelial barrier | 14/2168 | 46/18723 | 4.90e-04 | 5.00e-03 | 14 |
| GO:000704315 | Endometrium | EEC | cell-cell junction assembly | 31/2168 | 146/18723 | 5.74e-04 | 5.72e-03 | 31 |
| GO:006024914 | Endometrium | EEC | anatomical structure homeostasis | 56/2168 | 314/18723 | 6.52e-04 | 6.35e-03 | 56 |
| GO:009752913 | Endometrium | EEC | myeloid leukocyte migration | 42/2168 | 220/18723 | 7.42e-04 | 7.02e-03 | 42 |
| GO:004329715 | Endometrium | EEC | apical junction assembly | 19/2168 | 78/18723 | 1.19e-03 | 1.00e-02 | 19 |
| GO:007200912 | Endometrium | EEC | nephron epithelium development | 24/2168 | 109/18723 | 1.36e-03 | 1.12e-02 | 24 |
| GO:007200612 | Endometrium | EEC | nephron development | 29/2168 | 142/18723 | 1.61e-03 | 1.28e-02 | 29 |
| GO:004544613 | Endometrium | EEC | endothelial cell differentiation | 25/2168 | 118/18723 | 1.93e-03 | 1.47e-02 | 25 |
| Page: 1 2 |
| Pathway ID | Tissue | Disease Stage | Description | Gene Ratio | Bg Ratio | pvalue | p.adjust | qvalue | Count |
| hsa0541827 | Endometrium | EEC | Fluid shear stress and atherosclerosis | 45/1237 | 139/8465 | 7.76e-08 | 1.22e-06 | 9.07e-07 | 45 |
| hsa0467027 | Endometrium | EEC | Leukocyte transendothelial migration | 36/1237 | 114/8465 | 2.97e-06 | 3.91e-05 | 2.91e-05 | 36 |
| hsa0541836 | Endometrium | EEC | Fluid shear stress and atherosclerosis | 45/1237 | 139/8465 | 7.76e-08 | 1.22e-06 | 9.07e-07 | 45 |
| hsa0467036 | Endometrium | EEC | Leukocyte transendothelial migration | 36/1237 | 114/8465 | 2.97e-06 | 3.91e-05 | 2.91e-05 | 36 |
| hsa0541842 | Liver | HCC | Fluid shear stress and atherosclerosis | 89/4020 | 139/8465 | 5.58e-05 | 2.88e-04 | 1.60e-04 | 89 |
| hsa0467042 | Liver | HCC | Leukocyte transendothelial migration | 68/4020 | 114/8465 | 5.79e-03 | 1.64e-02 | 9.15e-03 | 68 |
| hsa0541852 | Liver | HCC | Fluid shear stress and atherosclerosis | 89/4020 | 139/8465 | 5.58e-05 | 2.88e-04 | 1.60e-04 | 89 |
| hsa0467052 | Liver | HCC | Leukocyte transendothelial migration | 68/4020 | 114/8465 | 5.79e-03 | 1.64e-02 | 9.15e-03 | 68 |
| Page: 1 |
Top |
Cell-cell communication analysis |
| Identification of potential cell-cell interactions between two cell types and their ligand-receptor pairs for different disease states |
| Ligand | Receptor | LRpair | Pathway | Tissue | Disease Stage |
| PECAM1 | PECAM1 | PECAM1_PECAM1 | PECAM1 | Breast | ADJ |
| PECAM1 | PECAM1 | PECAM1_PECAM1 | PECAM1 | Breast | DCIS |
| PECAM1 | PECAM1 | PECAM1_PECAM1 | PECAM1 | Breast | Healthy |
| PECAM1 | PECAM1 | PECAM1_PECAM1 | PECAM1 | Breast | IDC |
| PECAM1 | PECAM1 | PECAM1_PECAM1 | PECAM1 | Breast | Precancer |
| PECAM1 | PECAM1 | PECAM1_PECAM1 | PECAM1 | Cervix | ADJ |
| PECAM1 | PECAM1 | PECAM1_PECAM1 | PECAM1 | Cervix | CC |
| PECAM1 | PECAM1 | PECAM1_PECAM1 | PECAM1 | Cervix | Healthy |
| PECAM1 | PECAM1 | PECAM1_PECAM1 | PECAM1 | Cervix | Precancer |
| PECAM1 | PECAM1 | PECAM1_PECAM1 | PECAM1 | CRC | AD |
| PECAM1 | PECAM1 | PECAM1_PECAM1 | PECAM1 | CRC | ADJ |
| PECAM1 | PECAM1 | PECAM1_PECAM1 | PECAM1 | CRC | CRC |
| PECAM1 | PECAM1 | PECAM1_PECAM1 | PECAM1 | CRC | FAP |
| PECAM1 | PECAM1 | PECAM1_PECAM1 | PECAM1 | CRC | MSI-H |
| PECAM1 | PECAM1 | PECAM1_PECAM1 | PECAM1 | CRC | MSS |
| PECAM1 | PECAM1 | PECAM1_PECAM1 | PECAM1 | CRC | SER |
| PECAM1 | PECAM1 | PECAM1_PECAM1 | PECAM1 | Endometrium | ADJ |
| PECAM1 | PECAM1 | PECAM1_PECAM1 | PECAM1 | Endometrium | AEH |
| PECAM1 | PECAM1 | PECAM1_PECAM1 | PECAM1 | Endometrium | EEC |
| PECAM1 | PECAM1 | PECAM1_PECAM1 | PECAM1 | Endometrium | Healthy |
| Page: 1 2 3 |
Top |
Single-cell gene regulatory network inference analysis |
| Find out the significant the regulons (TFs) and the target genes of each regulon across cell types for different disease states |
| TF | Cell Type | Tissue | Disease Stage | Target Gene | RSS | Regulon Activity |
| ∗The dot plots of a searched regulon are shown for all cell subpopulations in each disease state of each tissue based on the regulon specific score inferred using pySCENIC and by calculating the average expression. |
| Page: 1 |
Top |
Somatic mutation of malignant transformation related genes |
| Annotation of somatic variants for genes involved in malignant transformation |
| Hugo Symbol | Variant Class | Variant Classification | dbSNP RS | HGVSc | HGVSp | HGVSp Short | SWISSPROT | BIOTYPE | SIFT | PolyPhen | Tumor Sample Barcode | Tissue | Histology | Sex | Age | Stage | Therapy Types | Drugs | Outcome |
| PECAM1 | insertion | Frame_Shift_Ins | novel | c.1221dupG | p.Leu408AlafsTer9 | p.L408Afs*9 | protein_coding | TCGA-A7-A0D9-01 | Breast | breast invasive carcinoma | Female | <65 | I/II | Chemotherapy | taxotere | SD | |||
| PECAM1 | insertion | Nonsense_Mutation | novel | c.1219_1220insAAAAAAAGCGAGAGAAGTAG | p.Met407LysfsTer7 | p.M407Kfs*7 | protein_coding | TCGA-A7-A0D9-01 | Breast | breast invasive carcinoma | Female | <65 | I/II | Chemotherapy | taxotere | SD | |||
| PECAM1 | insertion | Frame_Shift_Ins | novel | c.1674_1675insTTCTTTTTCTCTCTTTTTCTGGGTATTCAATCTTCTGG | p.Lys559PhefsTer45 | p.K559Ffs*45 | protein_coding | TCGA-A8-A06O-01 | Breast | breast invasive carcinoma | Female | <65 | I/II | Hormone Therapy | letrozole | SD | |||
| PECAM1 | insertion | Frame_Shift_Ins | novel | c.1577_1578insAAAAAAAAAGAAAGAAAAAAAGAAAAAGACTACACAG | p.Asn526LysfsTer14 | p.N526Kfs*14 | protein_coding | TCGA-A8-A08T-01 | Breast | breast invasive carcinoma | Female | <65 | III/IV | Unknown | Unknown | PD | |||
| PECAM1 | insertion | Nonsense_Mutation | novel | c.147_148insTCATCTGCCTGGCATTTTCCTTACCTGAATACGTAAGCACTAGAC | p.Asn49_Gly50insSerSerAlaTrpHisPheProTyrLeuAsnThrTerAlaLeuAsp | p.N49_G50insSSAWHFPYLNT*ALD | protein_coding | TCGA-A8-A08Z-01 | Breast | breast invasive carcinoma | Female | >=65 | III/IV | Unknown | Unknown | SD | |||
| PECAM1 | SNV | Missense_Mutation | novel | c.1309N>C | p.Thr437Pro | p.T437P | protein_coding | deleterious(0) | probably_damaging(0.991) | TCGA-AA-3852-01 | Colorectum | colon adenocarcinoma | Male | >=65 | I/II | Unknown | Unknown | PD | |
| PECAM1 | SNV | Missense_Mutation | novel | c.548N>A | p.Ser183Tyr | p.S183Y | protein_coding | tolerated(0.15) | possibly_damaging(0.567) | TCGA-AA-3984-01 | Colorectum | colon adenocarcinoma | Female | <65 | I/II | Unknown | Unknown | SD | |
| PECAM1 | SNV | Missense_Mutation | novel | c.2168C>T | p.Ala723Val | p.A723V | protein_coding | tolerated(0.5) | benign(0.003) | TCGA-AA-A010-01 | Colorectum | colon adenocarcinoma | Female | <65 | I/II | Chemotherapy | folinic | CR | |
| PECAM1 | SNV | Missense_Mutation | novel | c.1222N>T | p.Leu408Phe | p.L408F | protein_coding | deleterious(0.01) | probably_damaging(0.964) | TCGA-AD-6895-01 | Colorectum | colon adenocarcinoma | Male | >=65 | III/IV | Unknown | Unknown | SD | |
| PECAM1 | SNV | Missense_Mutation | novel | c.1141N>G | p.Ser381Gly | p.S381G | protein_coding | deleterious(0) | benign(0.07) | TCGA-AD-6964-01 | Colorectum | colon adenocarcinoma | Male | <65 | III/IV | Chemotherapy | folfox | PD |
| Page: 1 2 3 4 5 6 |
Top |
Related drugs of malignant transformation related genes |
| Identification of chemicals and drugs interact with genes involved in malignant transfromation |
| (DGIdb 4.0) |
| Entrez ID | Symbol | Category | Interaction Types | Drug Claim Name | Drug Name | PMIDs |
| 5175 | PECAM1 | NA | RESVERATROL | RESVERATROL | 15041740 |
| Page: 1 |

Copyright 2023-Present -The University of Texas Health Science Center at Houston |