
|
|||||
|
 | |
| |
| |
| |
| |
| |
|
Gene: PEBP4 |
Gene summary for PEBP4 |
| Gene information | Species | Human | Gene symbol | PEBP4 | Gene ID | 157310 |
| Gene name | phosphatidylethanolamine binding protein 4 | |
| Gene Alias | CORK-1 | |
| Cytomap | 8p21.3 | |
| Gene Type | protein-coding | GO ID | GO:0005575 | UniProtAcc | Q96S96 |
Top |
Malignant transformation analysis |
| Identification of the aberrant gene expression in precancerous and cancerous lesions by comparing the gene expression of stem-like cells in diseased tissues with normal stem cells |
| Entrez ID | Symbol | Replicates | Species | Organ | Tissue | Adj P-value | Log2FC | Malignancy |
| 157310 | PEBP4 | TD9 | Human | Lung | IAC | 3.90e-02 | -6.60e-02 | 0.088 |
| 157310 | PEBP4 | RNA-P25T1-P25T1-1 | Human | Lung | AIS | 1.31e-16 | 8.26e-01 | -0.2116 |
| 157310 | PEBP4 | RNA-P25T1-P25T1-2 | Human | Lung | AIS | 9.54e-06 | 7.06e-01 | -0.1941 |
| 157310 | PEBP4 | RNA-P25T1-P25T1-3 | Human | Lung | AIS | 1.21e-07 | 6.71e-01 | -0.2107 |
| 157310 | PEBP4 | RNA-P25T1-P25T1-4 | Human | Lung | AIS | 2.76e-11 | 7.99e-01 | -0.2119 |
| 157310 | PEBP4 | RNA-P6T2-P6T2-1 | Human | Lung | IAC | 1.17e-02 | -4.07e-02 | -0.0166 |
| 157310 | PEBP4 | RNA-P6T2-P6T2-2 | Human | Lung | IAC | 2.97e-11 | 2.06e-02 | -0.0132 |
| 157310 | PEBP4 | RNA-P6T2-P6T2-3 | Human | Lung | IAC | 2.86e-12 | 1.30e-01 | -0.013 |
| 157310 | PEBP4 | RNA-P6T2-P6T2-4 | Human | Lung | IAC | 1.15e-05 | 4.91e-02 | -0.0121 |
| 157310 | PEBP4 | Adj_PTCwithHT_6 | Human | Thyroid | HT | 1.77e-04 | -3.27e-01 | 0.02 |
| 157310 | PEBP4 | PTCwithHT_6 | Human | Thyroid | HT | 1.93e-02 | -2.79e-01 | 0.02 |
| 157310 | PEBP4 | PTCwithHT_8 | Human | Thyroid | HT | 8.20e-04 | -2.95e-01 | 0.0351 |
| 157310 | PEBP4 | PTCwithoutHT_2 | Human | Thyroid | PTC | 4.56e-05 | -3.23e-01 | 0.0419 |
| 157310 | PEBP4 | male-WTA | Human | Thyroid | PTC | 5.82e-08 | -3.00e-01 | 0.1037 |
| 157310 | PEBP4 | PTC01 | Human | Thyroid | PTC | 9.78e-13 | -1.54e-01 | 0.1899 |
| 157310 | PEBP4 | PTC06 | Human | Thyroid | PTC | 4.14e-15 | -6.11e-02 | 0.2057 |
| 157310 | PEBP4 | PTC07 | Human | Thyroid | PTC | 2.92e-16 | -9.88e-02 | 0.2044 |
| 157310 | PEBP4 | ATC12 | Human | Thyroid | ATC | 2.86e-09 | -3.12e-01 | 0.34 |
| 157310 | PEBP4 | ATC13 | Human | Thyroid | ATC | 7.34e-08 | -3.33e-01 | 0.34 |
| 157310 | PEBP4 | ATC4 | Human | Thyroid | ATC | 1.19e-08 | -3.01e-01 | 0.34 |
| Page: 1 2 |
| Tissue | Expression Dynamics | Abbreviation |
| Lung | 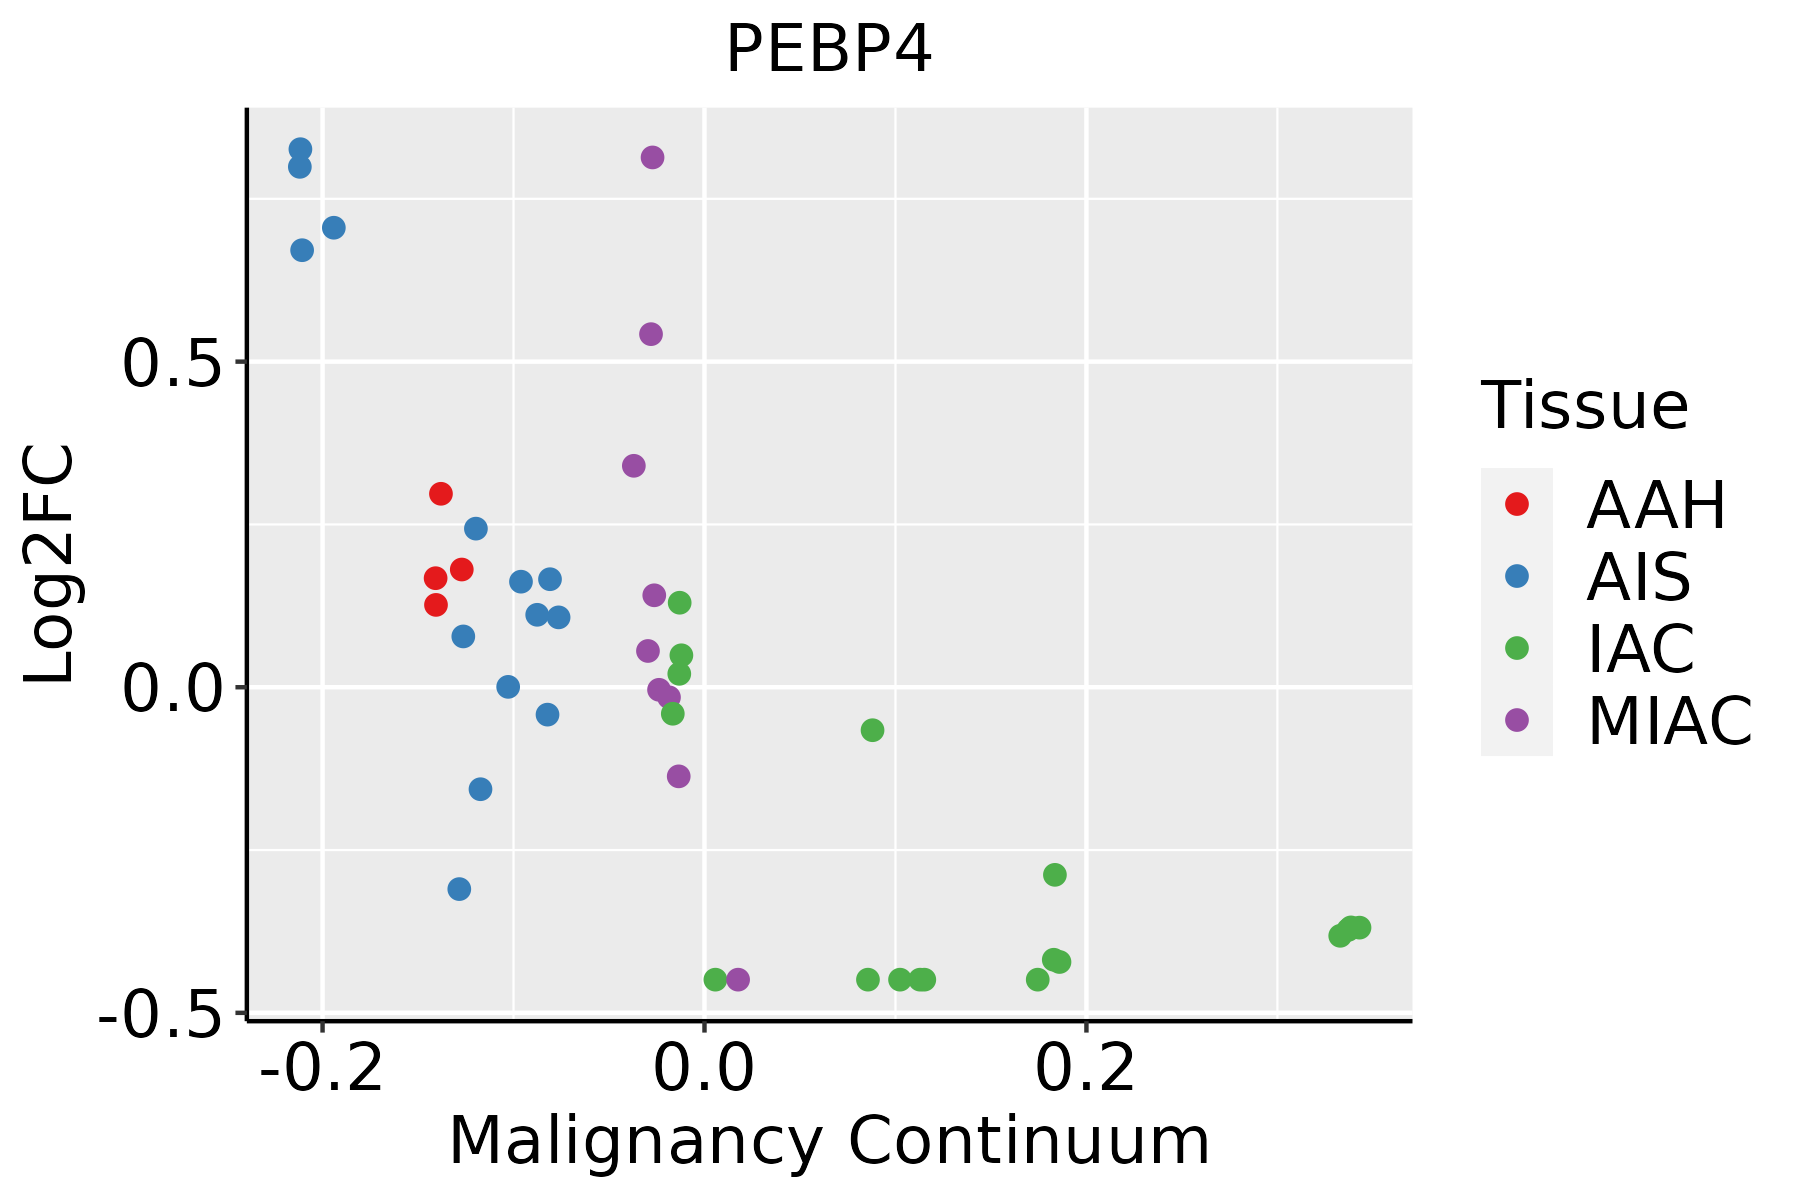 | AAH: Atypical adenomatous hyperplasia |
| AIS: Adenocarcinoma in situ | ||
| IAC: Invasive lung adenocarcinoma | ||
| MIA: Minimally invasive adenocarcinoma | ||
| Thyroid |  | ATC: Anaplastic thyroid cancer |
| HT: Hashimoto's thyroiditis | ||
| PTC: Papillary thyroid cancer |
| ∗log2FC in expression of this searched gene in stem-like cells from each diseased tissue sample relative to stem-like cells in normal samples in each tissue plotted against the malignancy continuum. Samples are colored based on if they are from different disease stage. |
Top |
Malignant transformation related pathway analysis |
| Find out the enriched GO biological processes and KEGG pathways involved in transition from healthy to precancer to cancer |
| Tissue | Disease Stage | Enriched GO biological Processes |
| Colorectum | AD |  |
| Colorectum | SER |  |
| Colorectum | MSS |  |
| Colorectum | MSI-H |  |
| Colorectum | FAP |  |
| ∗Top 15 enriched GO BP terms are showed in the bar plot of each disease state in each tissue. Each row represents a significant GO biological process which is colored according to the -log10(p.adjust). |
| Page: 1 2 3 4 5 6 7 8 9 |
| GO ID | Tissue | Disease Stage | Description | Gene Ratio | Bg Ratio | pvalue | p.adjust | Count |
| Page: 1 |
| Pathway ID | Tissue | Disease Stage | Description | Gene Ratio | Bg Ratio | pvalue | p.adjust | qvalue | Count |
| Page: 1 |
Top |
Cell-cell communication analysis |
| Identification of potential cell-cell interactions between two cell types and their ligand-receptor pairs for different disease states |
| Ligand | Receptor | LRpair | Pathway | Tissue | Disease Stage |
| Page: 1 |
Top |
Single-cell gene regulatory network inference analysis |
| Find out the significant the regulons (TFs) and the target genes of each regulon across cell types for different disease states |
| TF | Cell Type | Tissue | Disease Stage | Target Gene | RSS | Regulon Activity |
| ∗The dot plots of a searched regulon are shown for all cell subpopulations in each disease state of each tissue based on the regulon specific score inferred using pySCENIC and by calculating the average expression. |
| Page: 1 |
Top |
Somatic mutation of malignant transformation related genes |
| Annotation of somatic variants for genes involved in malignant transformation |
| Hugo Symbol | Variant Class | Variant Classification | dbSNP RS | HGVSc | HGVSp | HGVSp Short | SWISSPROT | BIOTYPE | SIFT | PolyPhen | Tumor Sample Barcode | Tissue | Histology | Sex | Age | Stage | Therapy Types | Drugs | Outcome |
| PEBP4 | SNV | Missense_Mutation | novel | c.471N>C | p.Gln157His | p.Q157H | Q96S96 | protein_coding | deleterious(0) | probably_damaging(0.995) | TCGA-5L-AAT1-01 | Breast | breast invasive carcinoma | Female | <65 | III/IV | Hormone Therapy | letrozol | SD |
| PEBP4 | SNV | Missense_Mutation | rs766153957 | c.262N>A | p.Ala88Thr | p.A88T | Q96S96 | protein_coding | tolerated(0.2) | benign(0.23) | TCGA-2W-A8YY-01 | Cervix | cervical & endocervical cancer | Female | <65 | I/II | Chemotherapy | cisplatin | CR |
| PEBP4 | SNV | Missense_Mutation | c.430N>T | p.His144Tyr | p.H144Y | Q96S96 | protein_coding | tolerated(0.26) | benign(0.15) | TCGA-EA-A4BA-01 | Cervix | cervical & endocervical cancer | Female | <65 | I/II | Chemotherapy | carboplatin | CR | |
| PEBP4 | SNV | Missense_Mutation | c.440T>G | p.Phe147Cys | p.F147C | Q96S96 | protein_coding | deleterious(0) | possibly_damaging(0.87) | TCGA-AA-3864-01 | Colorectum | colon adenocarcinoma | Male | >=65 | I/II | Unknown | Unknown | SD | |
| PEBP4 | SNV | Missense_Mutation | novel | c.651G>T | p.Lys217Asn | p.K217N | Q96S96 | protein_coding | deleterious_low_confidence(0.04) | benign(0.298) | TCGA-CK-6746-01 | Colorectum | colon adenocarcinoma | Female | >=65 | I/II | Unknown | Unknown | SD |
| PEBP4 | SNV | Missense_Mutation | rs766153957 | c.262G>A | p.Ala88Thr | p.A88T | Q96S96 | protein_coding | tolerated(0.2) | benign(0.23) | TCGA-D5-6530-01 | Colorectum | colon adenocarcinoma | Male | <65 | I/II | Unknown | Unknown | SD |
| PEBP4 | SNV | Missense_Mutation | c.260N>A | p.Gly87Asp | p.G87D | Q96S96 | protein_coding | tolerated(0.69) | benign(0.005) | TCGA-D5-6927-01 | Colorectum | colon adenocarcinoma | Male | <65 | I/II | Unknown | Unknown | SD | |
| PEBP4 | SNV | Missense_Mutation | c.406N>C | p.Tyr136His | p.Y136H | Q96S96 | protein_coding | deleterious(0) | probably_damaging(0.998) | TCGA-B5-A11G-01 | Endometrium | uterine corpus endometrioid carcinoma | Female | >=65 | I/II | Unknown | Unknown | SD | |
| PEBP4 | SNV | Missense_Mutation | novel | c.147N>A | p.Phe49Leu | p.F49L | Q96S96 | protein_coding | tolerated(0.39) | benign(0.003) | TCGA-BK-A6W3-01 | Endometrium | uterine corpus endometrioid carcinoma | Female | <65 | I/II | Unknown | Unknown | SD |
| PEBP4 | SNV | Missense_Mutation | novel | c.163N>G | p.Asn55Asp | p.N55D | Q96S96 | protein_coding | tolerated(0.53) | benign(0.003) | TCGA-E6-A1LX-01 | Endometrium | uterine corpus endometrioid carcinoma | Female | <65 | I/II | Unknown | Unknown | SD |
| Page: 1 2 |
Top |
Related drugs of malignant transformation related genes |
| Identification of chemicals and drugs interact with genes involved in malignant transfromation |
| (DGIdb 4.0) |
| Entrez ID | Symbol | Category | Interaction Types | Drug Claim Name | Drug Name | PMIDs |
| 157310 | PEBP4 | DRUGGABLE GENOME | methylphenidate | METHYLPHENIDATE | 29382897 |
| Page: 1 |

Copyright 2023-Present -The University of Texas Health Science Center at Houston |