
|
|||||
|
 | |
| |
| |
| |
| |
| |
|
Gene: PEBP1 |
Gene summary for PEBP1 |
| Gene information | Species | Human | Gene symbol | PEBP1 | Gene ID | 5037 |
| Gene name | phosphatidylethanolamine binding protein 1 | |
| Gene Alias | HCNP | |
| Cytomap | 12q24.23 | |
| Gene Type | protein-coding | GO ID | GO:0000165 | UniProtAcc | D9IAI1 |
Top |
Malignant transformation analysis |
| Identification of the aberrant gene expression in precancerous and cancerous lesions by comparing the gene expression of stem-like cells in diseased tissues with normal stem cells |
| Entrez ID | Symbol | Replicates | Species | Organ | Tissue | Adj P-value | Log2FC | Malignancy |
| 5037 | PEBP1 | GSM4909280 | Human | Breast | Precancer | 1.18e-03 | -6.69e-01 | 0.0305 |
| 5037 | PEBP1 | GSM4909281 | Human | Breast | IDC | 2.33e-18 | 4.55e-01 | 0.21 |
| 5037 | PEBP1 | GSM4909285 | Human | Breast | IDC | 1.25e-02 | 2.41e-01 | 0.21 |
| 5037 | PEBP1 | GSM4909286 | Human | Breast | IDC | 2.75e-23 | 5.05e-01 | 0.1081 |
| 5037 | PEBP1 | GSM4909288 | Human | Breast | IDC | 4.24e-03 | 1.39e-01 | 0.0988 |
| 5037 | PEBP1 | GSM4909289 | Human | Breast | IDC | 1.93e-07 | 4.84e-01 | 0.1064 |
| 5037 | PEBP1 | GSM4909293 | Human | Breast | IDC | 3.37e-06 | 3.13e-01 | 0.1581 |
| 5037 | PEBP1 | GSM4909294 | Human | Breast | IDC | 7.05e-44 | 4.47e-01 | 0.2022 |
| 5037 | PEBP1 | GSM4909296 | Human | Breast | IDC | 5.13e-16 | -5.09e-02 | 0.1524 |
| 5037 | PEBP1 | GSM4909297 | Human | Breast | IDC | 3.71e-28 | 1.67e-02 | 0.1517 |
| 5037 | PEBP1 | GSM4909298 | Human | Breast | IDC | 4.12e-05 | 3.17e-01 | 0.1551 |
| 5037 | PEBP1 | GSM4909301 | Human | Breast | IDC | 2.75e-07 | 2.46e-01 | 0.1577 |
| 5037 | PEBP1 | GSM4909302 | Human | Breast | IDC | 7.19e-03 | 8.88e-03 | 0.1545 |
| 5037 | PEBP1 | GSM4909303 | Human | Breast | IDC | 2.83e-02 | 3.37e-01 | 0.0438 |
| 5037 | PEBP1 | GSM4909304 | Human | Breast | IDC | 1.28e-05 | 3.20e-01 | 0.1636 |
| 5037 | PEBP1 | GSM4909305 | Human | Breast | IDC | 5.04e-07 | 3.61e-01 | 0.0436 |
| 5037 | PEBP1 | GSM4909306 | Human | Breast | IDC | 9.58e-25 | 5.06e-01 | 0.1564 |
| 5037 | PEBP1 | GSM4909307 | Human | Breast | IDC | 9.01e-13 | 3.46e-01 | 0.1569 |
| 5037 | PEBP1 | GSM4909308 | Human | Breast | IDC | 1.94e-23 | 5.08e-01 | 0.158 |
| 5037 | PEBP1 | GSM4909309 | Human | Breast | IDC | 5.25e-09 | 2.25e-01 | 0.0483 |
| Page: 1 2 3 4 5 6 7 8 9 10 11 12 13 14 15 16 17 |
| Tissue | Expression Dynamics | Abbreviation |
| Breast |  | IDC: Invasive ductal carcinoma |
| DCIS: Ductal carcinoma in situ | ||
| Precancer(BRCA1-mut): Precancerous lesion from BRCA1 mutation carriers | ||
| Cervix | 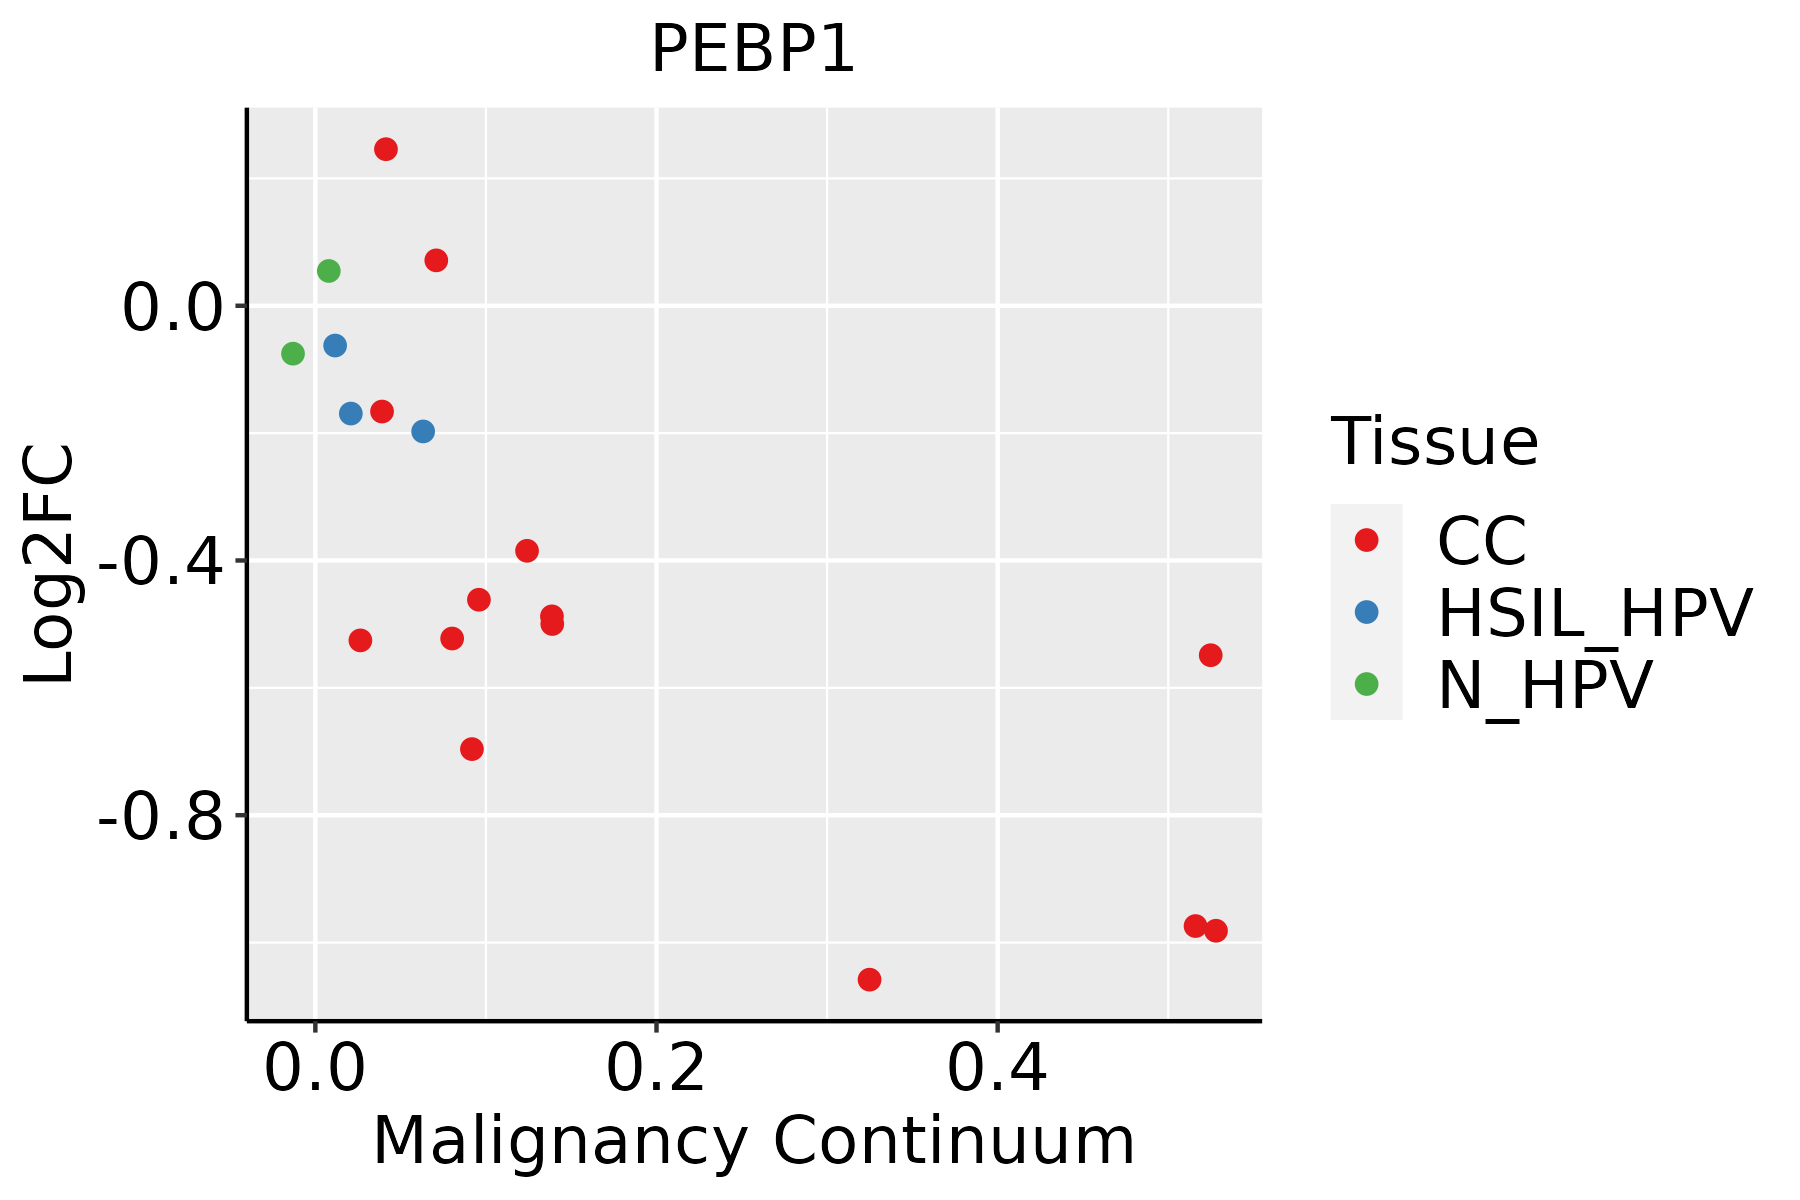 | CC: Cervix cancer |
| HSIL_HPV: HPV-infected high-grade squamous intraepithelial lesions | ||
| N_HPV: HPV-infected normal cervix | ||
| Colorectum (GSE201348) |  | FAP: Familial adenomatous polyposis |
| CRC: Colorectal cancer | ||
| Colorectum (HTA11) |  | AD: Adenomas |
| SER: Sessile serrated lesions | ||
| MSI-H: Microsatellite-high colorectal cancer | ||
| MSS: Microsatellite stable colorectal cancer | ||
| Endometrium | 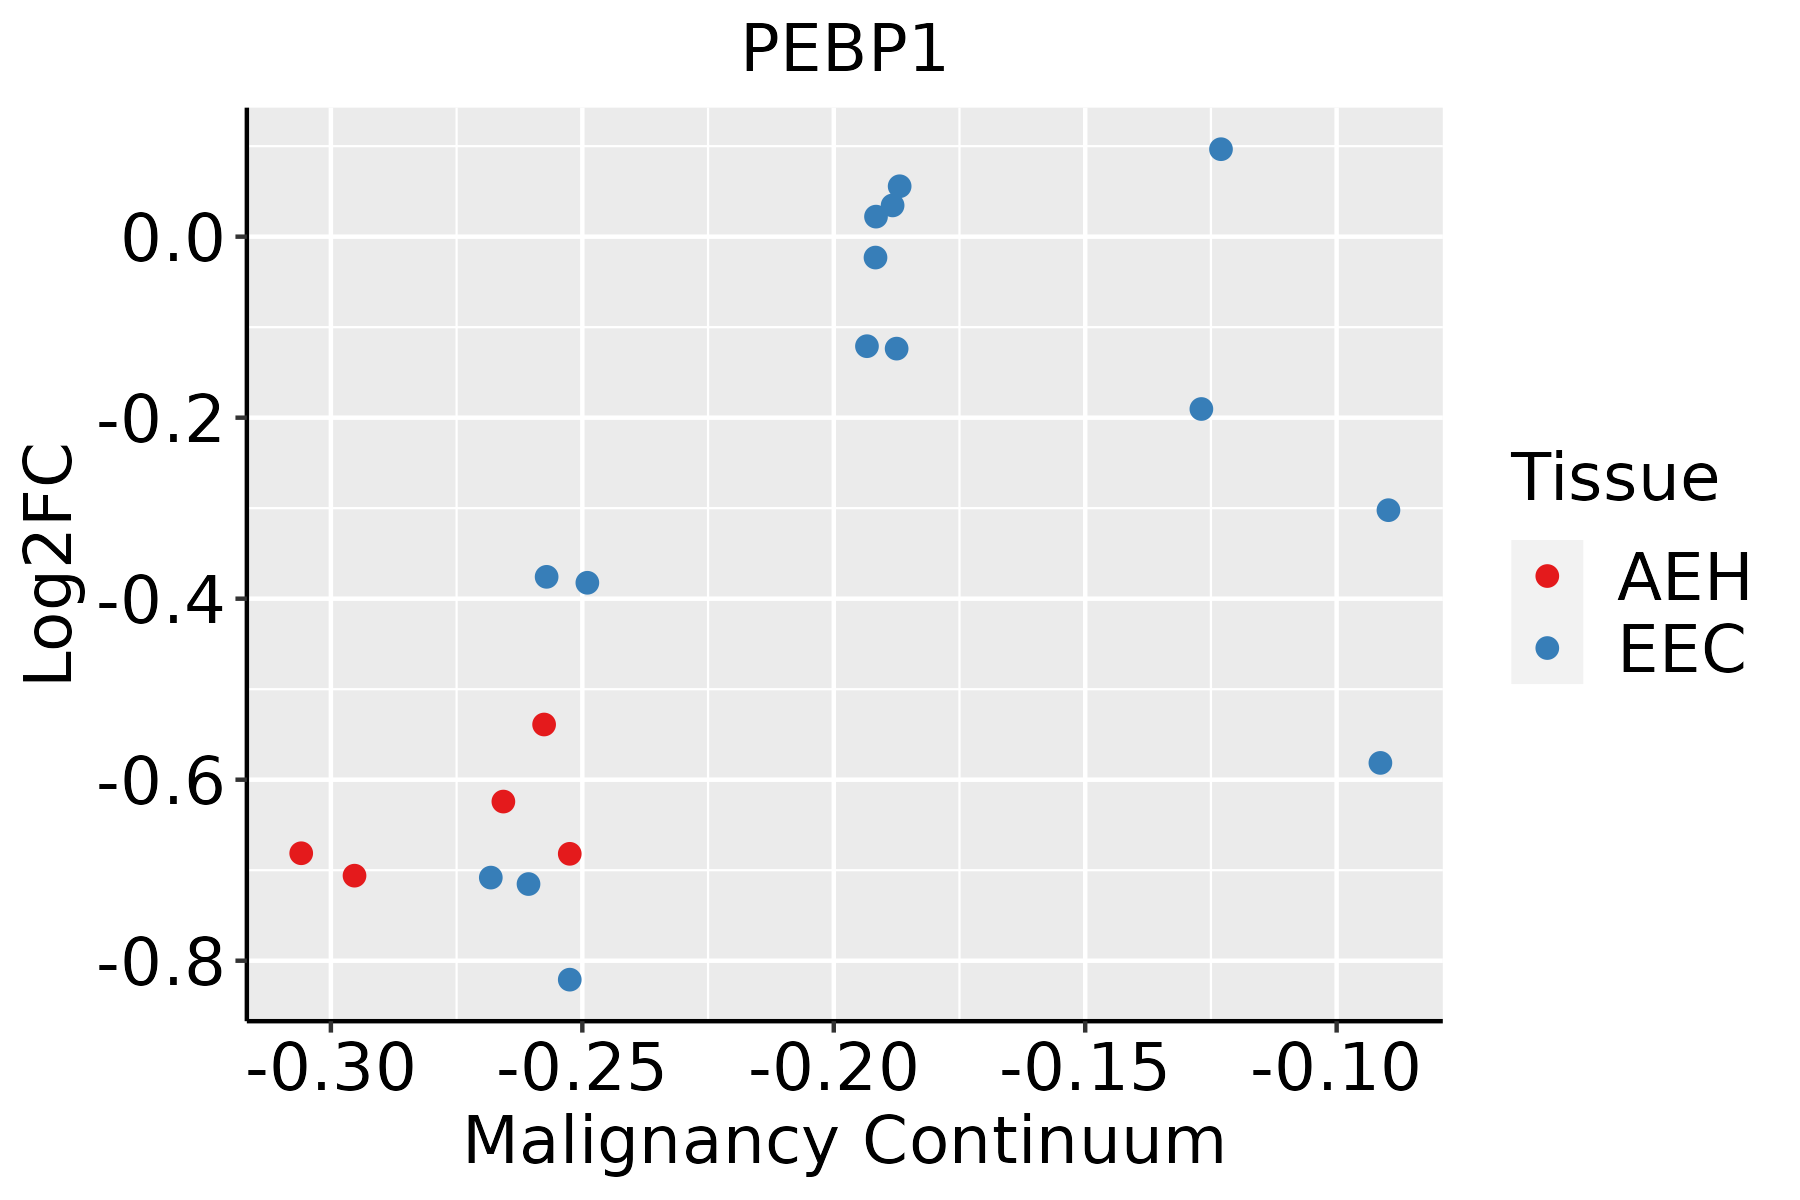 | AEH: Atypical endometrial hyperplasia |
| EEC: Endometrioid Cancer | ||
| Esophagus |  | ESCC: Esophageal squamous cell carcinoma |
| HGIN: High-grade intraepithelial neoplasias | ||
| LGIN: Low-grade intraepithelial neoplasias | ||
| GC | 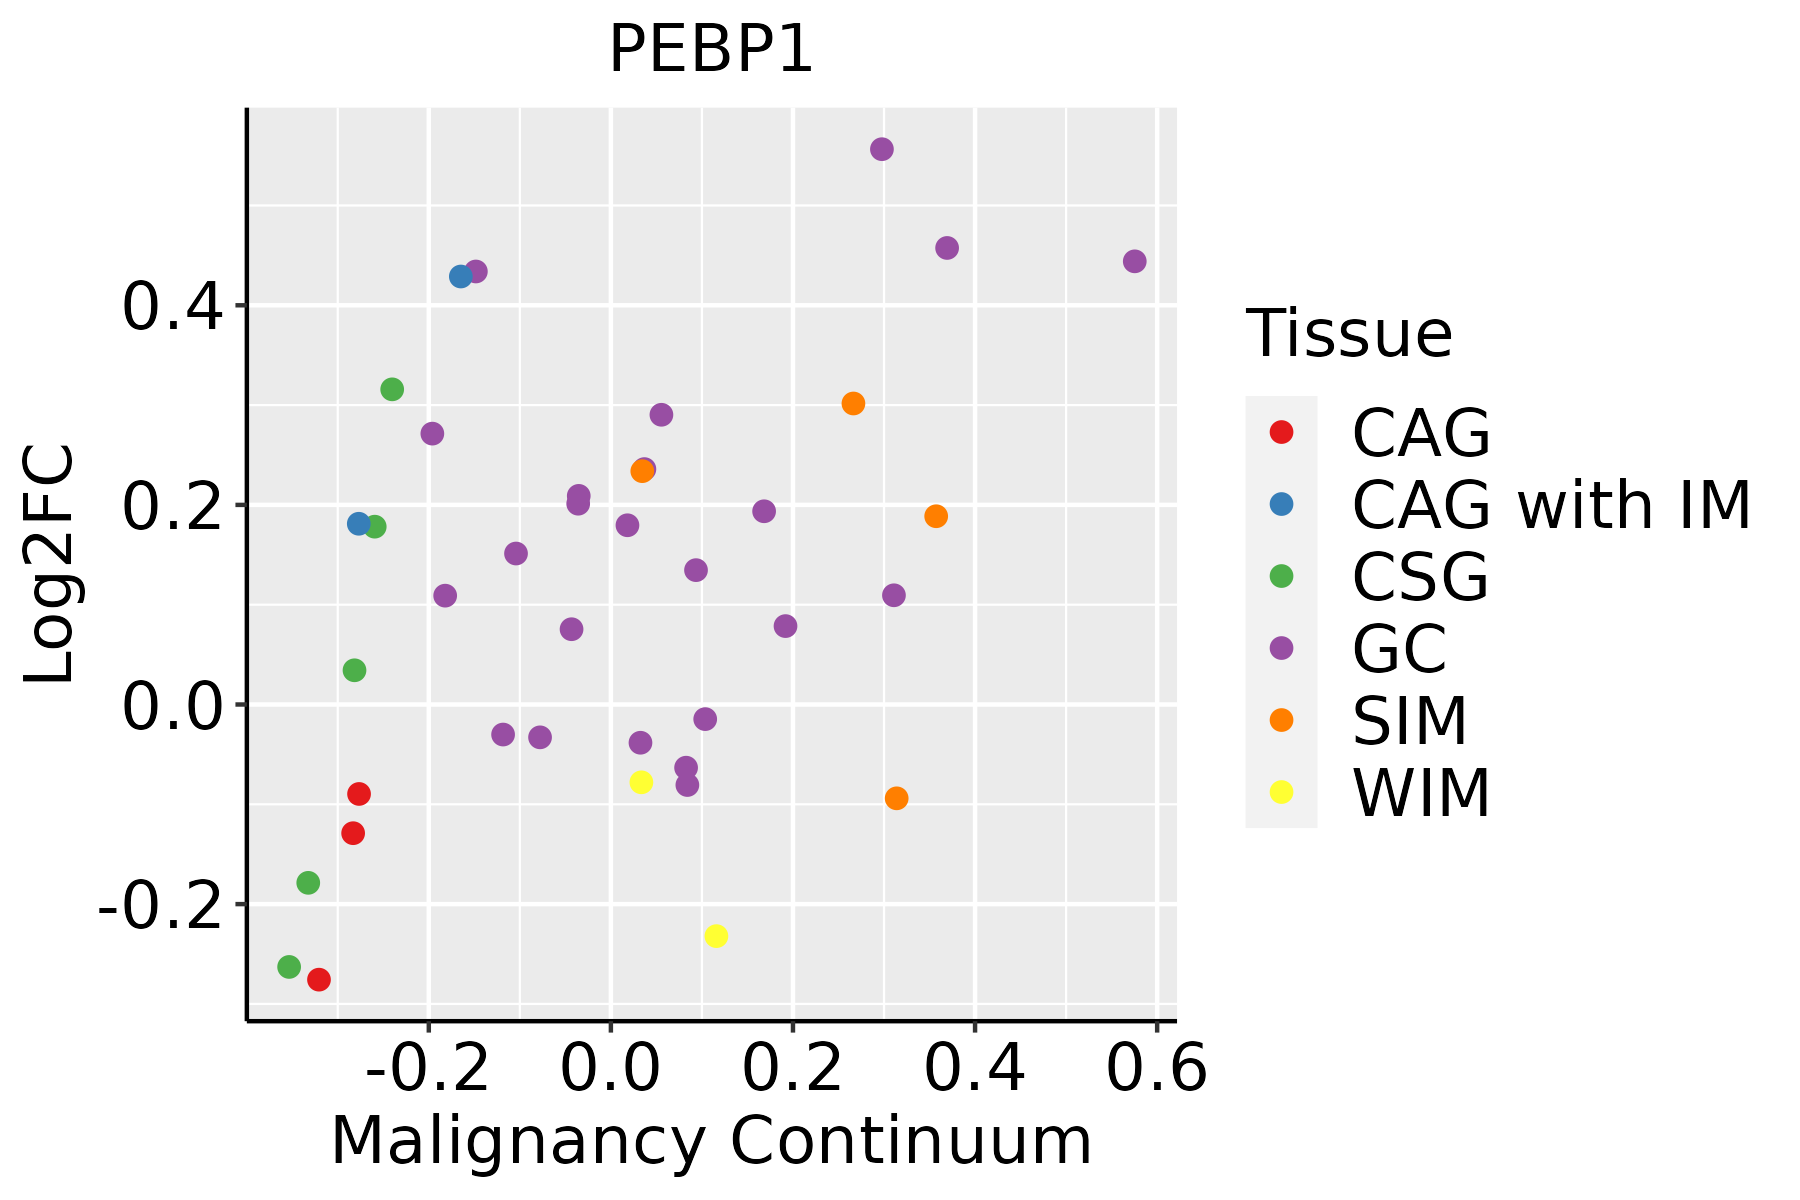 | CAG: Chronic atrophic gastritis |
| CAG with IM: Chronic atrophic gastritis with intestinal metaplasia | ||
| CSG: Chronic superficial gastritis | ||
| GC: Gastric cancer | ||
| SIM: Severe intestinal metaplasia | ||
| WIM: Wild intestinal metaplasia | ||
| Liver | 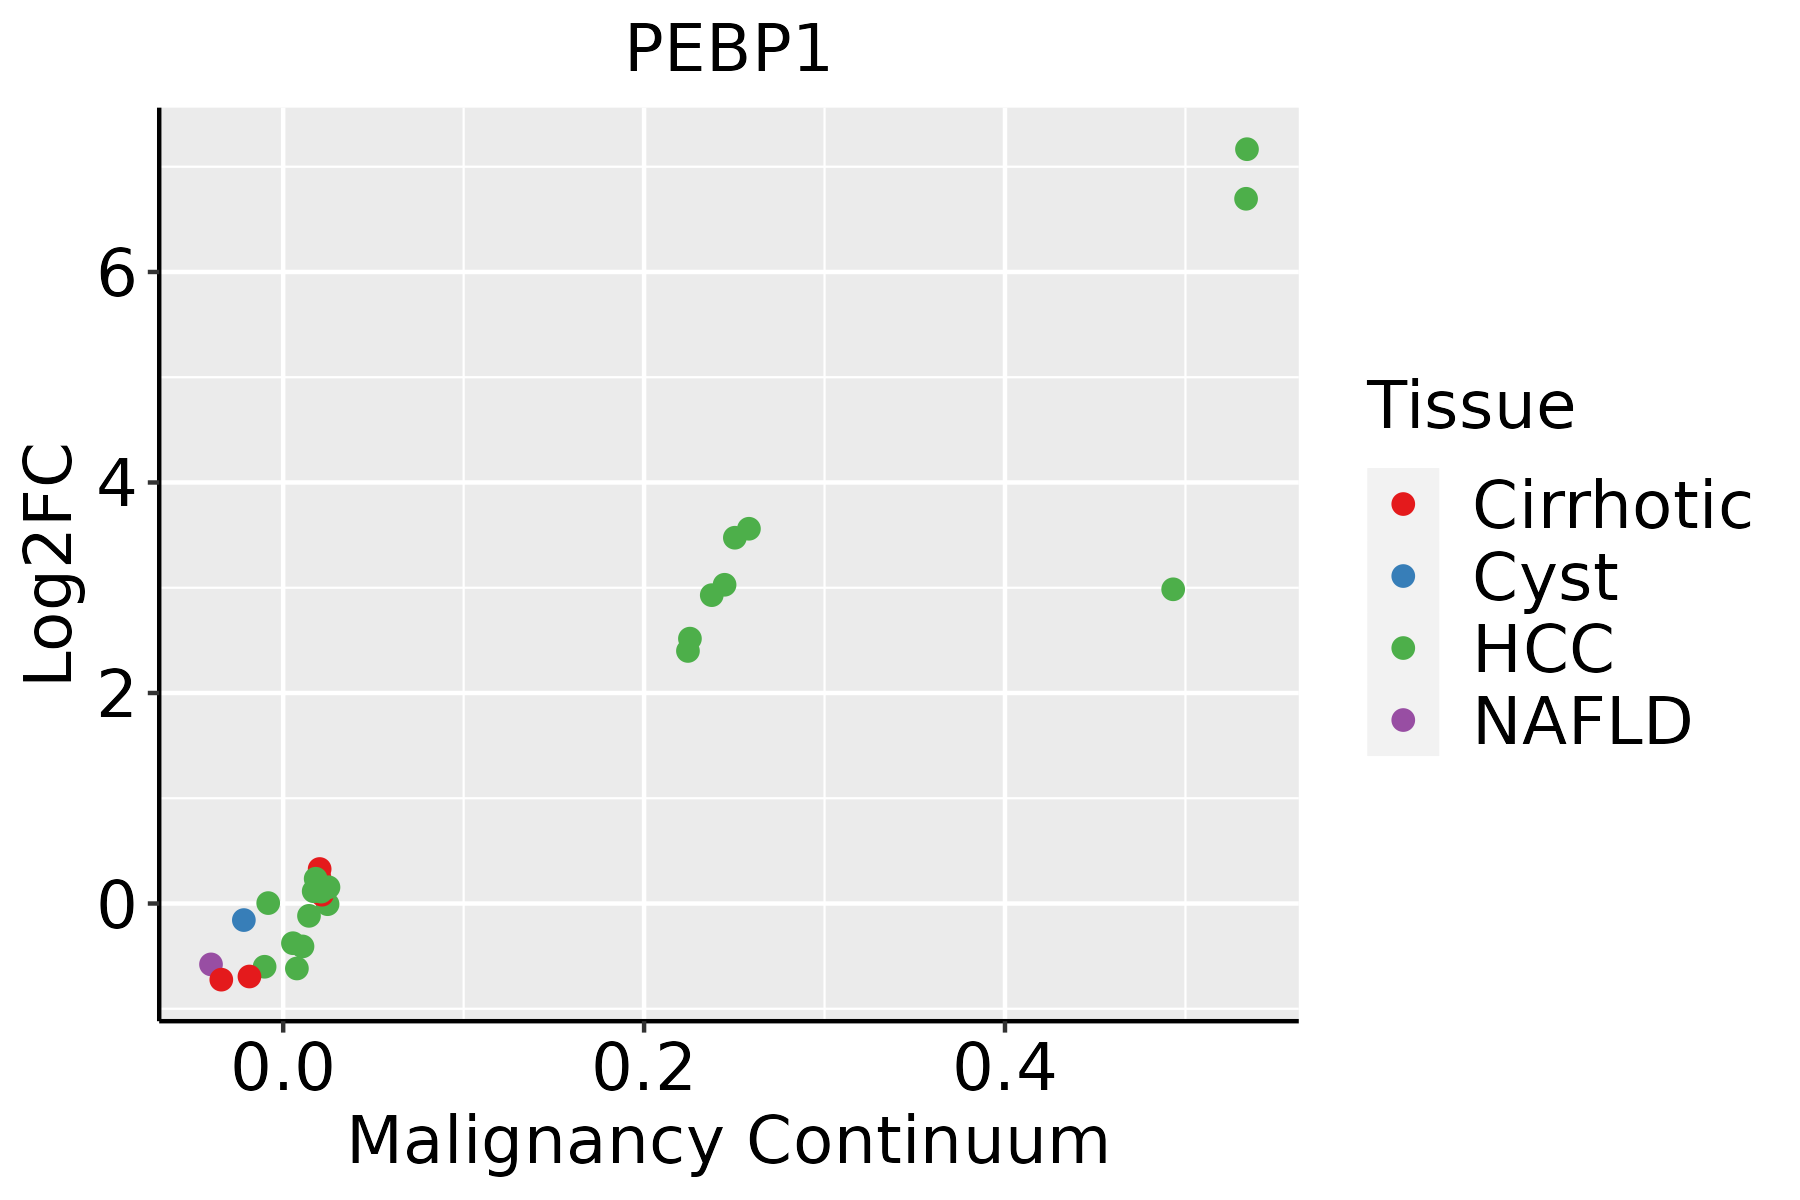 | HCC: Hepatocellular carcinoma |
| NAFLD: Non-alcoholic fatty liver disease | ||
| Lung | 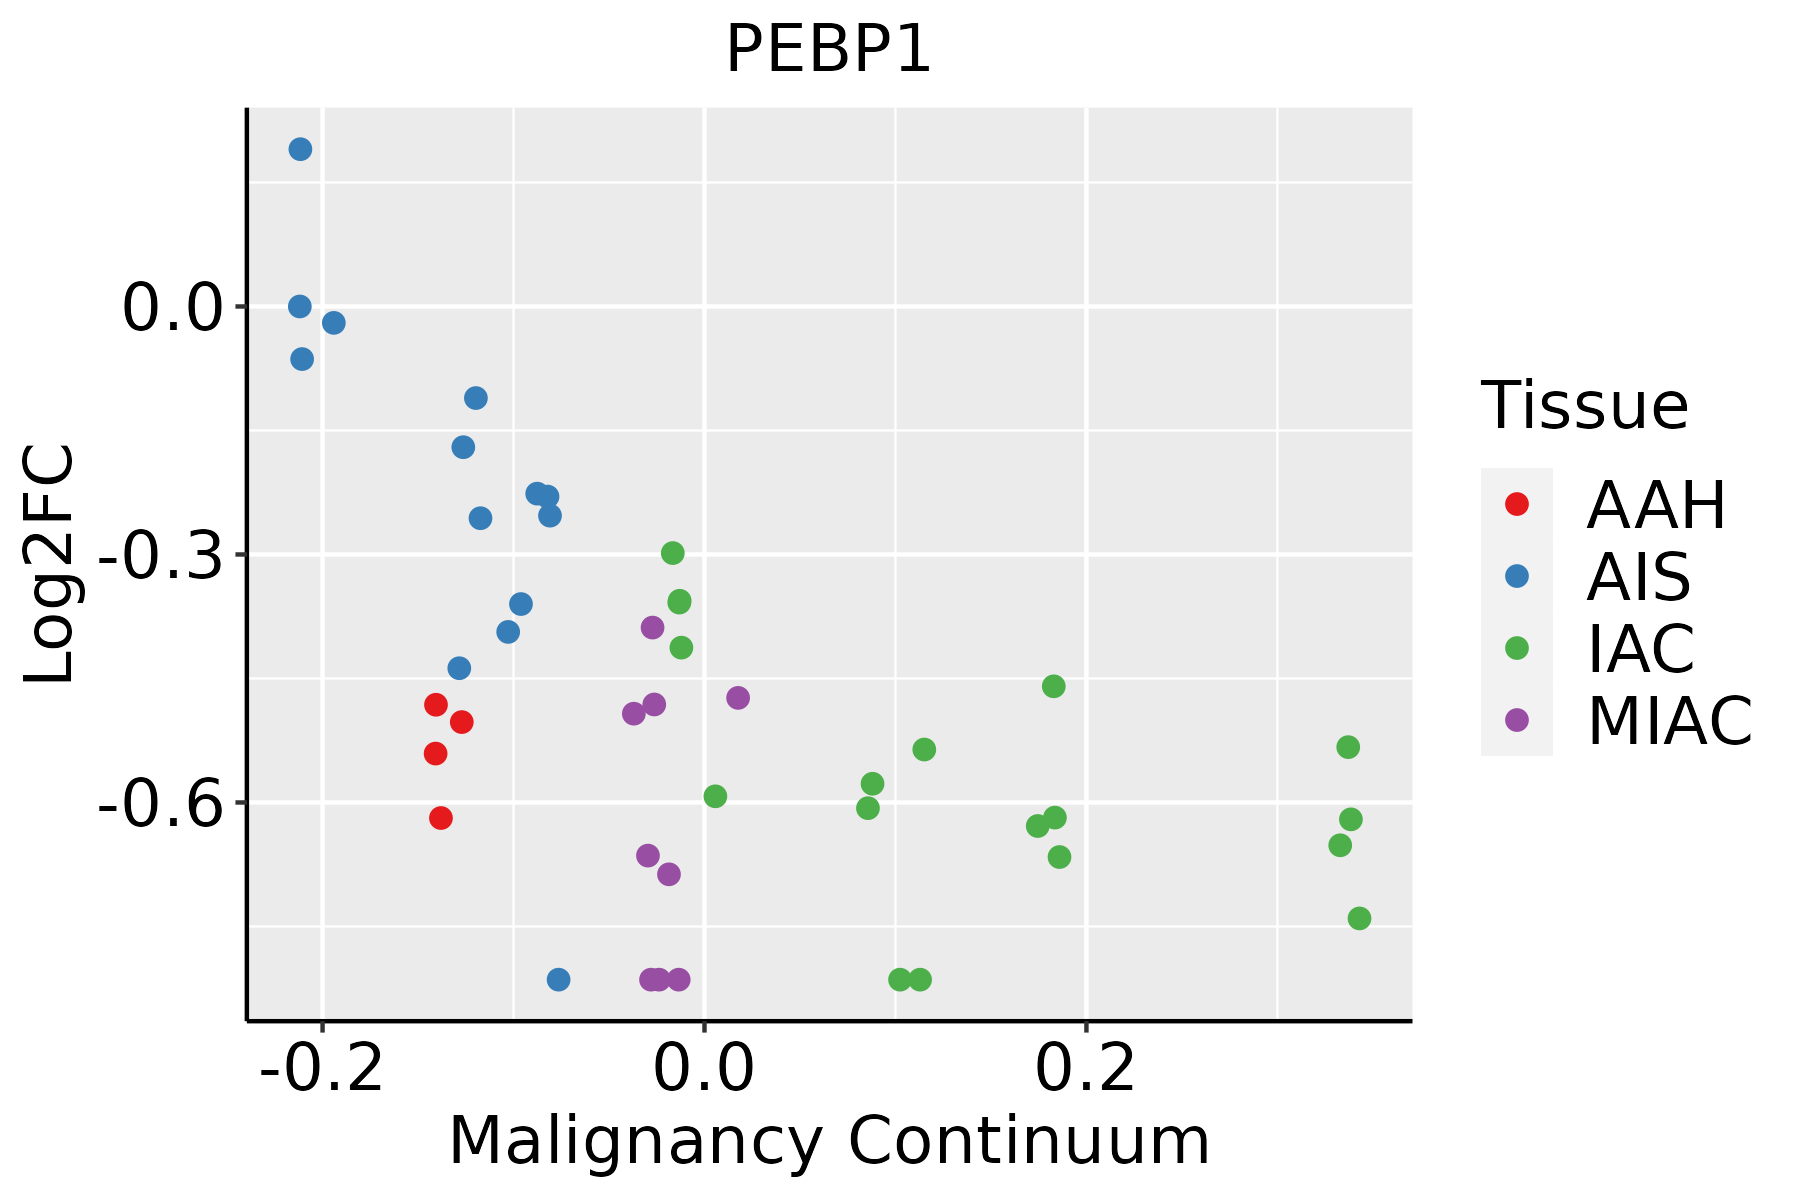 | AAH: Atypical adenomatous hyperplasia |
| AIS: Adenocarcinoma in situ | ||
| IAC: Invasive lung adenocarcinoma | ||
| MIA: Minimally invasive adenocarcinoma | ||
| Oral Cavity | 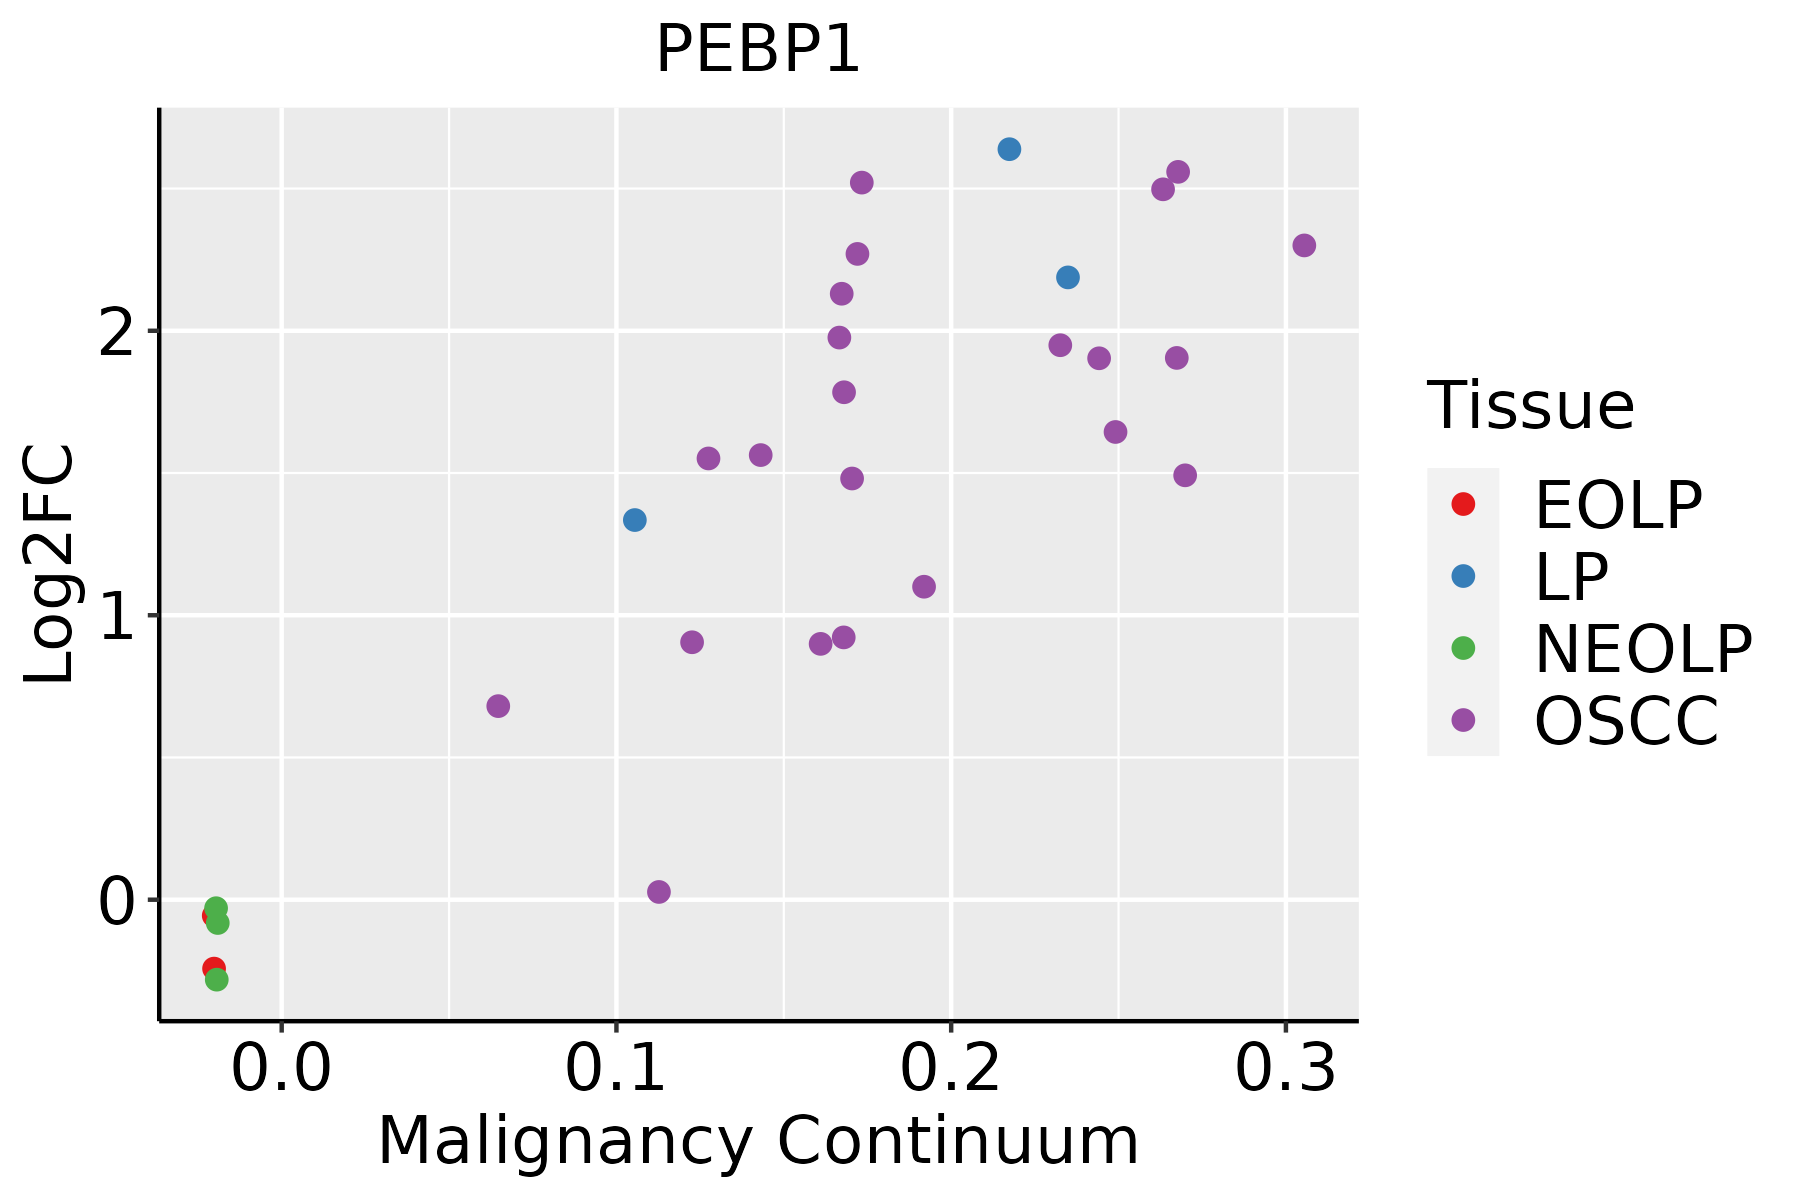 | EOLP: Erosive Oral lichen planus |
| LP: leukoplakia | ||
| NEOLP: Non-erosive oral lichen planus | ||
| OSCC: Oral squamous cell carcinoma | ||
| Prostate |  | BPH: Benign Prostatic Hyperplasia |
| Skin | 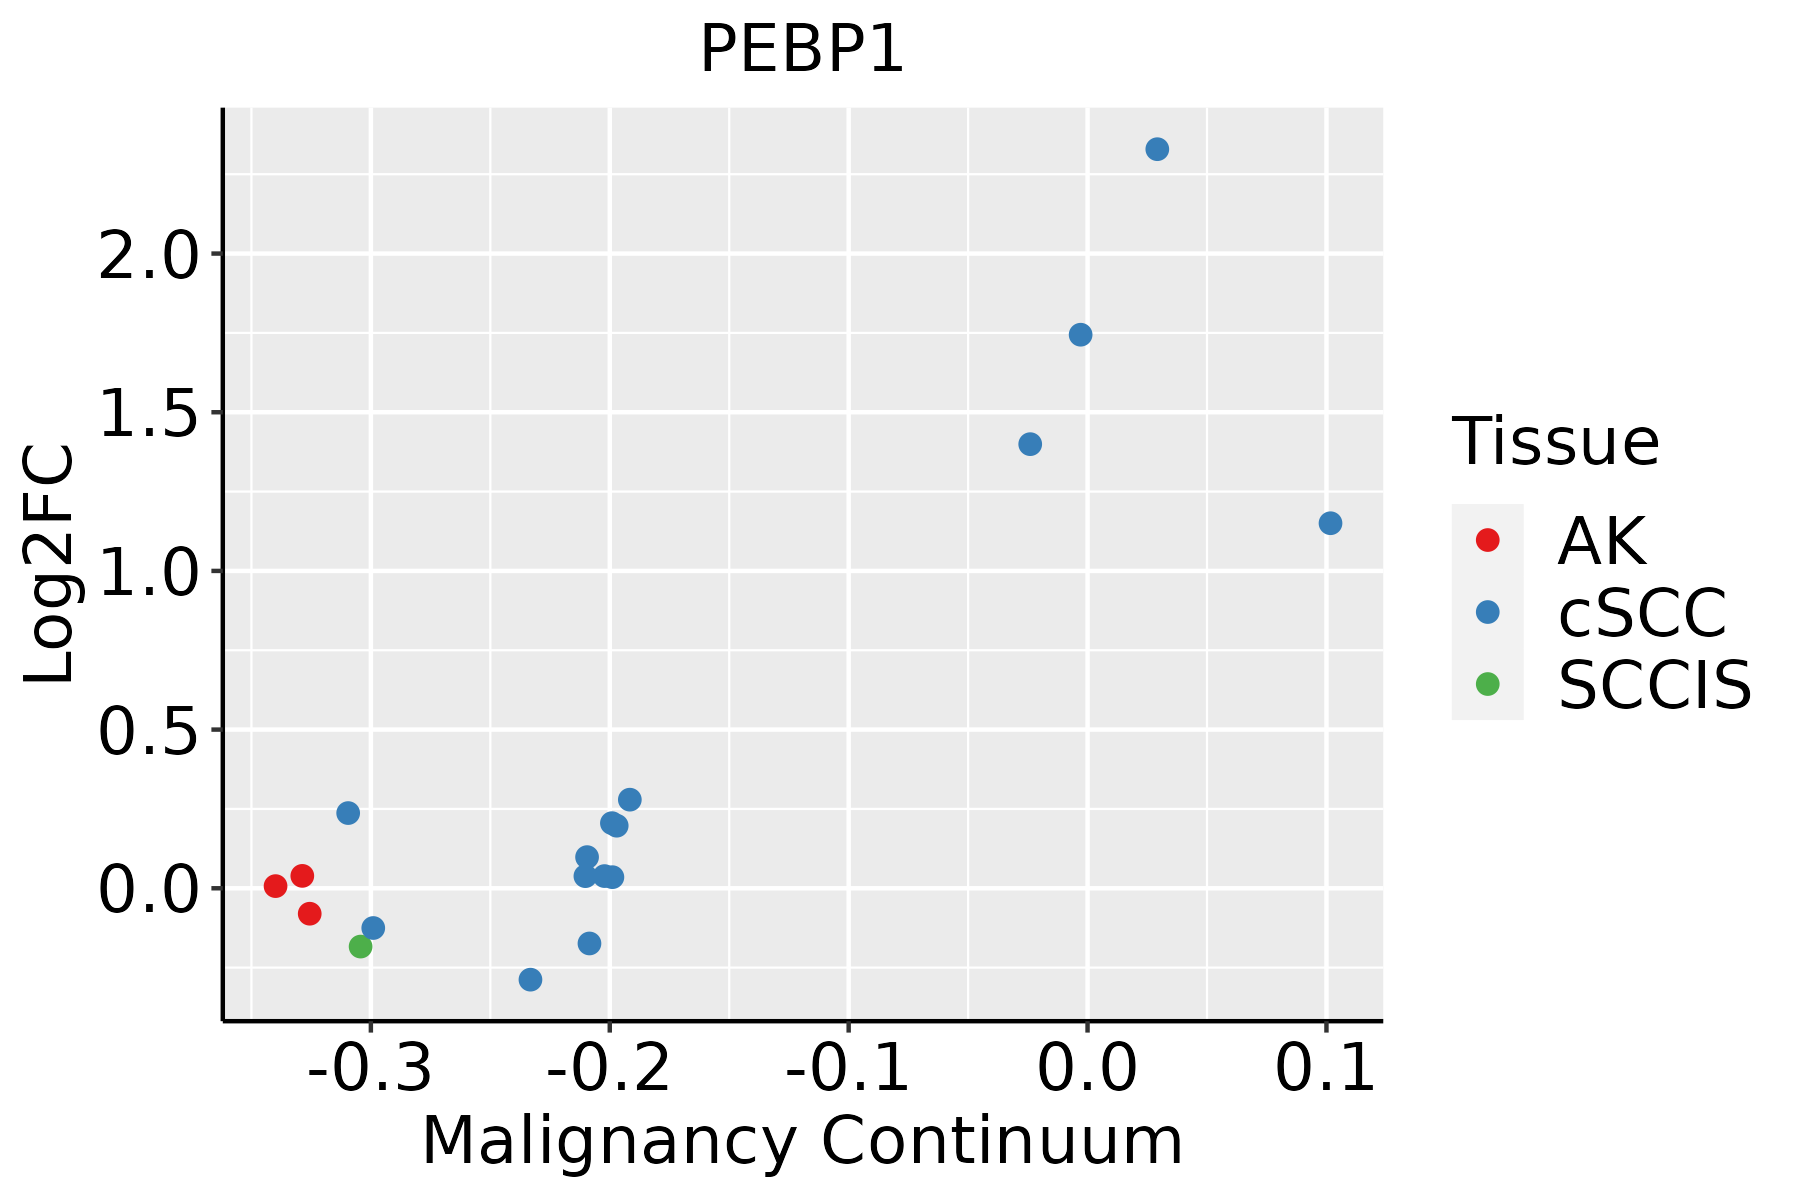 | AK: Actinic keratosis |
| cSCC: Cutaneous squamous cell carcinoma | ||
| SCCIS:squamous cell carcinoma in situ | ||
| Thyroid |  | ATC: Anaplastic thyroid cancer |
| HT: Hashimoto's thyroiditis | ||
| PTC: Papillary thyroid cancer |
| ∗log2FC in expression of this searched gene in stem-like cells from each diseased tissue sample relative to stem-like cells in normal samples in each tissue plotted against the malignancy continuum. Samples are colored based on if they are from different disease stage. |
Top |
Malignant transformation related pathway analysis |
| Find out the enriched GO biological processes and KEGG pathways involved in transition from healthy to precancer to cancer |
| Tissue | Disease Stage | Enriched GO biological Processes |
| Colorectum | AD |  |
| Colorectum | SER |  |
| Colorectum | MSS |  |
| Colorectum | MSI-H |  |
| Colorectum | FAP |  |
| ∗Top 15 enriched GO BP terms are showed in the bar plot of each disease state in each tissue. Each row represents a significant GO biological process which is colored according to the -log10(p.adjust). |
| Page: 1 2 3 4 5 6 7 8 9 |
| GO ID | Tissue | Disease Stage | Description | Gene Ratio | Bg Ratio | pvalue | p.adjust | Count |
| GO:00525479 | Breast | Precancer | regulation of peptidase activity | 71/1080 | 461/18723 | 2.72e-14 | 6.94e-12 | 71 |
| GO:00525489 | Breast | Precancer | regulation of endopeptidase activity | 67/1080 | 432/18723 | 1.06e-13 | 2.36e-11 | 67 |
| GO:00458619 | Breast | Precancer | negative regulation of proteolysis | 50/1080 | 351/18723 | 2.99e-09 | 2.39e-07 | 50 |
| GO:00513468 | Breast | Precancer | negative regulation of hydrolase activity | 50/1080 | 379/18723 | 3.85e-08 | 2.34e-06 | 50 |
| GO:00104668 | Breast | Precancer | negative regulation of peptidase activity | 38/1080 | 262/18723 | 1.46e-07 | 7.82e-06 | 38 |
| GO:00109519 | Breast | Precancer | negative regulation of endopeptidase activity | 37/1080 | 252/18723 | 1.55e-07 | 8.05e-06 | 37 |
| GO:005254714 | Breast | IDC | regulation of peptidase activity | 96/1434 | 461/18723 | 7.58e-20 | 6.15e-17 | 96 |
| GO:005254814 | Breast | IDC | regulation of endopeptidase activity | 88/1434 | 432/18723 | 1.20e-17 | 4.85e-15 | 88 |
| GO:004586114 | Breast | IDC | negative regulation of proteolysis | 70/1434 | 351/18723 | 8.21e-14 | 2.22e-11 | 70 |
| GO:005134613 | Breast | IDC | negative regulation of hydrolase activity | 71/1434 | 379/18723 | 1.33e-12 | 2.90e-10 | 71 |
| GO:001046613 | Breast | IDC | negative regulation of peptidase activity | 56/1434 | 262/18723 | 1.39e-12 | 2.92e-10 | 56 |
| GO:001095112 | Breast | IDC | negative regulation of endopeptidase activity | 52/1434 | 252/18723 | 3.53e-11 | 5.57e-09 | 52 |
| GO:005254723 | Breast | DCIS | regulation of peptidase activity | 88/1390 | 461/18723 | 1.18e-16 | 4.78e-14 | 88 |
| GO:005254823 | Breast | DCIS | regulation of endopeptidase activity | 83/1390 | 432/18723 | 6.07e-16 | 2.15e-13 | 83 |
| GO:004586123 | Breast | DCIS | negative regulation of proteolysis | 63/1390 | 351/18723 | 4.39e-11 | 6.06e-09 | 63 |
| GO:005134623 | Breast | DCIS | negative regulation of hydrolase activity | 64/1390 | 379/18723 | 4.32e-10 | 4.80e-08 | 64 |
| GO:001046622 | Breast | DCIS | negative regulation of peptidase activity | 49/1390 | 262/18723 | 1.54e-09 | 1.43e-07 | 49 |
| GO:001095122 | Breast | DCIS | negative regulation of endopeptidase activity | 47/1390 | 252/18723 | 3.63e-09 | 3.11e-07 | 47 |
| GO:005254710 | Cervix | CC | regulation of peptidase activity | 112/2311 | 461/18723 | 6.70e-13 | 3.08e-10 | 112 |
| GO:005254810 | Cervix | CC | regulation of endopeptidase activity | 103/2311 | 432/18723 | 1.89e-11 | 5.14e-09 | 103 |
| Page: 1 2 3 4 5 6 7 8 9 10 |
| Pathway ID | Tissue | Disease Stage | Description | Gene Ratio | Bg Ratio | pvalue | p.adjust | qvalue | Count |
| Page: 1 |
Top |
Cell-cell communication analysis |
| Identification of potential cell-cell interactions between two cell types and their ligand-receptor pairs for different disease states |
| Ligand | Receptor | LRpair | Pathway | Tissue | Disease Stage |
| Page: 1 |
Top |
Single-cell gene regulatory network inference analysis |
| Find out the significant the regulons (TFs) and the target genes of each regulon across cell types for different disease states |
| TF | Cell Type | Tissue | Disease Stage | Target Gene | RSS | Regulon Activity |
| ∗The dot plots of a searched regulon are shown for all cell subpopulations in each disease state of each tissue based on the regulon specific score inferred using pySCENIC and by calculating the average expression. |
| Page: 1 |
Top |
Somatic mutation of malignant transformation related genes |
| Annotation of somatic variants for genes involved in malignant transformation |
| Hugo Symbol | Variant Class | Variant Classification | dbSNP RS | HGVSc | HGVSp | HGVSp Short | SWISSPROT | BIOTYPE | SIFT | PolyPhen | Tumor Sample Barcode | Tissue | Histology | Sex | Age | Stage | Therapy Types | Drugs | Outcome |
| PEBP1 | SNV | Missense_Mutation | c.440N>T | p.Gly147Val | p.G147V | P30086 | protein_coding | tolerated(0.18) | benign(0.141) | TCGA-D8-A147-01 | Breast | breast invasive carcinoma | Female | <65 | I/II | Chemotherapy | doxorubicine | SD | |
| PEBP1 | SNV | Missense_Mutation | rs530714085 | c.422N>A | p.Arg141Gln | p.R141Q | P30086 | protein_coding | tolerated(0.13) | benign(0.029) | TCGA-AP-A1DK-01 | Endometrium | uterine corpus endometrioid carcinoma | Female | <65 | I/II | Unknown | Unknown | SD |
| PEBP1 | SNV | Missense_Mutation | novel | c.275N>C | p.Met92Thr | p.M92T | P30086 | protein_coding | deleterious(0) | benign(0.171) | TCGA-AP-A1DO-01 | Endometrium | uterine corpus endometrioid carcinoma | Female | <65 | I/II | Unknown | Unknown | SD |
| PEBP1 | SNV | Missense_Mutation | rs530714085 | c.422G>A | p.Arg141Gln | p.R141Q | P30086 | protein_coding | tolerated(0.13) | benign(0.029) | TCGA-AX-A2HC-01 | Endometrium | uterine corpus endometrioid carcinoma | Female | <65 | III/IV | Chemotherapy | paclitaxel | PD |
| PEBP1 | SNV | Missense_Mutation | c.161C>T | p.Ser54Leu | p.S54L | P30086 | protein_coding | tolerated(0.2) | benign(0.013) | TCGA-B5-A0JY-01 | Endometrium | uterine corpus endometrioid carcinoma | Female | <65 | III/IV | Chemotherapy | doxorubicin | SD | |
| PEBP1 | SNV | Missense_Mutation | rs777648257 | c.347G>A | p.Gly116Asp | p.G116D | P30086 | protein_coding | deleterious(0) | probably_damaging(0.978) | TCGA-B5-A0JY-01 | Endometrium | uterine corpus endometrioid carcinoma | Female | <65 | III/IV | Chemotherapy | doxorubicin | SD |
| PEBP1 | SNV | Missense_Mutation | novel | c.541N>C | p.Tyr181His | p.Y181H | P30086 | protein_coding | tolerated(0.19) | benign(0.001) | TCGA-DI-A1BU-01 | Endometrium | uterine corpus endometrioid carcinoma | Female | <65 | I/II | Chemotherapy | paclitaxel | SD |
| PEBP1 | SNV | Missense_Mutation | novel | c.325T>A | p.Ser109Thr | p.S109T | P30086 | protein_coding | deleterious(0) | benign(0.282) | TCGA-DD-AAD6-01 | Liver | liver hepatocellular carcinoma | Male | >=65 | III/IV | Unknown | Unknown | PD |
| PEBP1 | SNV | Missense_Mutation | c.328N>T | p.Gly110Trp | p.G110W | P30086 | protein_coding | deleterious(0) | probably_damaging(0.998) | TCGA-05-4244-01 | Lung | lung adenocarcinoma | Male | >=65 | III/IV | Unknown | Unknown | SD | |
| PEBP1 | SNV | Missense_Mutation | c.172N>G | p.Leu58Val | p.L58V | P30086 | protein_coding | tolerated(0.36) | benign(0.006) | TCGA-97-7938-01 | Lung | lung adenocarcinoma | Female | >=65 | I/II | Unknown | Unknown | SD |
| Page: 1 2 |
Top |
Related drugs of malignant transformation related genes |
| Identification of chemicals and drugs interact with genes involved in malignant transfromation |
| (DGIdb 4.0) |
| Entrez ID | Symbol | Category | Interaction Types | Drug Claim Name | Drug Name | PMIDs |
| 5037 | PEBP1 | KINASE, PROTEASE INHIBITOR | FLUTAMIDE | FLUTAMIDE | 12377983 | |
| 5037 | PEBP1 | KINASE, PROTEASE INHIBITOR | DHT | ANDROSTANOLONE | 12417618 |
| Page: 1 |

Copyright 2023-Present -The University of Texas Health Science Center at Houston |