Schematic overview of the cellular and molecular mechanisms involved in the cancer progression, including the proposed cellular and molecular mechanisms in cancer cells trajectory. AT1: alveolar type 1 cells; AT2: alveolar type 2 cells; AAH: atypical adenomatous hyperplasia; AIS: adenocarcinoma in situ; MIA: minimally invasive adenocarcinoma; IA: invasive adenocarcinoma; EMT: epithelial-mesenchymal transition

Home

Download

Statistics

Help

Contact

Center for Computational Systems Medicine
leaf

Gene summary

leaf

Malignant transformation analysis

leaf

Malignant transformation related pathway analysis

leaf

Cell-cell communication analysis

leaf

Single-cell gene regulatory network inference analysis

leaf

Somatic mutation of malignant transformation related genes

leaf

Related drugs of malignant transformation related genes

Gene: PEA15

Gene summary for PEA15

check button Gene summary.

Gene informationSpeciesHuman
Gene symbol

PEA15

Gene ID

8682

Gene nameproliferation and apoptosis adaptor protein 15
Gene AliasHMAT1
Cytomap1q23.2
Gene Typeprotein-coding
GO ID

GO:0000165

UniProtAcc

Q15121


Top

Malignant transformation analysis

check button Identification of the aberrant gene expression in precancerous and cancerous lesions by comparing the gene expression of stem-like cells in diseased tissues with normal stem cells
check button Malignant transformation involving gene list.
Entrez IDSymbolReplicatesSpeciesOrganTissueAdj P-valueLog2FCMalignancy
8682PEA15AEH-subject3HumanEndometriumAEH3.09e-02-1.28e-01-0.2576
8682PEA15EEC-subject1HumanEndometriumEEC3.97e-02-8.14e-02-0.2682
8682PEA15EEC-subject3HumanEndometriumEEC1.19e-091.06e-01-0.2525
8682PEA15GSM5276934HumanEndometriumEEC5.55e-306.73e-01-0.0913
8682PEA15GSM5276937HumanEndometriumEEC1.31e-145.50e-01-0.0897
8682PEA15GSM6177620_NYU_UCEC1_lib1_lib1HumanEndometriumEEC1.98e-171.38e-01-0.1869
8682PEA15GSM6177620_NYU_UCEC1_lib2_lib2HumanEndometriumEEC1.87e-219.87e-02-0.1875
8682PEA15GSM6177620_NYU_UCEC1_lib3_lib3HumanEndometriumEEC3.31e-204.31e-02-0.1883
8682PEA15GSM6177621_NYU_UCEC2_lib1_lib1HumanEndometriumEEC2.31e-214.25e-01-0.1934
8682PEA15GSM6177622_NYU_UCEC3_lib1_lib1HumanEndometriumEEC9.01e-163.94e-02-0.1917
8682PEA15GSM6177622_NYU_UCEC3_lib2_lib2HumanEndometriumEEC2.39e-21-3.98e-03-0.1916
8682PEA15LZE4THumanEsophagusESCC3.39e-146.72e-020.0811
8682PEA15LZE7THumanEsophagusESCC1.87e-041.05e-010.0667
8682PEA15LZE8THumanEsophagusESCC1.35e-06-1.60e-010.067
8682PEA15LZE20THumanEsophagusESCC2.94e-15-1.85e-010.0662
8682PEA15LZE21D1HumanEsophagusHGIN2.36e-03-1.90e-010.0632
8682PEA15LZE22D1HumanEsophagusHGIN1.27e-05-1.78e-010.0595
8682PEA15LZE6THumanEsophagusESCC9.85e-065.48e-020.0845
8682PEA15P1T-EHumanEsophagusESCC1.26e-042.10e-010.0875
8682PEA15P2T-EHumanEsophagusESCC4.30e-225.64e-010.1177
Page: 1 2 3 4 5 6 7 

check button Transcriptomic changes along malignancy continuum.
TissueExpression DynamicsAbbreviation
EndometriumThe image shows the transcriptomic changes along malignancy continuum.log2FC in expression of this searched gene in stem-like cells from each diseased tissue sample relative to stem-like cells in normal samples in each tissue plotted against the malignancy continuum. Samples are colored based on if they are from different disease stage.
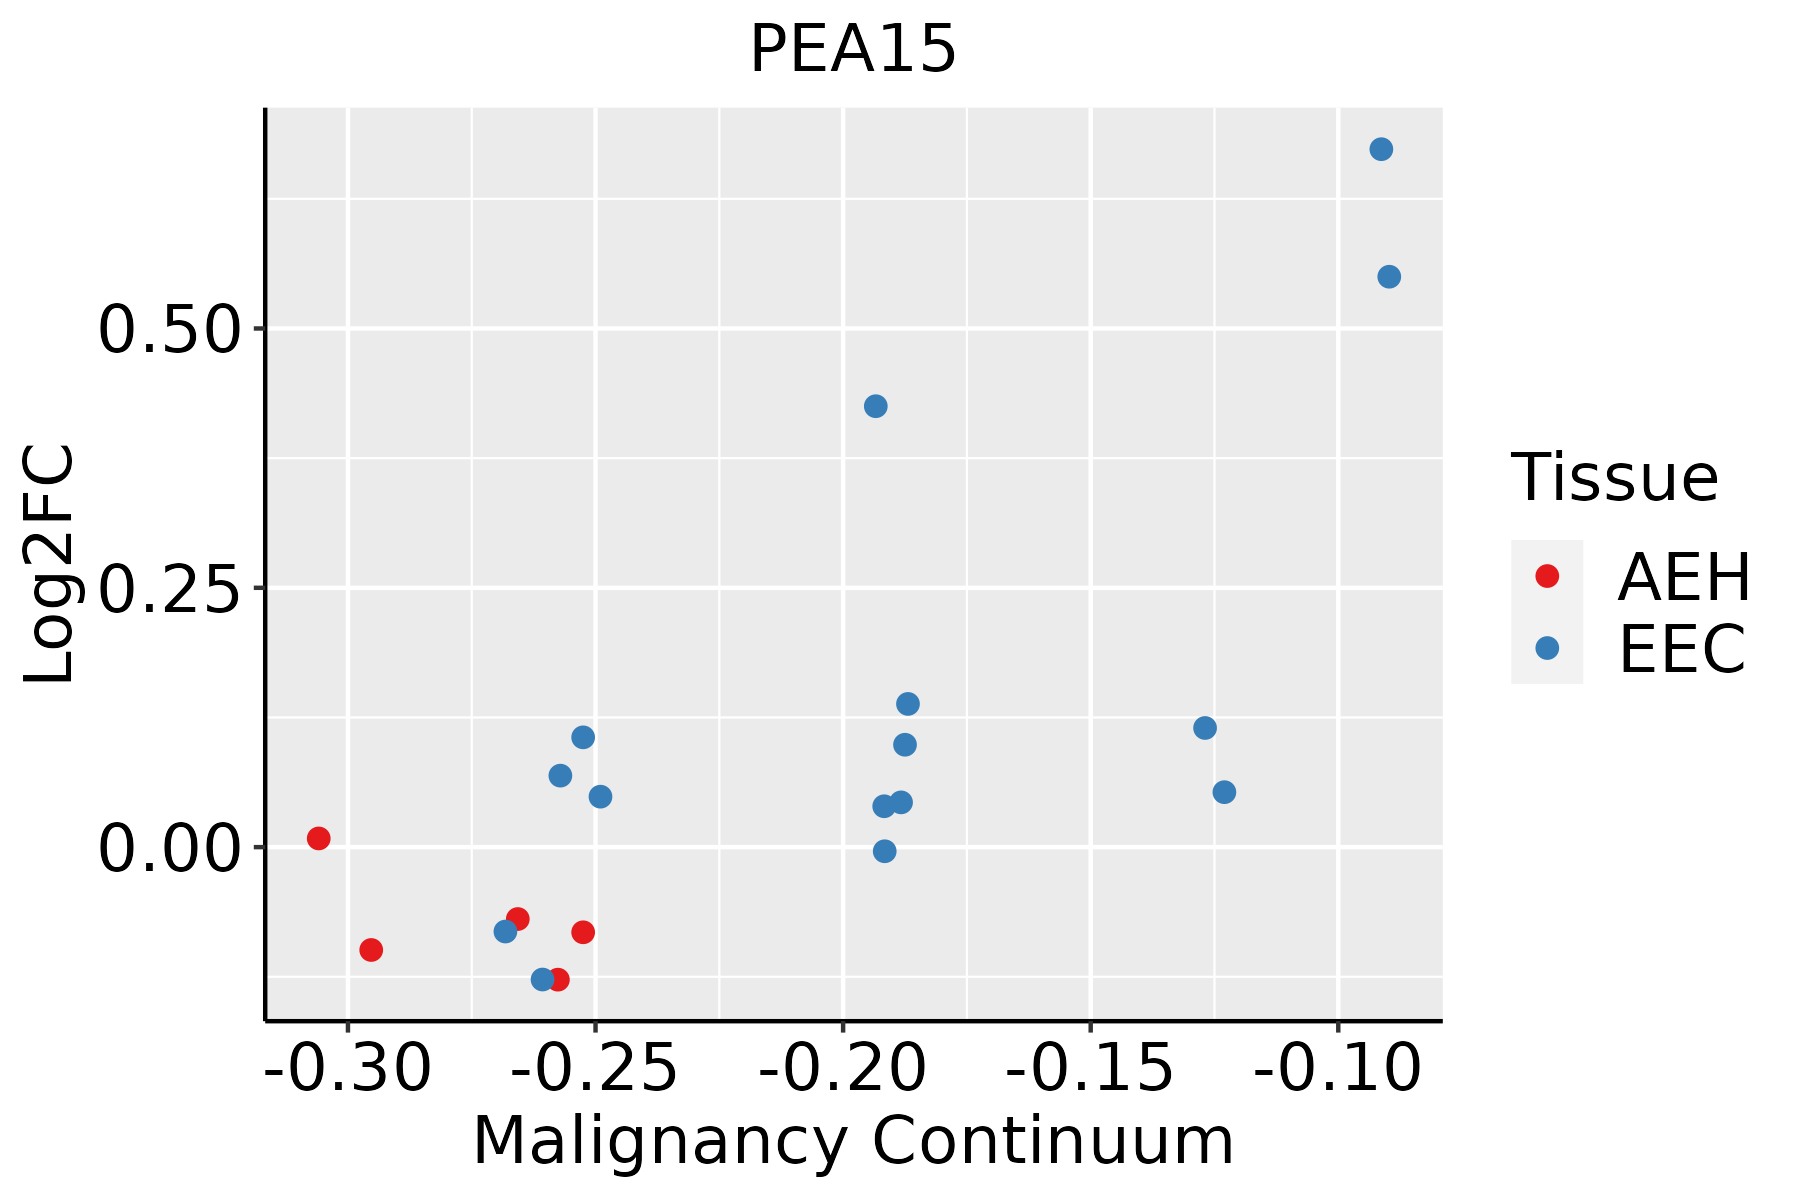
AEH: Atypical endometrial hyperplasia
EEC: Endometrioid Cancer
EsophagusThe image shows the transcriptomic changes along malignancy continuum.log2FC in expression of this searched gene in stem-like cells from each diseased tissue sample relative to stem-like cells in normal samples in each tissue plotted against the malignancy continuum. Samples are colored based on if they are from different disease stage.
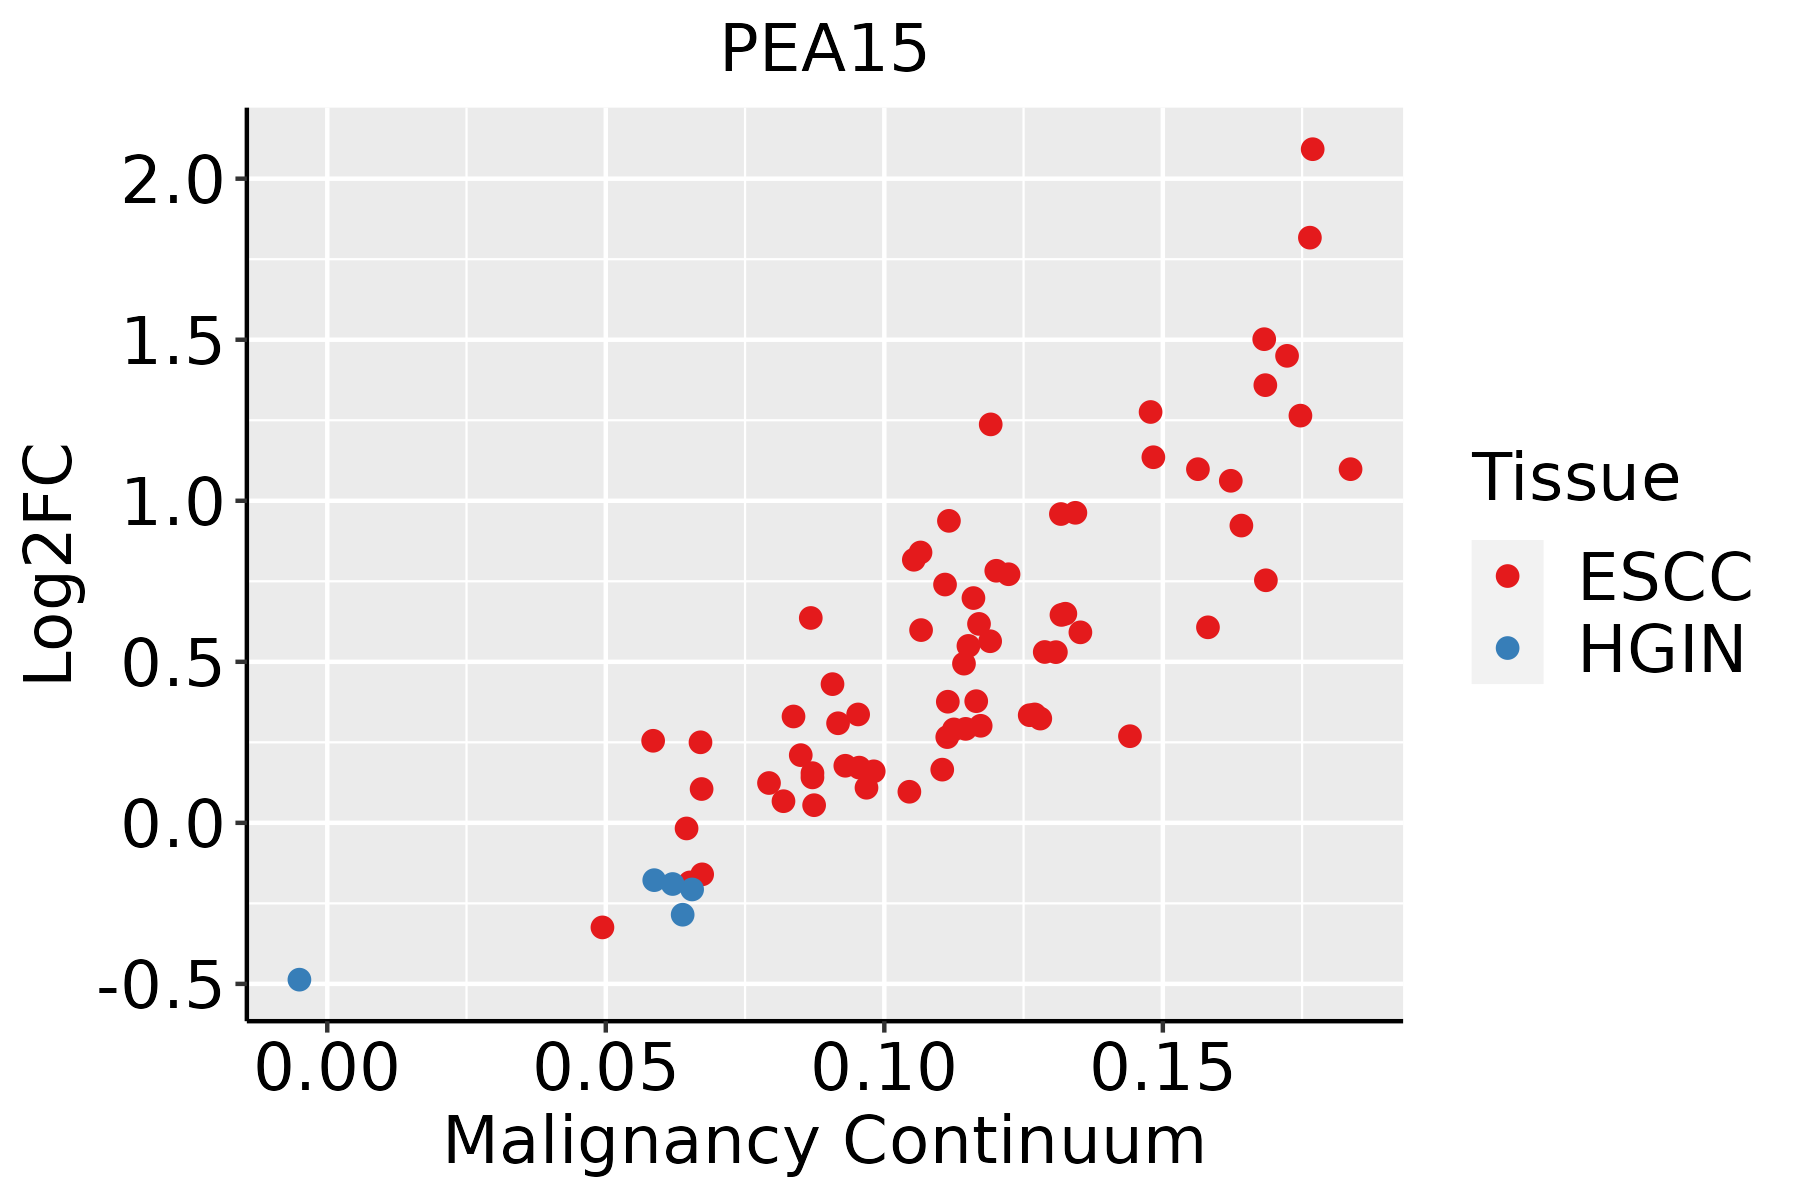
ESCC: Esophageal squamous cell carcinoma
HGIN: High-grade intraepithelial neoplasias
LGIN: Low-grade intraepithelial neoplasias
LiverThe image shows the transcriptomic changes along malignancy continuum.log2FC in expression of this searched gene in stem-like cells from each diseased tissue sample relative to stem-like cells in normal samples in each tissue plotted against the malignancy continuum. Samples are colored based on if they are from different disease stage.HCC: Hepatocellular carcinoma
NAFLD: Non-alcoholic fatty liver disease
Oral CavityThe image shows the transcriptomic changes along malignancy continuum.log2FC in expression of this searched gene in stem-like cells from each diseased tissue sample relative to stem-like cells in normal samples in each tissue plotted against the malignancy continuum. Samples are colored based on if they are from different disease stage.
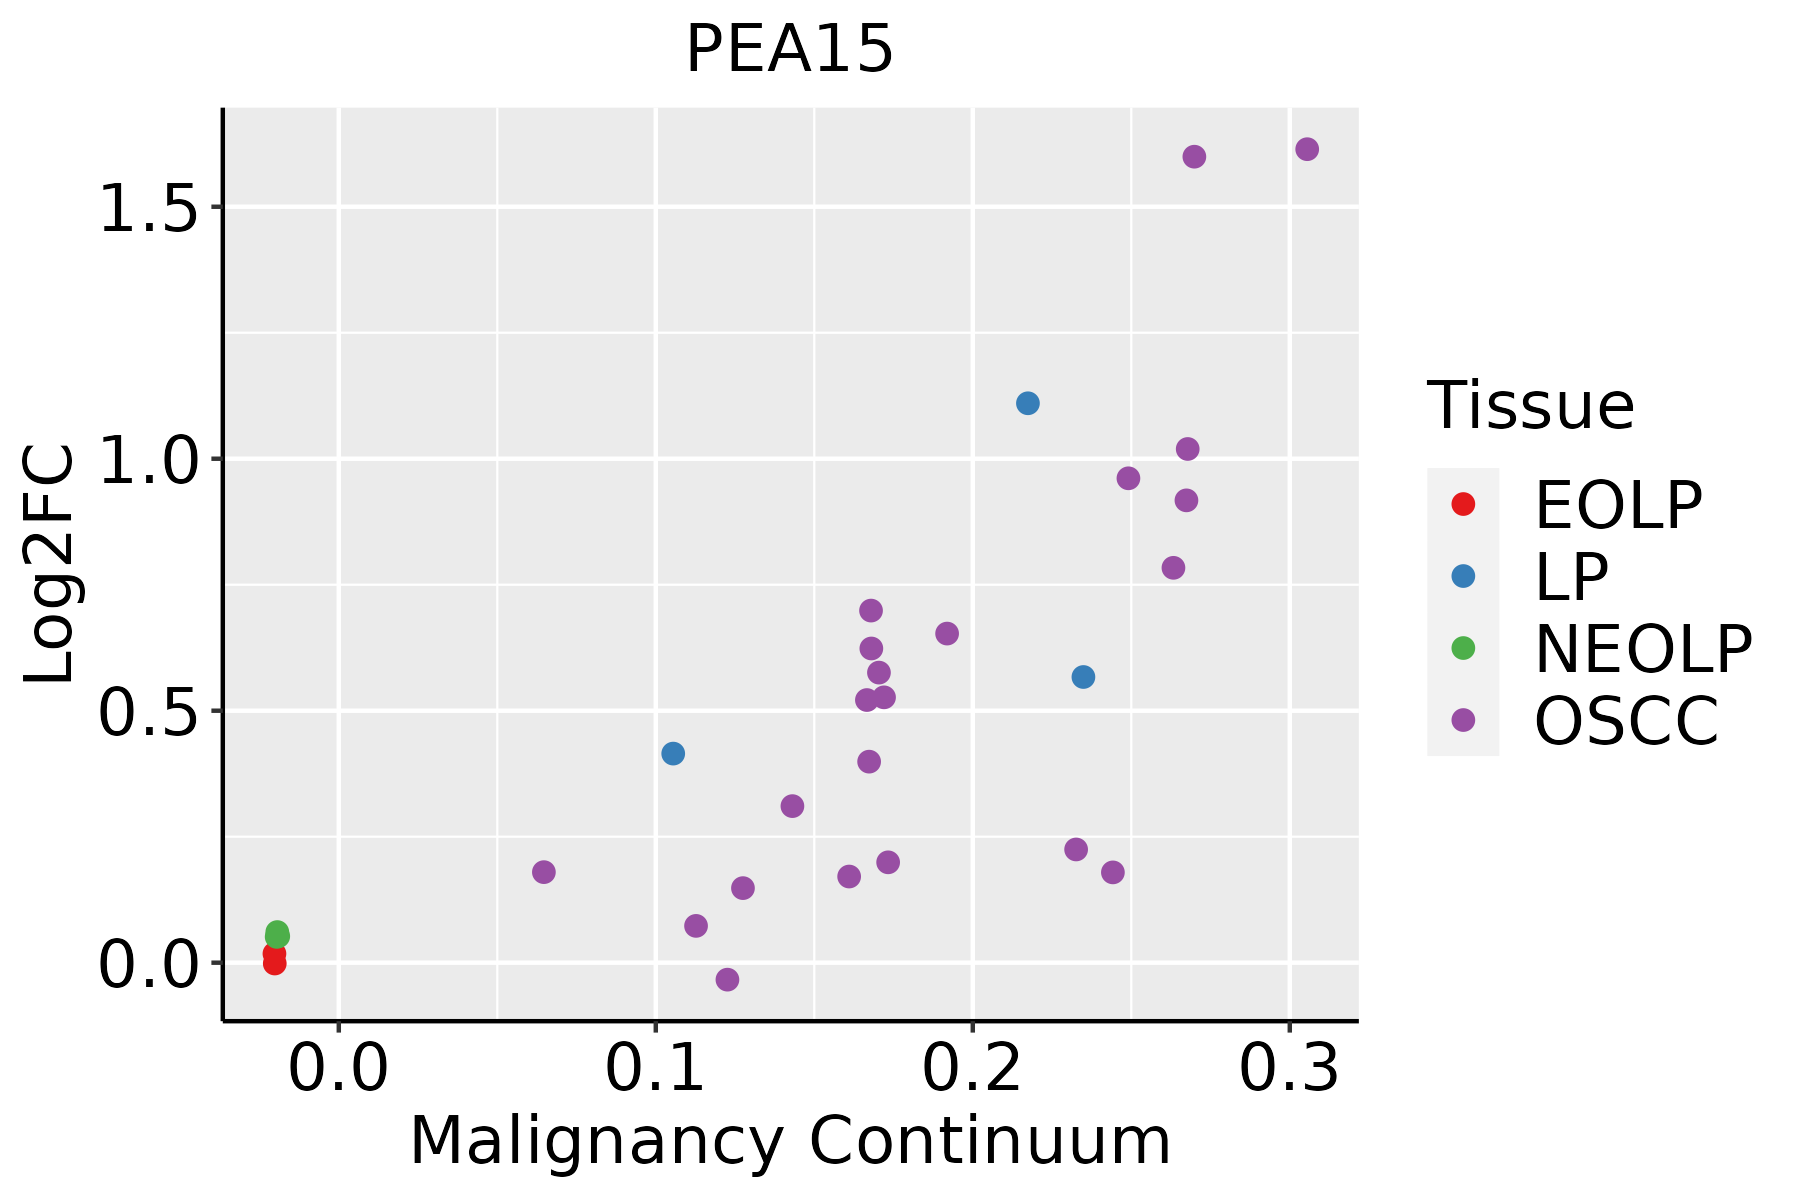
EOLP: Erosive Oral lichen planus
LP: leukoplakia
NEOLP: Non-erosive oral lichen planus
OSCC: Oral squamous cell carcinoma
ProstateThe image shows the transcriptomic changes along malignancy continuum.log2FC in expression of this searched gene in stem-like cells from each diseased tissue sample relative to stem-like cells in normal samples in each tissue plotted against the malignancy continuum. Samples are colored based on if they are from different disease stage.
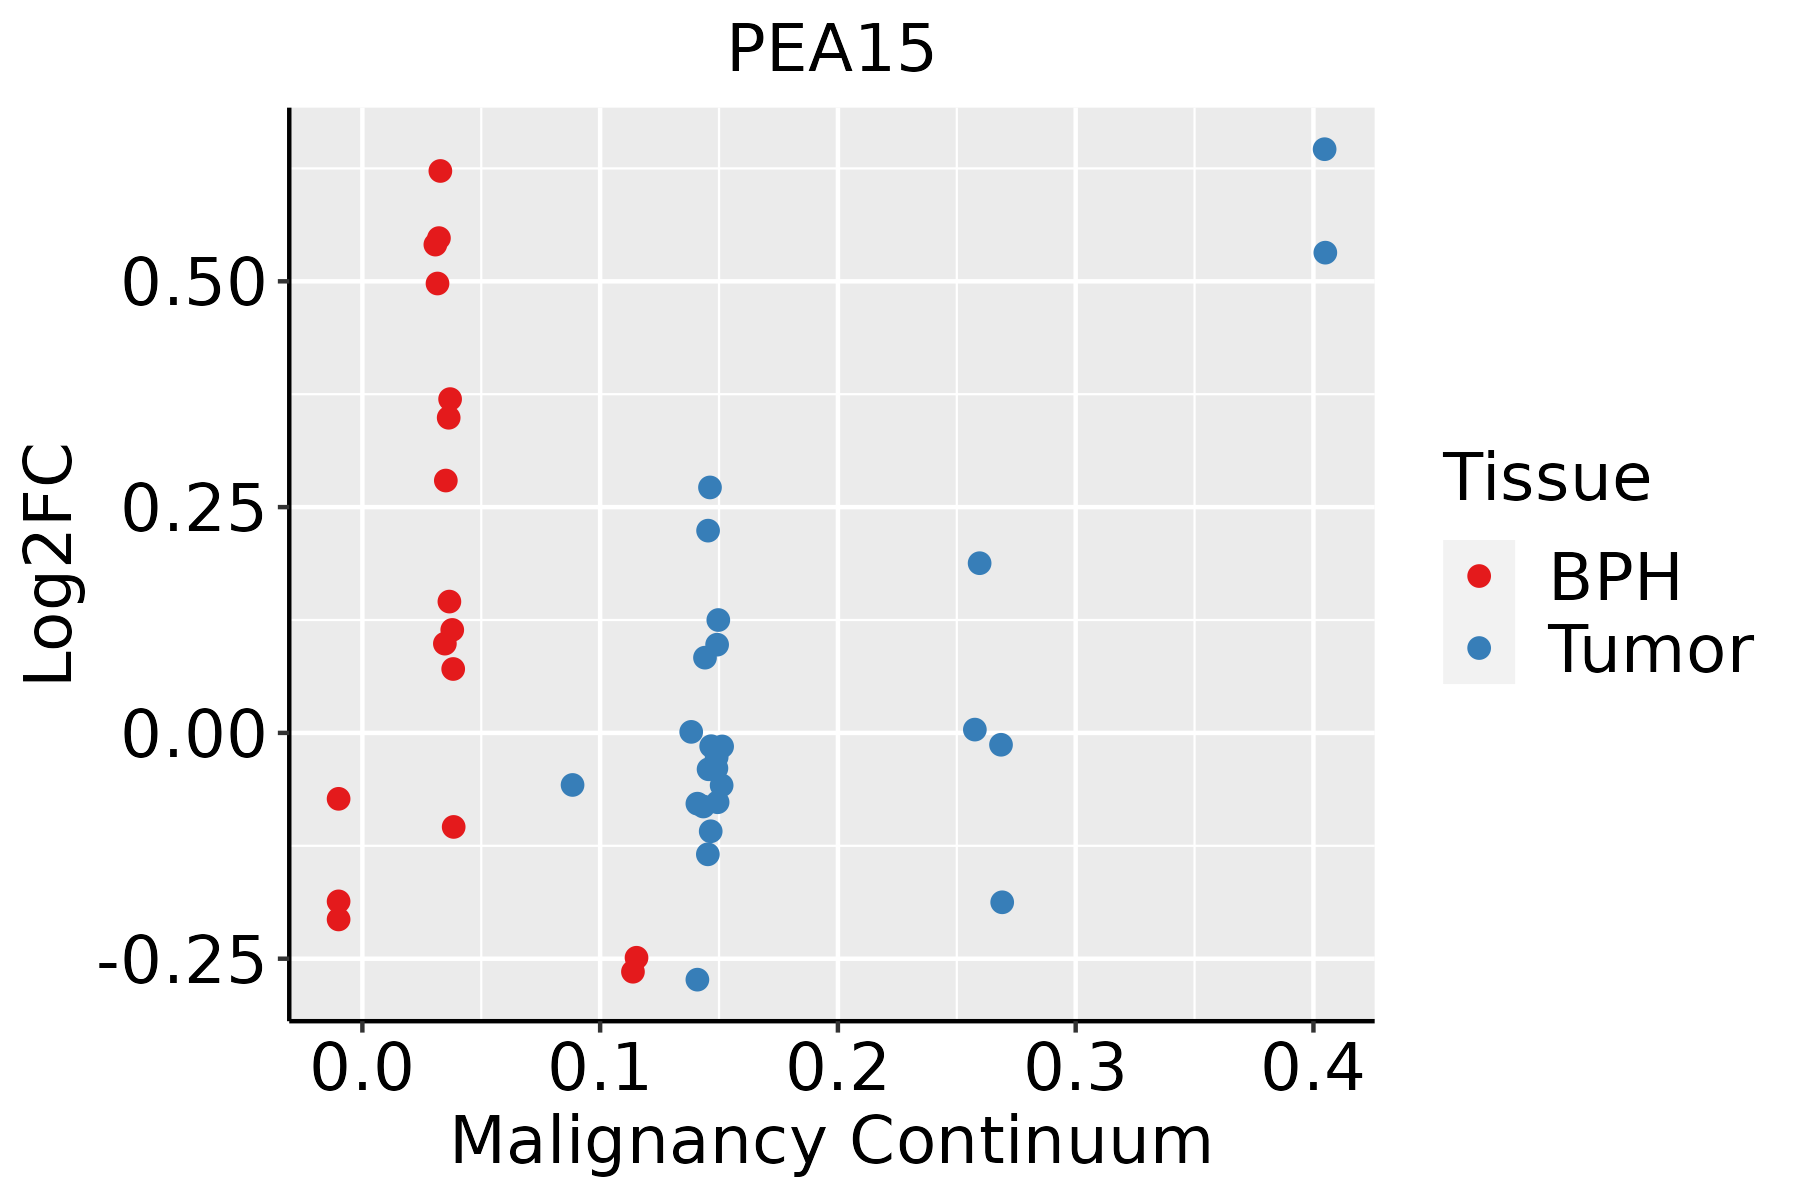
BPH: Benign Prostatic Hyperplasia
ThyroidThe image shows the transcriptomic changes along malignancy continuum.log2FC in expression of this searched gene in stem-like cells from each diseased tissue sample relative to stem-like cells in normal samples in each tissue plotted against the malignancy continuum. Samples are colored based on if they are from different disease stage.
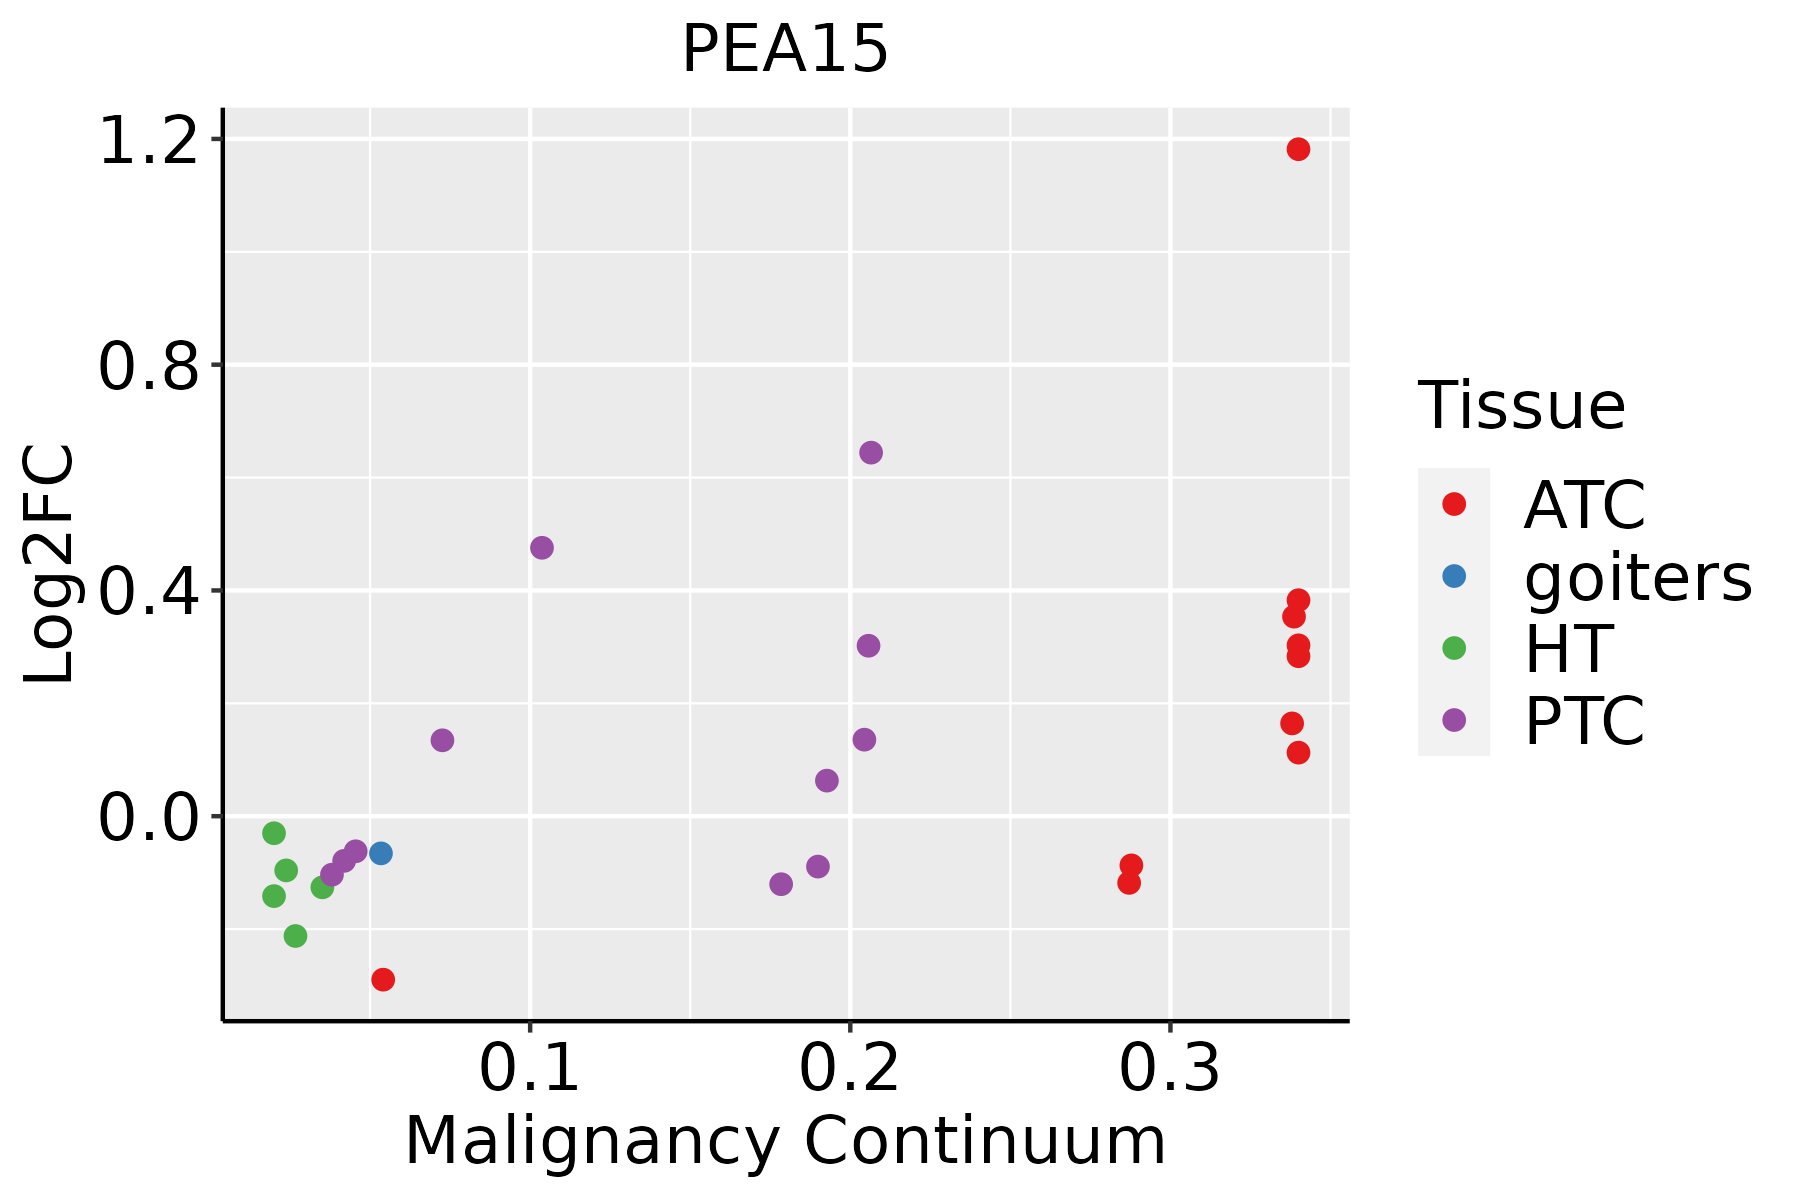
ATC: Anaplastic thyroid cancer
HT: Hashimoto's thyroiditis
PTC: Papillary thyroid cancer
∗log2FC in expression of this searched gene in stem-like cells from each diseased tissue sample relative to stem-like cells in normal samples in each tissue plotted against the malignancy continuum. Samples are colored based on if they are from different disease stage.

Top

Malignant transformation related pathway analysis

check buttonFind out the enriched GO biological processes and KEGG pathways involved in transition from healthy to precancer to cancer
check button Figure of enriched GO biological processes.
TissueDisease StageEnriched GO biological Processes
ColorectumADGO analysis - Figure of enriched GO biological processes: Top 15 enriched GO BP terms are showed in the bar plot of each disease state in each tissue. Each row represents a significant GO biological process which is colored according to the -log10(p.adjust).
ColorectumSERGO analysis - Figure of enriched GO biological processes: Top 15 enriched GO BP terms are showed in the bar plot of each disease state in each tissue. Each row represents a significant GO biological process which is colored according to the -log10(p.adjust).
ColorectumMSSGO analysis - Figure of enriched GO biological processes: Top 15 enriched GO BP terms are showed in the bar plot of each disease state in each tissue. Each row represents a significant GO biological process which is colored according to the -log10(p.adjust).
ColorectumMSI-HGO analysis - Figure of enriched GO biological processes: Top 15 enriched GO BP terms are showed in the bar plot of each disease state in each tissue. Each row represents a significant GO biological process which is colored according to the -log10(p.adjust).
ColorectumFAPGO analysis - Figure of enriched GO biological processes: Top 15 enriched GO BP terms are showed in the bar plot of each disease state in each tissue. Each row represents a significant GO biological process which is colored according to the -log10(p.adjust).
∗Top 15 enriched GO BP terms are showed in the bar plot of each disease state in each tissue. Each row represents a significant GO biological process which is colored according to the -log10(p.adjust).
Page: 1 2 3 4 5 6 7 8 9 

check button Enriched GO biological processes.
GO IDTissueDisease StageDescriptionGene RatioBg Ratiopvaluep.adjustCount
GO:200123316EndometriumAEHregulation of apoptotic signaling pathway86/2100356/187232.97e-124.95e-1086
GO:20012358EndometriumAEHpositive regulation of apoptotic signaling pathway36/2100126/187237.56e-083.92e-0636
GO:009719116EndometriumAEHextrinsic apoptotic signaling pathway49/2100219/187231.58e-064.94e-0549
GO:200123416EndometriumAEHnegative regulation of apoptotic signaling pathway49/2100224/187233.12e-068.58e-0549
GO:200123616EndometriumAEHregulation of extrinsic apoptotic signaling pathway37/2100151/187233.17e-068.69e-0537
GO:00510515EndometriumAEHnegative regulation of transport79/2100470/187231.51e-041.99e-0379
GO:20012387EndometriumAEHpositive regulation of extrinsic apoptotic signaling pathway15/210048/187231.58e-042.08e-0315
GO:19020434EndometriumAEHpositive regulation of extrinsic apoptotic signaling pathway via death domain receptors7/210013/187232.05e-042.54e-037
GO:200123716EndometriumAEHnegative regulation of extrinsic apoptotic signaling pathway23/210097/187233.66e-043.99e-0323
GO:000862510EndometriumAEHextrinsic apoptotic signaling pathway via death domain receptors19/210082/187231.54e-031.26e-0219
GO:19020419EndometriumAEHregulation of extrinsic apoptotic signaling pathway via death domain receptors13/210049/187232.31e-031.74e-0213
GO:0034763EndometriumAEHnegative regulation of transmembrane transport26/2100143/187238.78e-034.78e-0226
GO:200123317EndometriumEECregulation of apoptotic signaling pathway91/2168356/187231.31e-133.28e-1191
GO:200123516EndometriumEECpositive regulation of apoptotic signaling pathway37/2168126/187235.23e-082.83e-0637
GO:200123417EndometriumEECnegative regulation of apoptotic signaling pathway53/2168224/187232.53e-071.09e-0553
GO:009719117EndometriumEECextrinsic apoptotic signaling pathway52/2168219/187232.91e-071.20e-0552
GO:200123617EndometriumEECregulation of extrinsic apoptotic signaling pathway40/2168151/187233.33e-071.33e-0540
GO:200123814EndometriumEECpositive regulation of extrinsic apoptotic signaling pathway16/216848/187235.88e-059.12e-0416
GO:200123717EndometriumEECnegative regulation of extrinsic apoptotic signaling pathway25/216897/187238.28e-051.19e-0325
GO:190204312EndometriumEECpositive regulation of extrinsic apoptotic signaling pathway via death domain receptors7/216813/187232.51e-042.92e-037
Page: 1 2 3 4 5 6 

check button Enriched KEGG pathways.
Pathway IDTissueDisease StageDescriptionGene RatioBg Ratiopvaluep.adjustqvalueCount
Page: 1 

Top

Cell-cell communication analysis

check buttonIdentification of potential cell-cell interactions between two cell types and their ligand-receptor pairs for different disease states
LigandReceptorLRpairPathwayTissueDisease Stage
Page: 1 

Top

Single-cell gene regulatory network inference analysis

check buttonFind out the significant the regulons (TFs) and the target genes of each regulon across cell types for different disease states
TFCell TypeTissueDisease StageTarget GeneRSSRegulon Activity
∗The dot plots of a searched regulon are shown for all cell subpopulations in each disease state of each tissue based on the regulon specific score inferred using pySCENIC and by calculating the average expression.
Page: 1 

Top

Somatic mutation of malignant transformation related genes

check buttonAnnotation of somatic variants for genes involved in malignant transformation
Hugo SymbolVariant ClassVariant ClassificationdbSNP RSHGVScHGVSpHGVSp ShortSWISSPROTBIOTYPESIFTPolyPhenTumor Sample BarcodeTissueHistologySexAgeStageTherapy TypesDrugsOutcome
PEA15SNVMissense_Mutationnovelc.418G>Ap.Glu140Lysp.E140KQ15121protein_codingdeleterious(0.02)benign(0.242)TCGA-PE-A5DE-01Breastbreast invasive carcinomaFemale<65I/IIChemotherapytaxotereCR
PEA15SNVMissense_Mutationnovelc.436C>Tp.Pro146Serp.P146SQ15121protein_codingtolerated(0.05)benign(0.023)TCGA-C5-A902-01Cervixcervical & endocervical cancerFemale<65I/IIChemotherapycisplatinSD
PEA15SNVMissense_Mutationnovelc.137C>Tp.Ser46Leup.S46LQ15121protein_codingtolerated(0.06)probably_damaging(0.992)TCGA-AJ-A3NE-01Endometriumuterine corpus endometrioid carcinomaFemale<65I/IIUnknownUnknownSD
PEA15SNVMissense_Mutationc.365N>Ap.Arg122Hisp.R122HQ15121protein_codingtolerated(0.11)probably_damaging(0.978)TCGA-AP-A0LM-01Endometriumuterine corpus endometrioid carcinomaFemale<65III/IVChemotherapycisplatinSD
PEA15SNVMissense_Mutationnovelc.194N>Tp.Ala65Valp.A65VQ15121protein_codingtolerated(0.19)benign(0.261)TCGA-AX-A06F-01Endometriumuterine corpus endometrioid carcinomaFemale<65III/IVChemotherapycarboplatinSD
PEA15SNVMissense_Mutationnovelc.52N>Gp.Thr18Alap.T18AQ15121protein_codingtolerated_low_confidence(0.81)benign(0)TCGA-AX-A1C4-01Endometriumuterine corpus endometrioid carcinomaFemale<65I/IIUnknownUnknownSD
PEA15SNVMissense_Mutationnovelc.155N>Cp.Ile52Thrp.I52TQ15121protein_codingdeleterious(0)probably_damaging(1)TCGA-AX-A2HJ-01Endometriumuterine corpus endometrioid carcinomaFemale<65I/IIUnknownUnknownSD
PEA15SNVMissense_Mutationnovelc.340G>Ap.Asp114Asnp.D114NQ15121protein_codingdeleterious(0)benign(0.161)TCGA-B5-A11E-01Endometriumuterine corpus endometrioid carcinomaFemale<65I/IIUnknownUnknownSD
PEA15SNVMissense_Mutationnovelc.392A>Gp.Asp131Glyp.D131GQ15121protein_codingtolerated(0.09)probably_damaging(0.926)TCGA-B5-A3FC-01Endometriumuterine corpus endometrioid carcinomaFemale<65I/IIUnknownUnknownSD
PEA15SNVMissense_Mutationc.400N>Tp.Arg134Trpp.R134WQ15121protein_codingdeleterious(0)probably_damaging(0.993)TCGA-D1-A103-01Endometriumuterine corpus endometrioid carcinomaFemale>=65I/IIUnknownUnknownSD
Page: 1 2 

Top

Related drugs of malignant transformation related genes

check buttonIdentification of chemicals and drugs interact with genes involved in malignant transfromation
(DGIdb 4.0)
Entrez IDSymbolCategoryInteraction TypesDrug Claim NameDrug NamePMIDs
Page: 1