
|
|||||
|
 | |
| |
| |
| |
| |
| |
|
Gene: PDZRN3 |
Gene summary for PDZRN3 |
| Gene information | Species | Human | Gene symbol | PDZRN3 | Gene ID | 23024 |
| Gene name | PDZ domain containing ring finger 3 | |
| Gene Alias | LNX3 | |
| Cytomap | 3p13 | |
| Gene Type | protein-coding | GO ID | GO:0006464 | UniProtAcc | Q9UPQ7 |
Top |
Malignant transformation analysis |
| Identification of the aberrant gene expression in precancerous and cancerous lesions by comparing the gene expression of stem-like cells in diseased tissues with normal stem cells |
| Entrez ID | Symbol | Replicates | Species | Organ | Tissue | Adj P-value | Log2FC | Malignancy |
| 23024 | PDZRN3 | HTA11_3410_2000001011 | Human | Colorectum | AD | 1.64e-08 | -3.93e-01 | 0.0155 |
| 23024 | PDZRN3 | HTA11_2487_2000001011 | Human | Colorectum | SER | 7.30e-08 | -5.83e-01 | -0.1808 |
| 23024 | PDZRN3 | HTA11_1938_2000001011 | Human | Colorectum | AD | 2.42e-04 | -5.51e-01 | -0.0811 |
| 23024 | PDZRN3 | HTA11_83_2000001011 | Human | Colorectum | SER | 2.81e-02 | -5.41e-01 | -0.1526 |
| 23024 | PDZRN3 | HTA11_10711_2000001011 | Human | Colorectum | AD | 2.19e-02 | -3.53e-01 | 0.0338 |
| 23024 | PDZRN3 | HTA11_99999970781_79442 | Human | Colorectum | MSS | 2.71e-03 | -2.71e-01 | 0.294 |
| 23024 | PDZRN3 | HTA11_99999973899_84307 | Human | Colorectum | MSS | 4.80e-05 | -6.26e-01 | 0.2585 |
| 23024 | PDZRN3 | HTA11_99999974143_84620 | Human | Colorectum | MSS | 3.84e-03 | -3.90e-01 | 0.3005 |
| 23024 | PDZRN3 | A015-C-203 | Human | Colorectum | FAP | 1.21e-08 | -3.75e-01 | -0.1294 |
| 23024 | PDZRN3 | A002-C-201 | Human | Colorectum | FAP | 7.95e-06 | -3.23e-01 | 0.0324 |
| 23024 | PDZRN3 | A001-C-108 | Human | Colorectum | FAP | 4.67e-10 | -4.16e-01 | -0.0272 |
| 23024 | PDZRN3 | A002-C-021 | Human | Colorectum | FAP | 2.62e-04 | 3.73e-01 | 0.1171 |
| 23024 | PDZRN3 | A002-C-205 | Human | Colorectum | FAP | 2.86e-16 | -5.55e-01 | -0.1236 |
| 23024 | PDZRN3 | A015-C-006 | Human | Colorectum | FAP | 7.35e-05 | -3.08e-01 | -0.0994 |
| 23024 | PDZRN3 | A002-C-114 | Human | Colorectum | FAP | 1.68e-12 | -4.98e-01 | -0.1561 |
| 23024 | PDZRN3 | A015-C-104 | Human | Colorectum | FAP | 1.37e-12 | -3.91e-01 | -0.1899 |
| 23024 | PDZRN3 | A001-C-014 | Human | Colorectum | FAP | 1.38e-04 | -2.81e-01 | 0.0135 |
| 23024 | PDZRN3 | A002-C-016 | Human | Colorectum | FAP | 6.56e-06 | -3.33e-01 | 0.0521 |
| 23024 | PDZRN3 | A015-C-002 | Human | Colorectum | FAP | 9.41e-06 | -4.18e-01 | -0.0763 |
| 23024 | PDZRN3 | A001-C-203 | Human | Colorectum | FAP | 2.38e-02 | -1.93e-01 | -0.0481 |
| Page: 1 2 3 |
| Tissue | Expression Dynamics | Abbreviation |
| Colorectum (GSE201348) |  | FAP: Familial adenomatous polyposis |
| CRC: Colorectal cancer | ||
| Colorectum (HTA11) |  | AD: Adenomas |
| SER: Sessile serrated lesions | ||
| MSI-H: Microsatellite-high colorectal cancer | ||
| MSS: Microsatellite stable colorectal cancer | ||
| Esophagus | 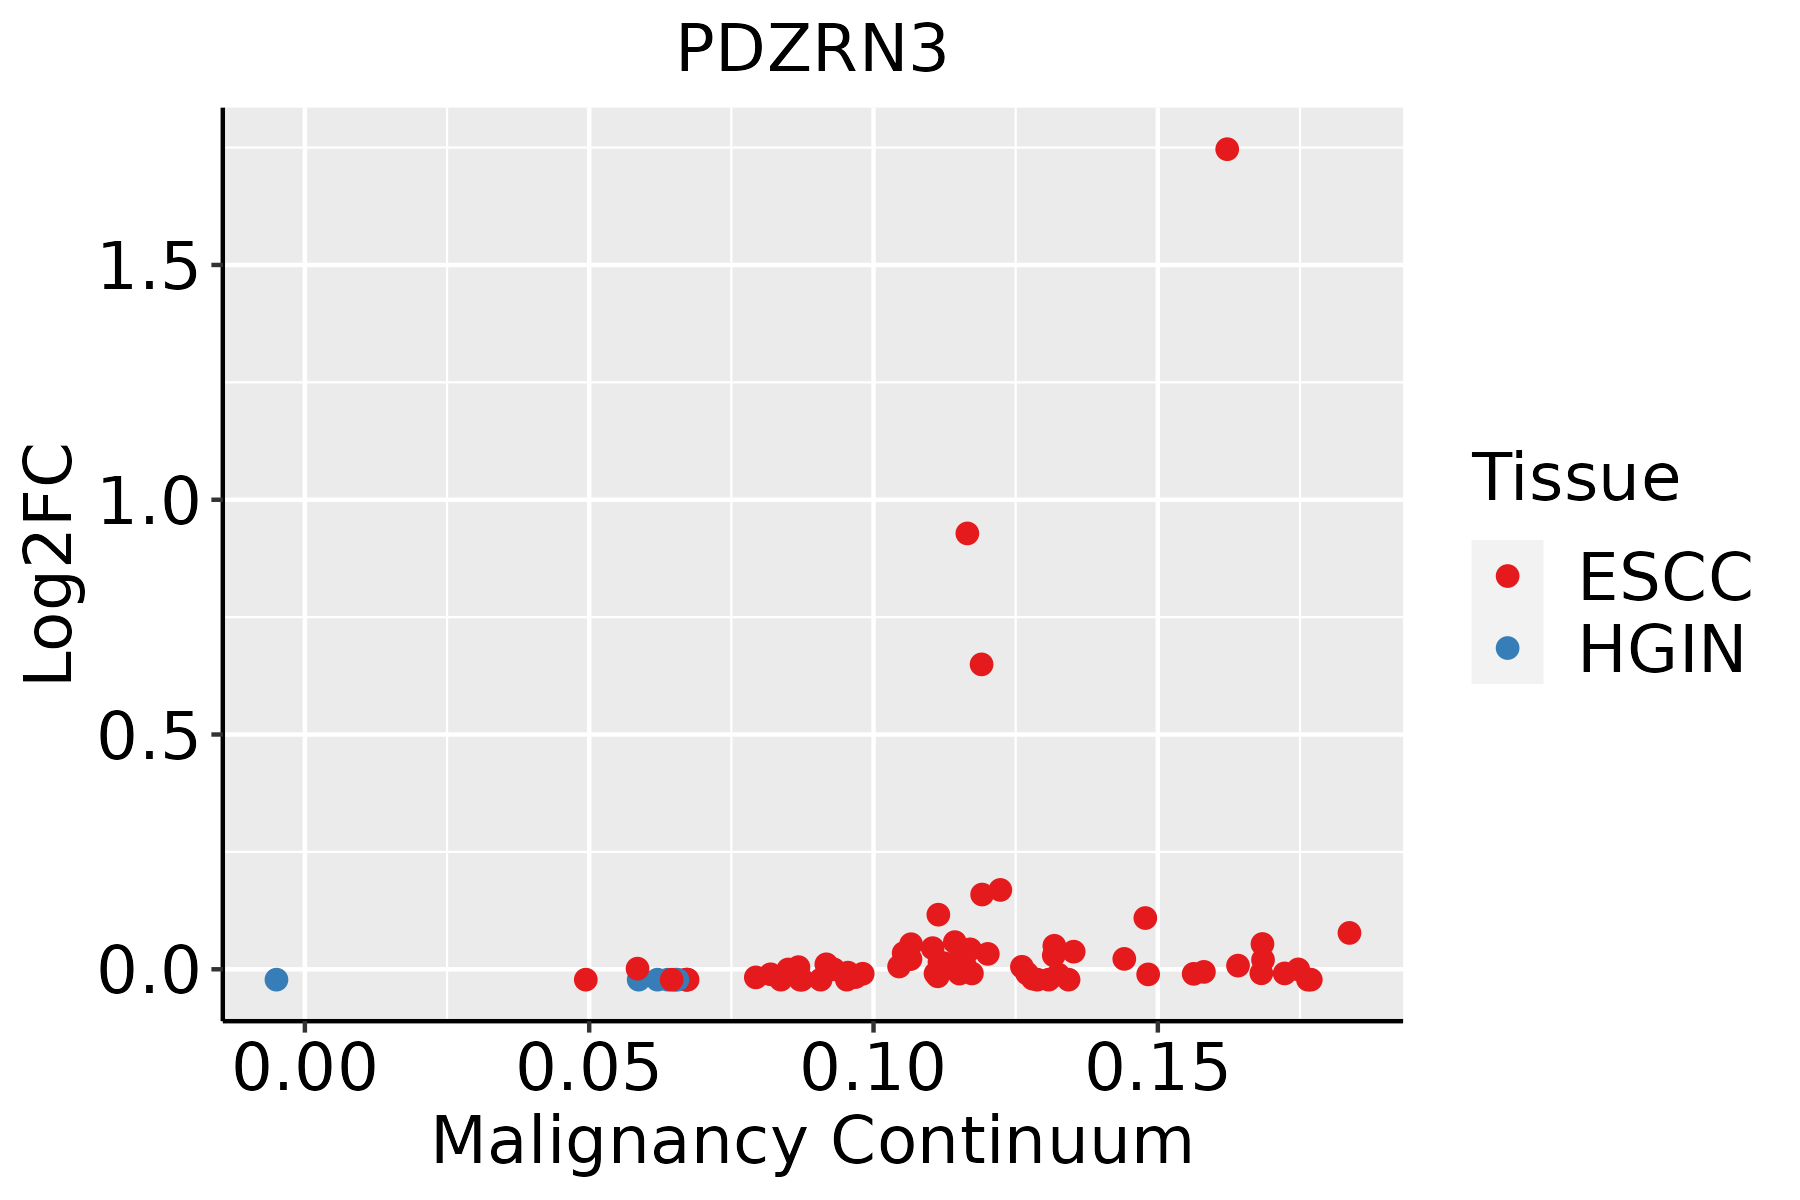 | ESCC: Esophageal squamous cell carcinoma |
| HGIN: High-grade intraepithelial neoplasias | ||
| LGIN: Low-grade intraepithelial neoplasias | ||
| Liver | 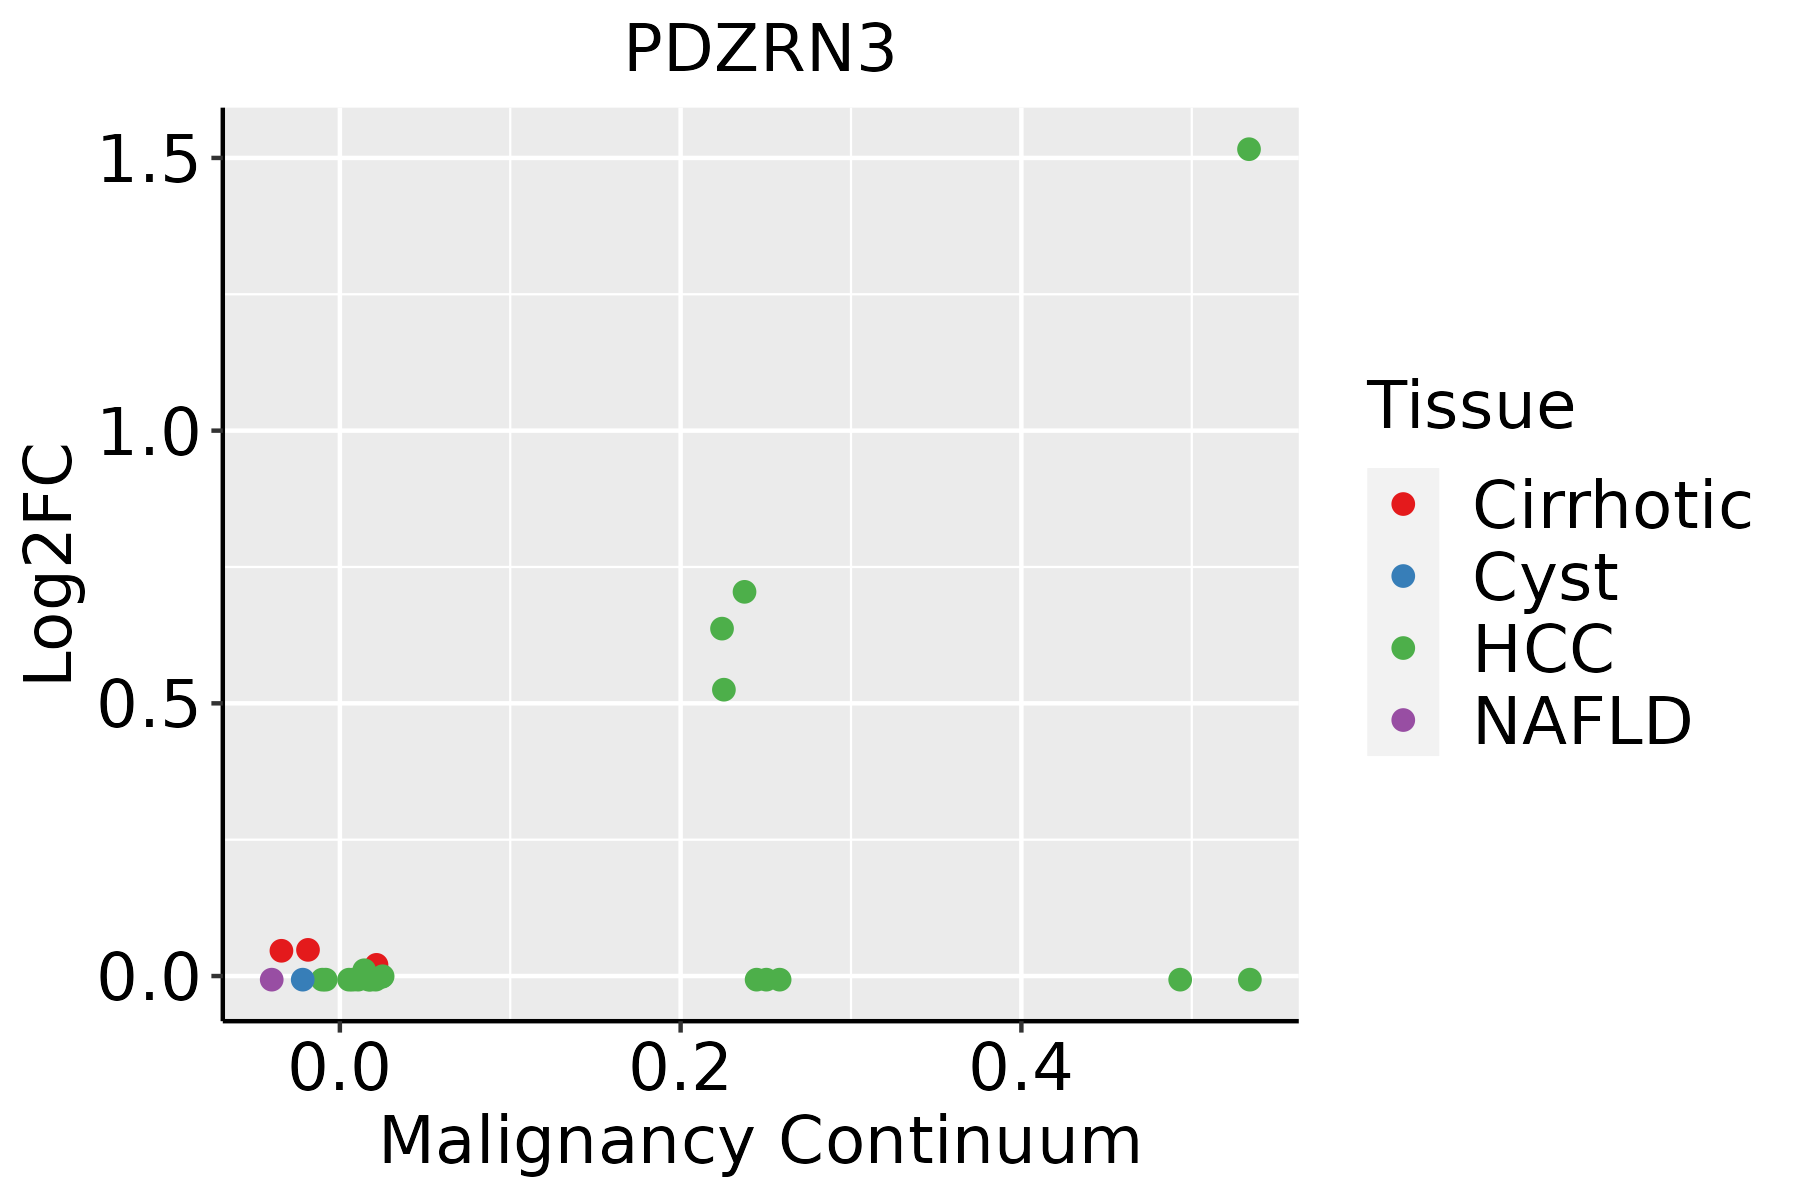 | HCC: Hepatocellular carcinoma |
| NAFLD: Non-alcoholic fatty liver disease | ||
| Prostate | 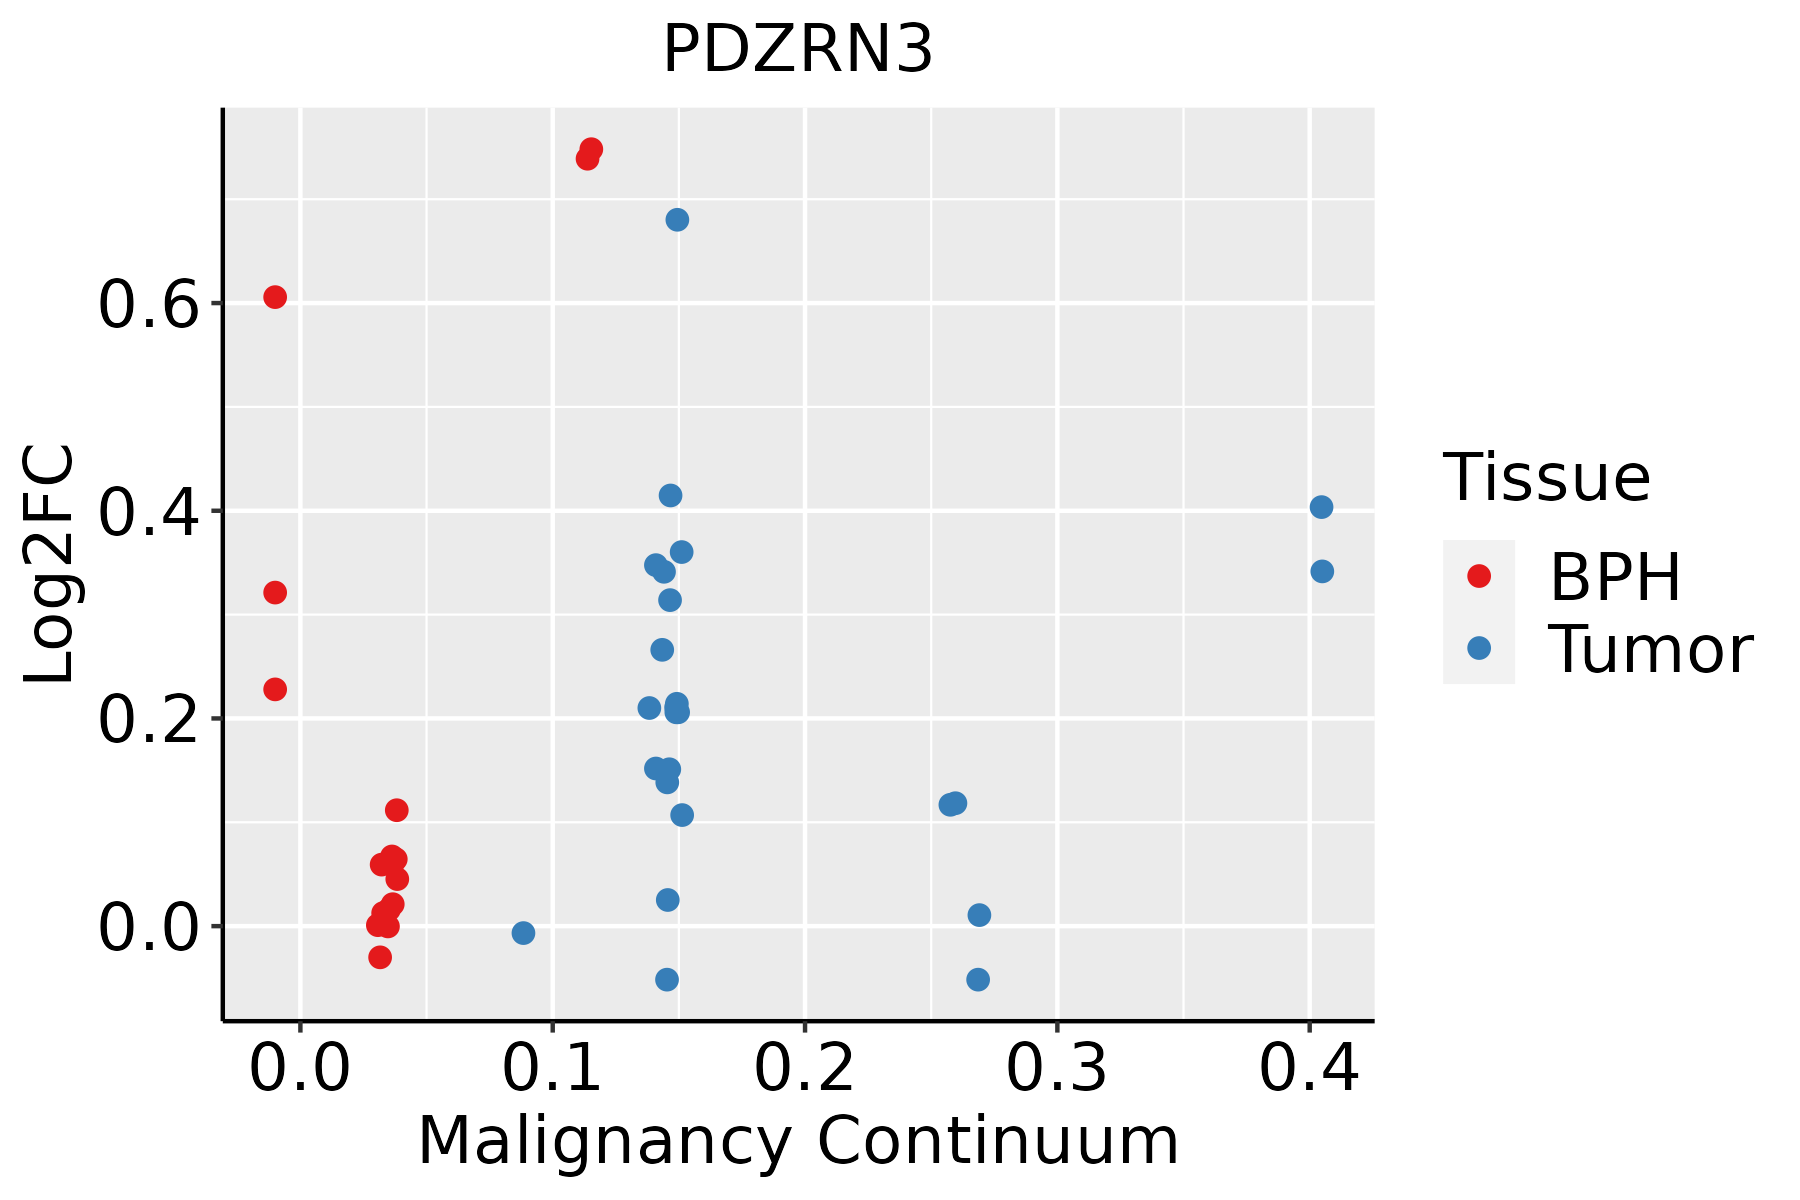 | BPH: Benign Prostatic Hyperplasia |
| ∗log2FC in expression of this searched gene in stem-like cells from each diseased tissue sample relative to stem-like cells in normal samples in each tissue plotted against the malignancy continuum. Samples are colored based on if they are from different disease stage. |
Top |
Malignant transformation related pathway analysis |
| Find out the enriched GO biological processes and KEGG pathways involved in transition from healthy to precancer to cancer |
| Tissue | Disease Stage | Enriched GO biological Processes |
| Colorectum | AD |  |
| Colorectum | SER |  |
| Colorectum | MSS |  |
| Colorectum | MSI-H |  |
| Colorectum | FAP |  |
| ∗Top 15 enriched GO BP terms are showed in the bar plot of each disease state in each tissue. Each row represents a significant GO biological process which is colored according to the -log10(p.adjust). |
| Page: 1 2 3 4 5 6 7 8 9 |
| GO ID | Tissue | Disease Stage | Description | Gene Ratio | Bg Ratio | pvalue | p.adjust | Count |
| GO:0050808 | Colorectum | AD | synapse organization | 112/3918 | 426/18723 | 4.25e-03 | 2.92e-02 | 112 |
| GO:00508081 | Colorectum | SER | synapse organization | 85/2897 | 426/18723 | 7.17e-03 | 4.99e-02 | 85 |
| GO:00508082 | Colorectum | MSS | synapse organization | 101/3467 | 426/18723 | 3.96e-03 | 2.89e-02 | 101 |
| GO:00508083 | Colorectum | FAP | synapse organization | 91/2622 | 426/18723 | 1.90e-05 | 4.74e-04 | 91 |
| GO:00508084 | Colorectum | CRC | synapse organization | 71/2078 | 426/18723 | 3.02e-04 | 4.76e-03 | 71 |
| GO:00508087 | Prostate | BPH | synapse organization | 103/3107 | 426/18723 | 3.19e-05 | 3.61e-04 | 103 |
| GO:005080813 | Prostate | Tumor | synapse organization | 105/3246 | 426/18723 | 7.20e-05 | 7.62e-04 | 105 |
| Page: 1 |
| Pathway ID | Tissue | Disease Stage | Description | Gene Ratio | Bg Ratio | pvalue | p.adjust | qvalue | Count |
| Page: 1 |
Top |
Cell-cell communication analysis |
| Identification of potential cell-cell interactions between two cell types and their ligand-receptor pairs for different disease states |
| Ligand | Receptor | LRpair | Pathway | Tissue | Disease Stage |
| Page: 1 |
Top |
Single-cell gene regulatory network inference analysis |
| Find out the significant the regulons (TFs) and the target genes of each regulon across cell types for different disease states |
| TF | Cell Type | Tissue | Disease Stage | Target Gene | RSS | Regulon Activity |
| ∗The dot plots of a searched regulon are shown for all cell subpopulations in each disease state of each tissue based on the regulon specific score inferred using pySCENIC and by calculating the average expression. |
| Page: 1 |
Top |
Somatic mutation of malignant transformation related genes |
| Annotation of somatic variants for genes involved in malignant transformation |
| Hugo Symbol | Variant Class | Variant Classification | dbSNP RS | HGVSc | HGVSp | HGVSp Short | SWISSPROT | BIOTYPE | SIFT | PolyPhen | Tumor Sample Barcode | Tissue | Histology | Sex | Age | Stage | Therapy Types | Drugs | Outcome |
| PDZRN3 | SNV | Missense_Mutation | c.1939N>T | p.Arg647Cys | p.R647C | Q9UPQ7 | protein_coding | deleterious(0) | possibly_damaging(0.739) | TCGA-A2-A04X-01 | Breast | breast invasive carcinoma | Female | <65 | I/II | Chemotherapy | adriamycin | SD | |
| PDZRN3 | SNV | Missense_Mutation | c.1162G>A | p.Glu388Lys | p.E388K | Q9UPQ7 | protein_coding | tolerated(0.23) | probably_damaging(0.991) | TCGA-A2-A0YH-01 | Breast | breast invasive carcinoma | Female | <65 | III/IV | Chemotherapy | adriamycin | SD | |
| PDZRN3 | SNV | Missense_Mutation | rs761434170 | c.818A>G | p.His273Arg | p.H273R | Q9UPQ7 | protein_coding | tolerated(0.24) | benign(0) | TCGA-A2-A3Y0-01 | Breast | breast invasive carcinoma | Female | <65 | I/II | Chemotherapy | adriamycin | CR |
| PDZRN3 | SNV | Missense_Mutation | c.1938N>A | p.Phe646Leu | p.F646L | Q9UPQ7 | protein_coding | deleterious(0.01) | possibly_damaging(0.628) | TCGA-AC-A23H-01 | Breast | breast invasive carcinoma | Female | >=65 | I/II | Unknown | Unknown | PD | |
| PDZRN3 | SNV | Missense_Mutation | rs758508133 | c.1771N>A | p.Asp591Asn | p.D591N | Q9UPQ7 | protein_coding | deleterious(0.02) | benign(0.142) | TCGA-AN-A0XS-01 | Breast | breast invasive carcinoma | Female | <65 | III/IV | Unknown | Unknown | SD |
| PDZRN3 | SNV | Missense_Mutation | c.2833N>A | p.Glu945Lys | p.E945K | Q9UPQ7 | protein_coding | deleterious(0.01) | probably_damaging(0.991) | TCGA-AO-A03V-01 | Breast | breast invasive carcinoma | Female | <65 | I/II | Chemotherapy | fluorouracil | SD | |
| PDZRN3 | SNV | Missense_Mutation | novel | c.1997N>G | p.Tyr666Cys | p.Y666C | Q9UPQ7 | protein_coding | tolerated(0.08) | benign(0.001) | TCGA-AO-A128-01 | Breast | breast invasive carcinoma | Female | <65 | I/II | Chemotherapy | doxorubicin | SD |
| PDZRN3 | SNV | Missense_Mutation | rs755552126 | c.3154G>A | p.Asp1052Asn | p.D1052N | Q9UPQ7 | protein_coding | deleterious(0) | possibly_damaging(0.706) | TCGA-AR-A1AV-01 | Breast | breast invasive carcinoma | Male | >=65 | I/II | Chemotherapy | cytoxan | SD |
| PDZRN3 | SNV | Missense_Mutation | c.1772N>G | p.Asp591Gly | p.D591G | Q9UPQ7 | protein_coding | deleterious(0.03) | benign(0.136) | TCGA-BH-A18G-01 | Breast | breast invasive carcinoma | Female | >=65 | I/II | Unknown | Unknown | SD | |
| PDZRN3 | insertion | In_Frame_Ins | novel | c.2872_2873insAGTTTAAAGCATGTTTGC | p.Thr958delinsLysPheLysAlaCysLeuPro | p.T958delinsKFKACLP | Q9UPQ7 | protein_coding | TCGA-A8-A0A4-01 | Breast | breast invasive carcinoma | Female | >=65 | I/II | Hormone Therapy | tamoxiphen | CR |
| Page: 1 2 3 4 5 6 7 8 9 10 11 12 13 14 15 16 17 18 |
Top |
Related drugs of malignant transformation related genes |
| Identification of chemicals and drugs interact with genes involved in malignant transfromation |
| (DGIdb 4.0) |
| Entrez ID | Symbol | Category | Interaction Types | Drug Claim Name | Drug Name | PMIDs |
| Page: 1 |

Copyright 2023-Present -The University of Texas Health Science Center at Houston |