
|
|||||
|
 | |
| |
| |
| |
| |
| |
|
Gene: PDZK1 |
Gene summary for PDZK1 |
| Gene information | Species | Human | Gene symbol | PDZK1 | Gene ID | 5174 |
| Gene name | PDZ domain containing 1 | |
| Gene Alias | CAP70 | |
| Cytomap | 1q21.1 | |
| Gene Type | protein-coding | GO ID | GO:0006605 | UniProtAcc | Q5T2W1 |
Top |
Malignant transformation analysis |
| Identification of the aberrant gene expression in precancerous and cancerous lesions by comparing the gene expression of stem-like cells in diseased tissues with normal stem cells |
| Entrez ID | Symbol | Replicates | Species | Organ | Tissue | Adj P-value | Log2FC | Malignancy |
| 5174 | PDZK1 | GSM4909298 | Human | Breast | IDC | 2.16e-08 | 2.25e-01 | 0.1551 |
| 5174 | PDZK1 | NCCBC5 | Human | Breast | DCIS | 1.15e-14 | 6.20e-01 | 0.2046 |
| 5174 | PDZK1 | P3 | Human | Breast | IDC | 6.05e-08 | 4.97e-01 | 0.1542 |
| 5174 | PDZK1 | S43 | Human | Liver | Cirrhotic | 2.24e-04 | -2.19e-01 | -0.0187 |
| 5174 | PDZK1 | HCC1_Meng | Human | Liver | HCC | 9.46e-57 | -6.23e-02 | 0.0246 |
| 5174 | PDZK1 | HCC2_Meng | Human | Liver | HCC | 6.41e-04 | -2.63e-01 | 0.0107 |
| 5174 | PDZK1 | cirrhotic1 | Human | Liver | Cirrhotic | 4.40e-04 | 1.03e-01 | 0.0202 |
| 5174 | PDZK1 | cirrhotic2 | Human | Liver | Cirrhotic | 6.21e-08 | 1.31e-01 | 0.0201 |
| 5174 | PDZK1 | HCC1 | Human | Liver | HCC | 1.48e-11 | 3.98e+00 | 0.5336 |
| 5174 | PDZK1 | S014 | Human | Liver | HCC | 1.74e-17 | 1.19e+00 | 0.2254 |
| 5174 | PDZK1 | S015 | Human | Liver | HCC | 3.10e-18 | 1.53e+00 | 0.2375 |
| 5174 | PDZK1 | S016 | Human | Liver | HCC | 2.42e-24 | 1.36e+00 | 0.2243 |
| 5174 | PDZK1 | S027 | Human | Liver | HCC | 1.19e-02 | 7.84e-01 | 0.2446 |
| 5174 | PDZK1 | S028 | Human | Liver | HCC | 2.39e-13 | 8.22e-01 | 0.2503 |
| 5174 | PDZK1 | S029 | Human | Liver | HCC | 3.90e-13 | 1.26e+00 | 0.2581 |
| Page: 1 |
| Tissue | Expression Dynamics | Abbreviation |
| Breast | 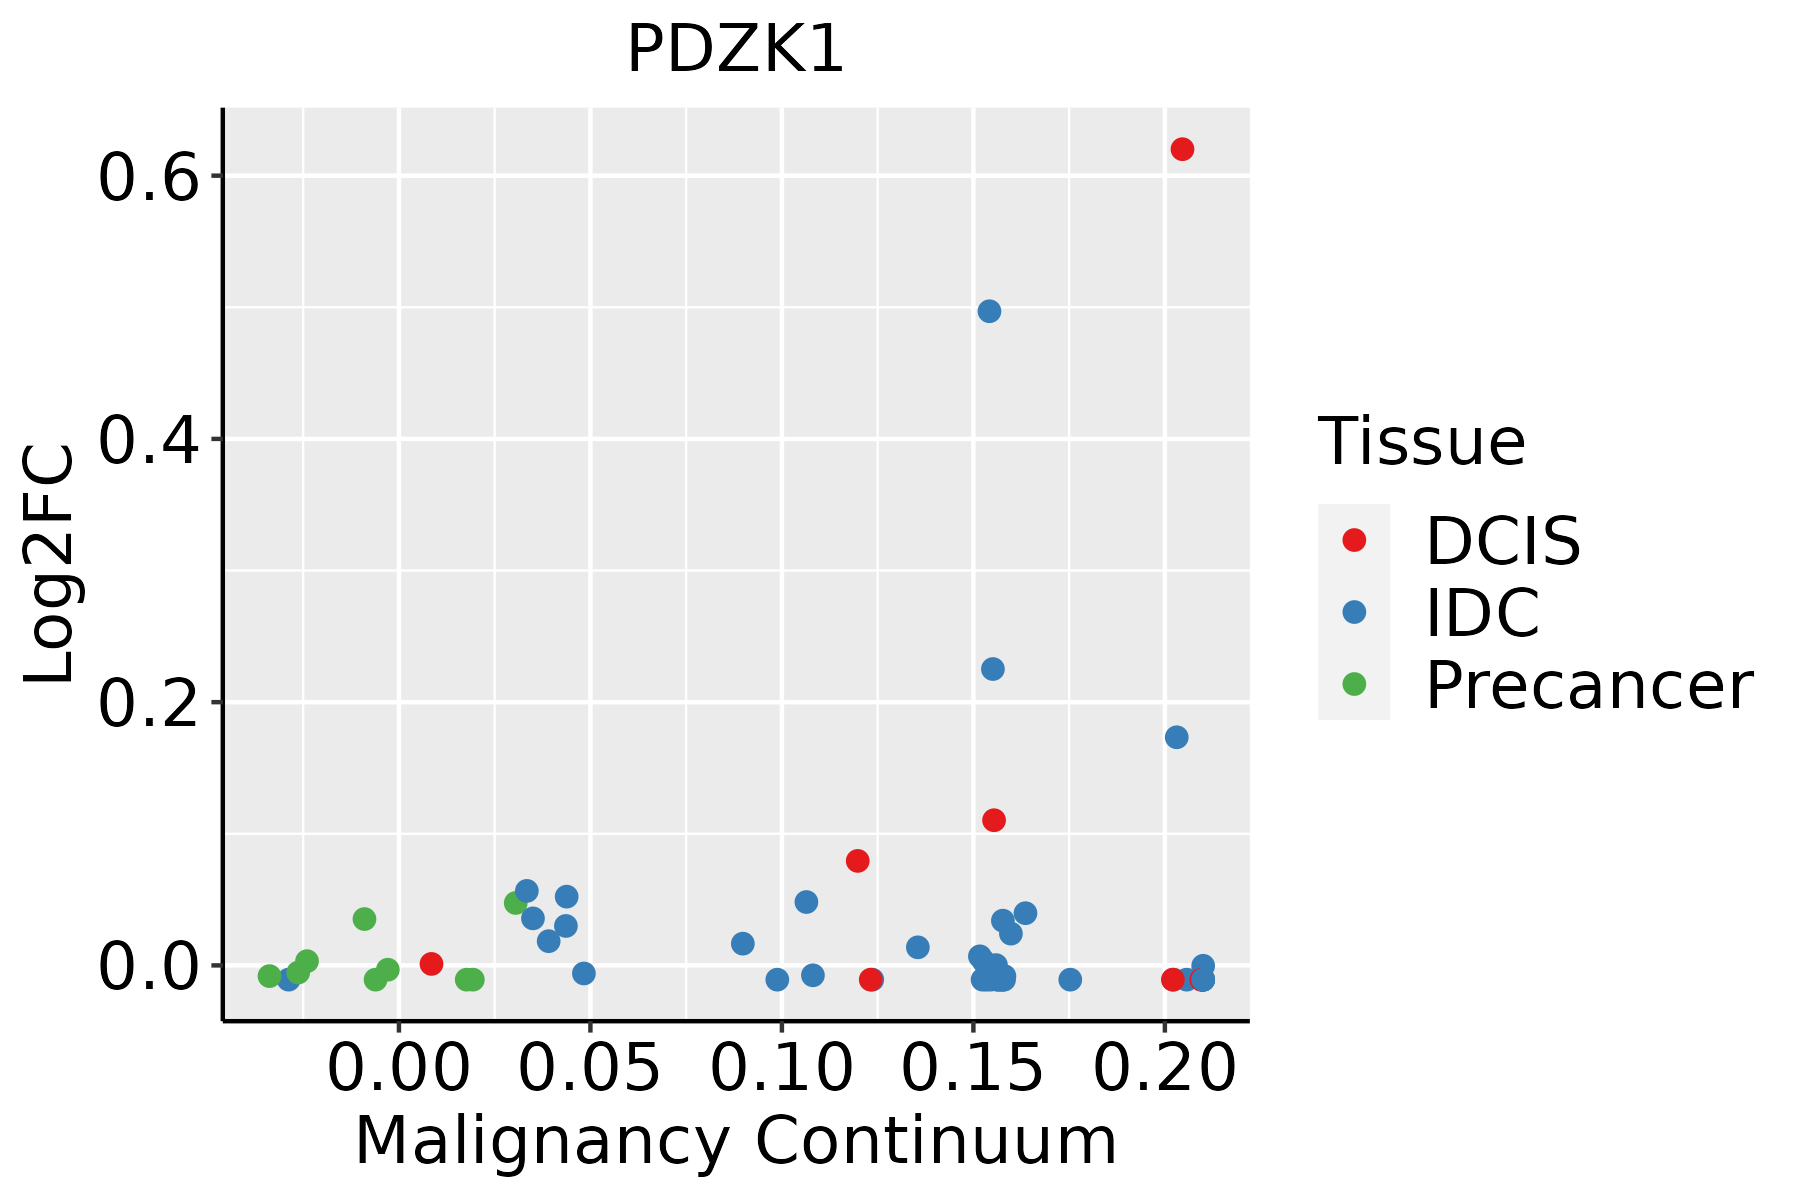 | IDC: Invasive ductal carcinoma |
| DCIS: Ductal carcinoma in situ | ||
| Precancer(BRCA1-mut): Precancerous lesion from BRCA1 mutation carriers | ||
| Liver | 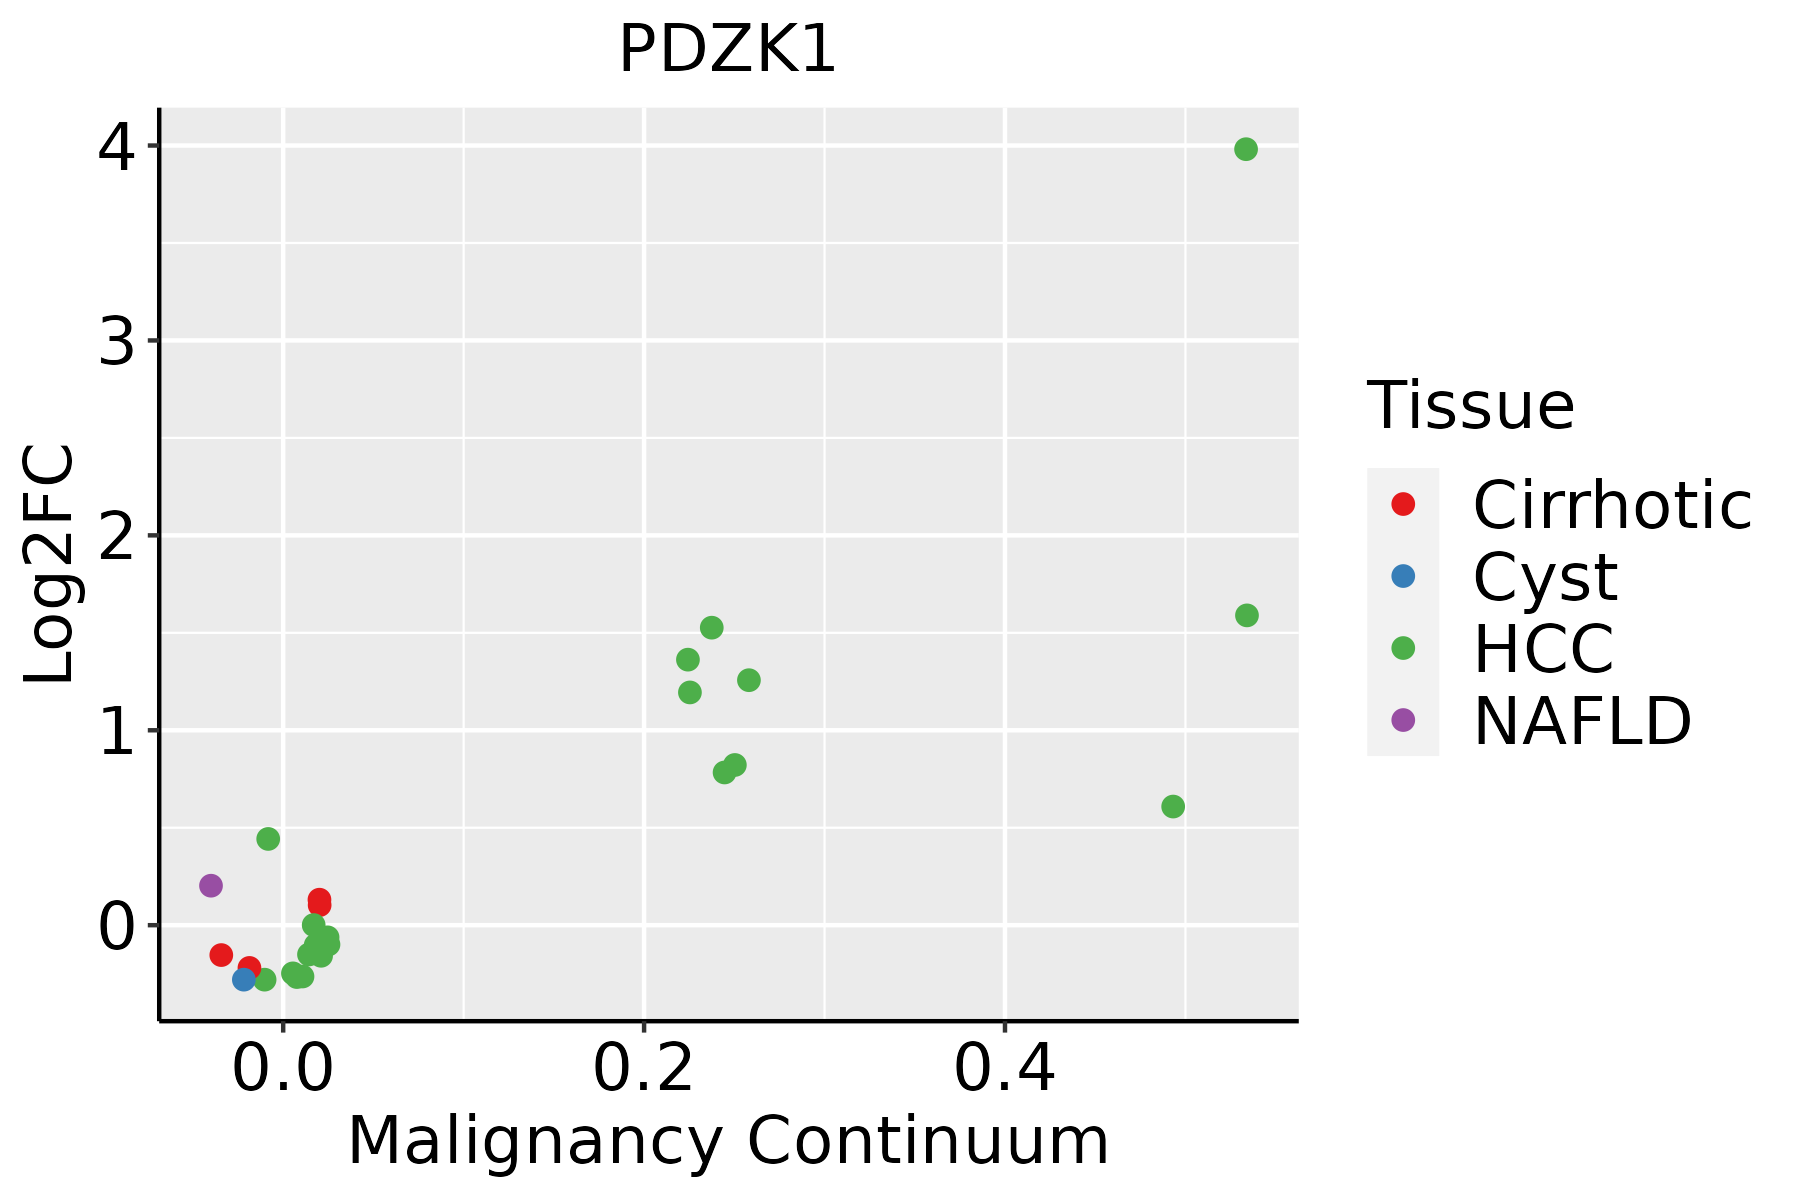 | HCC: Hepatocellular carcinoma |
| NAFLD: Non-alcoholic fatty liver disease |
| ∗log2FC in expression of this searched gene in stem-like cells from each diseased tissue sample relative to stem-like cells in normal samples in each tissue plotted against the malignancy continuum. Samples are colored based on if they are from different disease stage. |
Top |
Malignant transformation related pathway analysis |
| Find out the enriched GO biological processes and KEGG pathways involved in transition from healthy to precancer to cancer |
| Tissue | Disease Stage | Enriched GO biological Processes |
| Colorectum | AD |  |
| Colorectum | SER |  |
| Colorectum | MSS |  |
| Colorectum | MSI-H |  |
| Colorectum | FAP |  |
| ∗Top 15 enriched GO BP terms are showed in the bar plot of each disease state in each tissue. Each row represents a significant GO biological process which is colored according to the -log10(p.adjust). |
| Page: 1 2 3 4 5 6 7 8 9 |
| GO ID | Tissue | Disease Stage | Description | Gene Ratio | Bg Ratio | pvalue | p.adjust | Count |
| GO:000963613 | Breast | IDC | response to toxic substance | 44/1434 | 262/18723 | 6.33e-07 | 3.00e-05 | 44 |
| GO:009875413 | Breast | IDC | detoxification | 29/1434 | 152/18723 | 3.97e-06 | 1.43e-04 | 29 |
| GO:190495113 | Breast | IDC | positive regulation of establishment of protein localization | 45/1434 | 319/18723 | 5.01e-05 | 1.09e-03 | 45 |
| GO:000660514 | Breast | IDC | protein targeting | 43/1434 | 314/18723 | 1.44e-04 | 2.53e-03 | 43 |
| GO:190547513 | Breast | IDC | regulation of protein localization to membrane | 28/1434 | 175/18723 | 1.56e-04 | 2.71e-03 | 28 |
| GO:005122213 | Breast | IDC | positive regulation of protein transport | 40/1434 | 303/18723 | 5.14e-04 | 6.70e-03 | 40 |
| GO:003241111 | Breast | IDC | positive regulation of transporter activity | 20/1434 | 120/18723 | 7.64e-04 | 9.27e-03 | 20 |
| GO:190547713 | Breast | IDC | positive regulation of protein localization to membrane | 18/1434 | 106/18723 | 1.10e-03 | 1.21e-02 | 18 |
| GO:00432703 | Breast | IDC | positive regulation of ion transport | 36/1434 | 275/18723 | 1.11e-03 | 1.22e-02 | 36 |
| GO:190382914 | Breast | IDC | positive regulation of cellular protein localization | 36/1434 | 276/18723 | 1.19e-03 | 1.28e-02 | 36 |
| GO:002289812 | Breast | IDC | regulation of transmembrane transporter activity | 36/1434 | 278/18723 | 1.35e-03 | 1.40e-02 | 36 |
| GO:003241411 | Breast | IDC | positive regulation of ion transmembrane transporter activity | 18/1434 | 109/18723 | 1.53e-03 | 1.53e-02 | 18 |
| GO:003476711 | Breast | IDC | positive regulation of ion transmembrane transport | 24/1434 | 167/18723 | 2.07e-03 | 1.95e-02 | 24 |
| GO:00324125 | Breast | IDC | regulation of ion transmembrane transporter activity | 33/1434 | 267/18723 | 4.38e-03 | 3.40e-02 | 33 |
| GO:00324096 | Breast | IDC | regulation of transporter activity | 37/1434 | 310/18723 | 4.77e-03 | 3.66e-02 | 37 |
| GO:00331578 | Breast | IDC | regulation of intracellular protein transport | 29/1434 | 229/18723 | 5.16e-03 | 3.84e-02 | 29 |
| GO:00347644 | Breast | IDC | positive regulation of transmembrane transport | 28/1434 | 219/18723 | 5.19e-03 | 3.86e-02 | 28 |
| GO:00726599 | Breast | IDC | protein localization to plasma membrane | 34/1434 | 284/18723 | 6.33e-03 | 4.47e-02 | 34 |
| GO:00323888 | Breast | IDC | positive regulation of intracellular transport | 26/1434 | 202/18723 | 6.33e-03 | 4.47e-02 | 26 |
| GO:000963623 | Breast | DCIS | response to toxic substance | 42/1390 | 262/18723 | 1.76e-06 | 6.56e-05 | 42 |
| Page: 1 2 3 4 |
| Pathway ID | Tissue | Disease Stage | Description | Gene Ratio | Bg Ratio | pvalue | p.adjust | qvalue | Count |
| Page: 1 |
Top |
Cell-cell communication analysis |
| Identification of potential cell-cell interactions between two cell types and their ligand-receptor pairs for different disease states |
| Ligand | Receptor | LRpair | Pathway | Tissue | Disease Stage |
| Page: 1 |
Top |
Single-cell gene regulatory network inference analysis |
| Find out the significant the regulons (TFs) and the target genes of each regulon across cell types for different disease states |
| TF | Cell Type | Tissue | Disease Stage | Target Gene | RSS | Regulon Activity |
| ∗The dot plots of a searched regulon are shown for all cell subpopulations in each disease state of each tissue based on the regulon specific score inferred using pySCENIC and by calculating the average expression. |
| Page: 1 |
Top |
Somatic mutation of malignant transformation related genes |
| Annotation of somatic variants for genes involved in malignant transformation |
| Hugo Symbol | Variant Class | Variant Classification | dbSNP RS | HGVSc | HGVSp | HGVSp Short | SWISSPROT | BIOTYPE | SIFT | PolyPhen | Tumor Sample Barcode | Tissue | Histology | Sex | Age | Stage | Therapy Types | Drugs | Outcome |
| PDZK1 | SNV | Missense_Mutation | novel | c.316N>C | p.Gly106Arg | p.G106R | Q5T2W1 | protein_coding | deleterious(0.02) | benign(0.153) | TCGA-BH-A6R9-01 | Breast | breast invasive carcinoma | Female | <65 | I/II | Unknown | Unknown | SD |
| PDZK1 | SNV | Missense_Mutation | novel | c.859C>A | p.Leu287Met | p.L287M | Q5T2W1 | protein_coding | tolerated(0.16) | possibly_damaging(0.824) | TCGA-2W-A8YY-01 | Cervix | cervical & endocervical cancer | Female | <65 | I/II | Chemotherapy | cisplatin | CR |
| PDZK1 | SNV | Missense_Mutation | c.1532N>T | p.Ser511Phe | p.S511F | Q5T2W1 | protein_coding | deleterious(0) | probably_damaging(0.996) | TCGA-EK-A2R8-01 | Cervix | cervical & endocervical cancer | Female | <65 | I/II | Unknown | Unknown | SD | |
| PDZK1 | SNV | Missense_Mutation | c.1186C>T | p.Arg396Trp | p.R396W | Q5T2W1 | protein_coding | deleterious(0) | possibly_damaging(0.846) | TCGA-AZ-4615-01 | Colorectum | colon adenocarcinoma | Male | >=65 | III/IV | Chemotherapy | xeloda | PD | |
| PDZK1 | SNV | Missense_Mutation | novel | c.1436N>G | p.Asp479Gly | p.D479G | Q5T2W1 | protein_coding | deleterious(0.02) | benign(0.034) | TCGA-CA-6717-01 | Colorectum | colon adenocarcinoma | Male | <65 | I/II | Chemotherapy | oxaliplatin | CR |
| PDZK1 | SNV | Missense_Mutation | c.7N>C | p.Ser3Pro | p.S3P | Q5T2W1 | protein_coding | deleterious(0) | benign(0.018) | TCGA-D5-6540-01 | Colorectum | colon adenocarcinoma | Male | >=65 | I/II | Unknown | Unknown | SD | |
| PDZK1 | SNV | Missense_Mutation | novel | c.725G>A | p.Arg242Gln | p.R242Q | Q5T2W1 | protein_coding | deleterious(0) | possibly_damaging(0.56) | TCGA-AJ-A3EK-01 | Endometrium | uterine corpus endometrioid carcinoma | Female | <65 | I/II | Chemotherapy | carboplatin | CR |
| PDZK1 | SNV | Missense_Mutation | novel | c.1040G>A | p.Gly347Asp | p.G347D | Q5T2W1 | protein_coding | tolerated(0.1) | possibly_damaging(0.493) | TCGA-AP-A051-01 | Endometrium | uterine corpus endometrioid carcinoma | Female | >=65 | I/II | Unknown | Unknown | SD |
| PDZK1 | SNV | Missense_Mutation | c.74G>A | p.Arg25Gln | p.R25Q | Q5T2W1 | protein_coding | deleterious(0) | benign(0.369) | TCGA-AP-A056-01 | Endometrium | uterine corpus endometrioid carcinoma | Female | <65 | I/II | Unknown | Unknown | SD | |
| PDZK1 | SNV | Missense_Mutation | novel | c.1371N>C | p.Lys457Asn | p.K457N | Q5T2W1 | protein_coding | deleterious(0) | benign(0.394) | TCGA-AP-A1DO-01 | Endometrium | uterine corpus endometrioid carcinoma | Female | <65 | I/II | Unknown | Unknown | SD |
| Page: 1 2 3 4 |
Top |
Related drugs of malignant transformation related genes |
| Identification of chemicals and drugs interact with genes involved in malignant transfromation |
| (DGIdb 4.0) |
| Entrez ID | Symbol | Category | Interaction Types | Drug Claim Name | Drug Name | PMIDs |
| Page: 1 |

Copyright 2023-Present -The University of Texas Health Science Center at Houston |