
|
|||||
|
 | |
| |
| |
| |
| |
| |
|
Gene: PDZD8 |
Gene summary for PDZD8 |
| Gene information | Species | Human | Gene symbol | PDZD8 | Gene ID | 118987 |
| Gene name | PDZ domain containing 8 | |
| Gene Alias | PDZK8 | |
| Cytomap | 10q25.3-q26.11 | |
| Gene Type | protein-coding | GO ID | GO:0000902 | UniProtAcc | Q8NEN9 |
Top |
Malignant transformation analysis |
| Identification of the aberrant gene expression in precancerous and cancerous lesions by comparing the gene expression of stem-like cells in diseased tissues with normal stem cells |
| Entrez ID | Symbol | Replicates | Species | Organ | Tissue | Adj P-value | Log2FC | Malignancy |
| 118987 | PDZD8 | HTA11_3410_2000001011 | Human | Colorectum | AD | 3.26e-07 | -5.02e-01 | 0.0155 |
| 118987 | PDZD8 | HTA11_2487_2000001011 | Human | Colorectum | SER | 4.56e-06 | -6.62e-01 | -0.1808 |
| 118987 | PDZD8 | HTA11_3361_2000001011 | Human | Colorectum | AD | 1.99e-03 | -5.89e-01 | -0.1207 |
| 118987 | PDZD8 | HTA11_83_2000001011 | Human | Colorectum | SER | 1.62e-03 | -5.48e-01 | -0.1526 |
| 118987 | PDZD8 | HTA11_696_2000001011 | Human | Colorectum | AD | 6.07e-08 | -4.55e-01 | -0.1464 |
| 118987 | PDZD8 | HTA11_5212_2000001011 | Human | Colorectum | AD | 1.65e-02 | -7.63e-01 | -0.2061 |
| 118987 | PDZD8 | HTA11_8622_2000001021 | Human | Colorectum | SER | 2.21e-04 | -6.51e-01 | 0.0528 |
| 118987 | PDZD8 | HTA11_99999970781_79442 | Human | Colorectum | MSS | 4.92e-24 | -6.51e-01 | 0.294 |
| 118987 | PDZD8 | HTA11_99999971662_82457 | Human | Colorectum | MSS | 2.52e-12 | -5.46e-01 | 0.3859 |
| 118987 | PDZD8 | HTA11_99999974143_84620 | Human | Colorectum | MSS | 1.80e-22 | -6.67e-01 | 0.3005 |
| 118987 | PDZD8 | A001-C-207 | Human | Colorectum | FAP | 3.76e-06 | -4.29e-01 | 0.1278 |
| 118987 | PDZD8 | A015-C-203 | Human | Colorectum | FAP | 1.69e-37 | -5.59e-01 | -0.1294 |
| 118987 | PDZD8 | A015-C-204 | Human | Colorectum | FAP | 6.42e-10 | -5.73e-01 | -0.0228 |
| 118987 | PDZD8 | A014-C-040 | Human | Colorectum | FAP | 4.49e-03 | -3.85e-01 | -0.1184 |
| 118987 | PDZD8 | A002-C-201 | Human | Colorectum | FAP | 6.93e-10 | -2.94e-01 | 0.0324 |
| 118987 | PDZD8 | A001-C-119 | Human | Colorectum | FAP | 3.11e-02 | -3.02e-01 | -0.1557 |
| 118987 | PDZD8 | A001-C-108 | Human | Colorectum | FAP | 5.85e-21 | -4.17e-01 | -0.0272 |
| 118987 | PDZD8 | A002-C-205 | Human | Colorectum | FAP | 4.10e-19 | -4.14e-01 | -0.1236 |
| 118987 | PDZD8 | A001-C-104 | Human | Colorectum | FAP | 2.89e-05 | -3.42e-01 | 0.0184 |
| 118987 | PDZD8 | A015-C-006 | Human | Colorectum | FAP | 4.60e-14 | -4.79e-01 | -0.0994 |
| Page: 1 2 3 4 5 6 7 8 |
| Tissue | Expression Dynamics | Abbreviation |
| Colorectum (GSE201348) |  | FAP: Familial adenomatous polyposis |
| CRC: Colorectal cancer | ||
| Colorectum (HTA11) |  | AD: Adenomas |
| SER: Sessile serrated lesions | ||
| MSI-H: Microsatellite-high colorectal cancer | ||
| MSS: Microsatellite stable colorectal cancer | ||
| Endometrium | 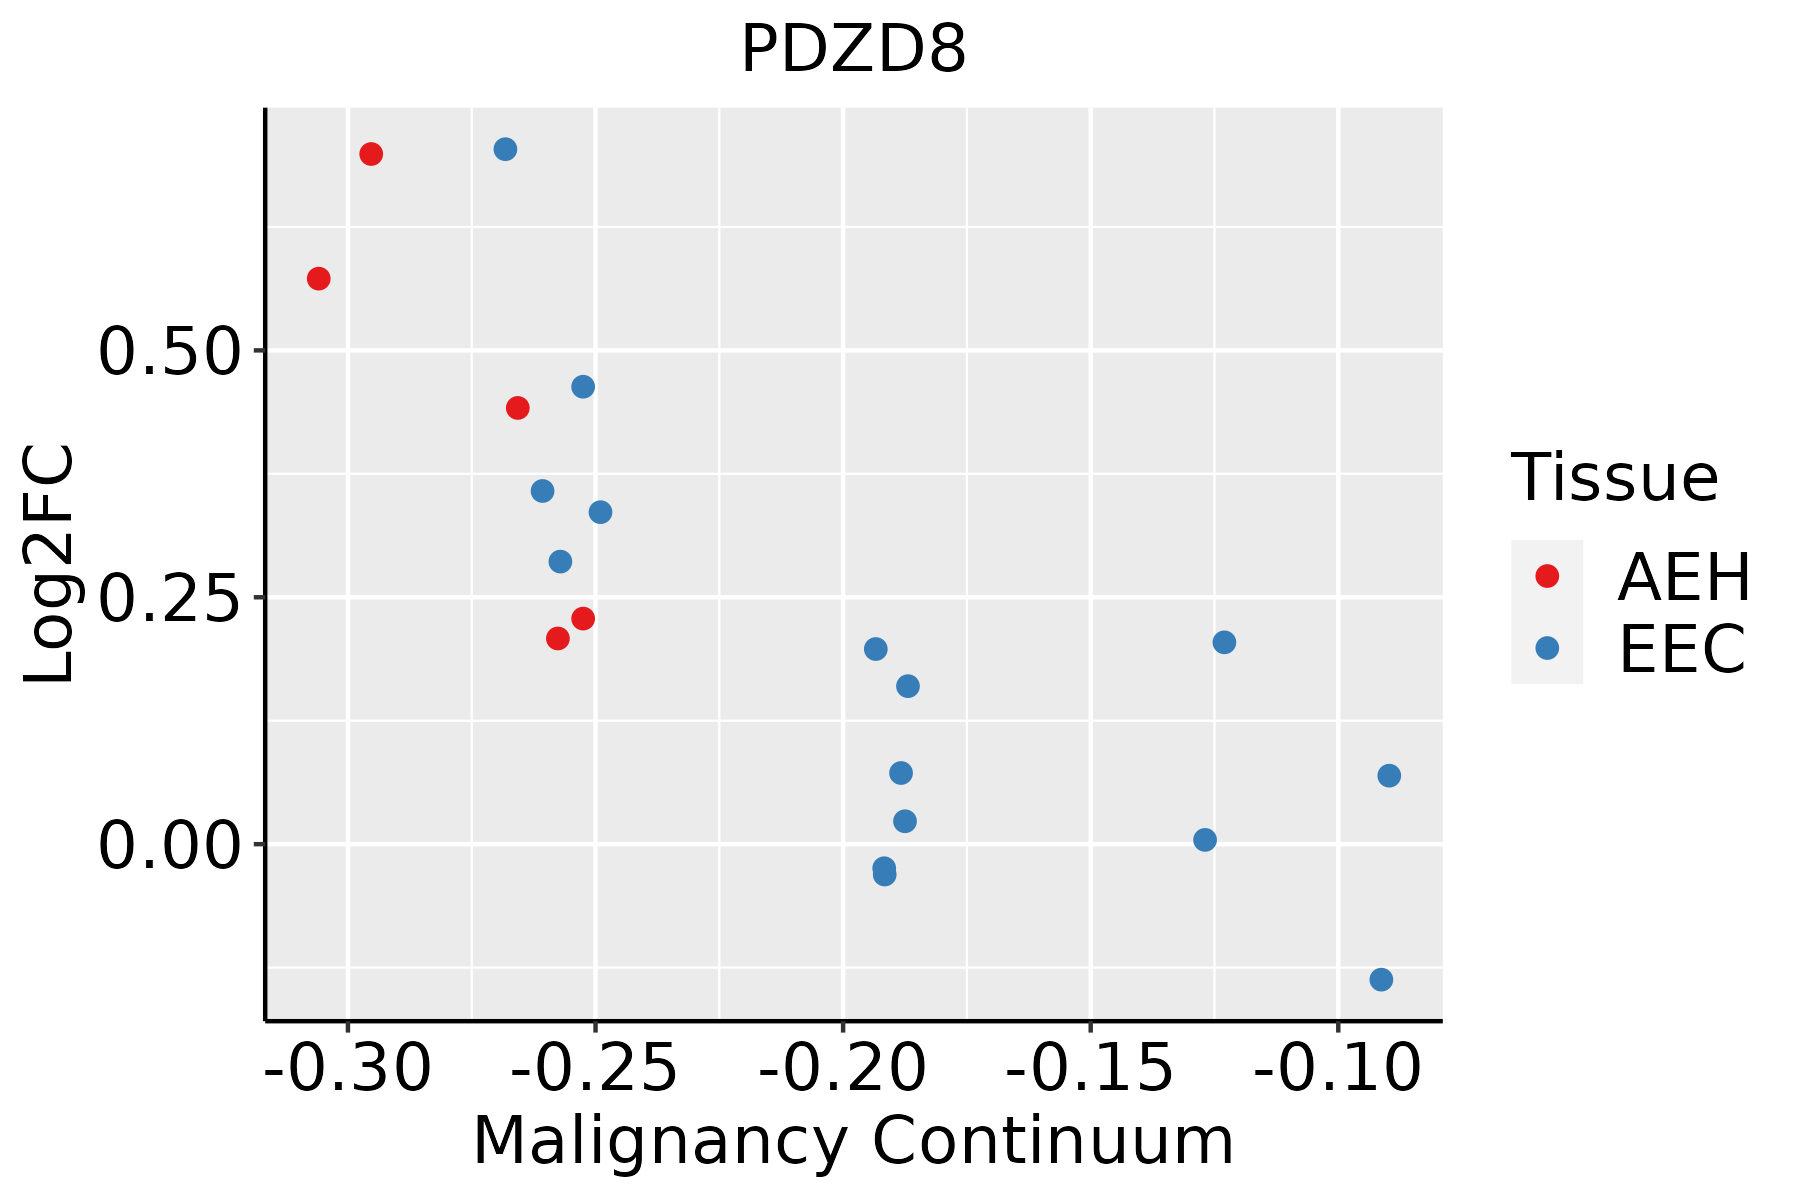 | AEH: Atypical endometrial hyperplasia |
| EEC: Endometrioid Cancer | ||
| Esophagus | 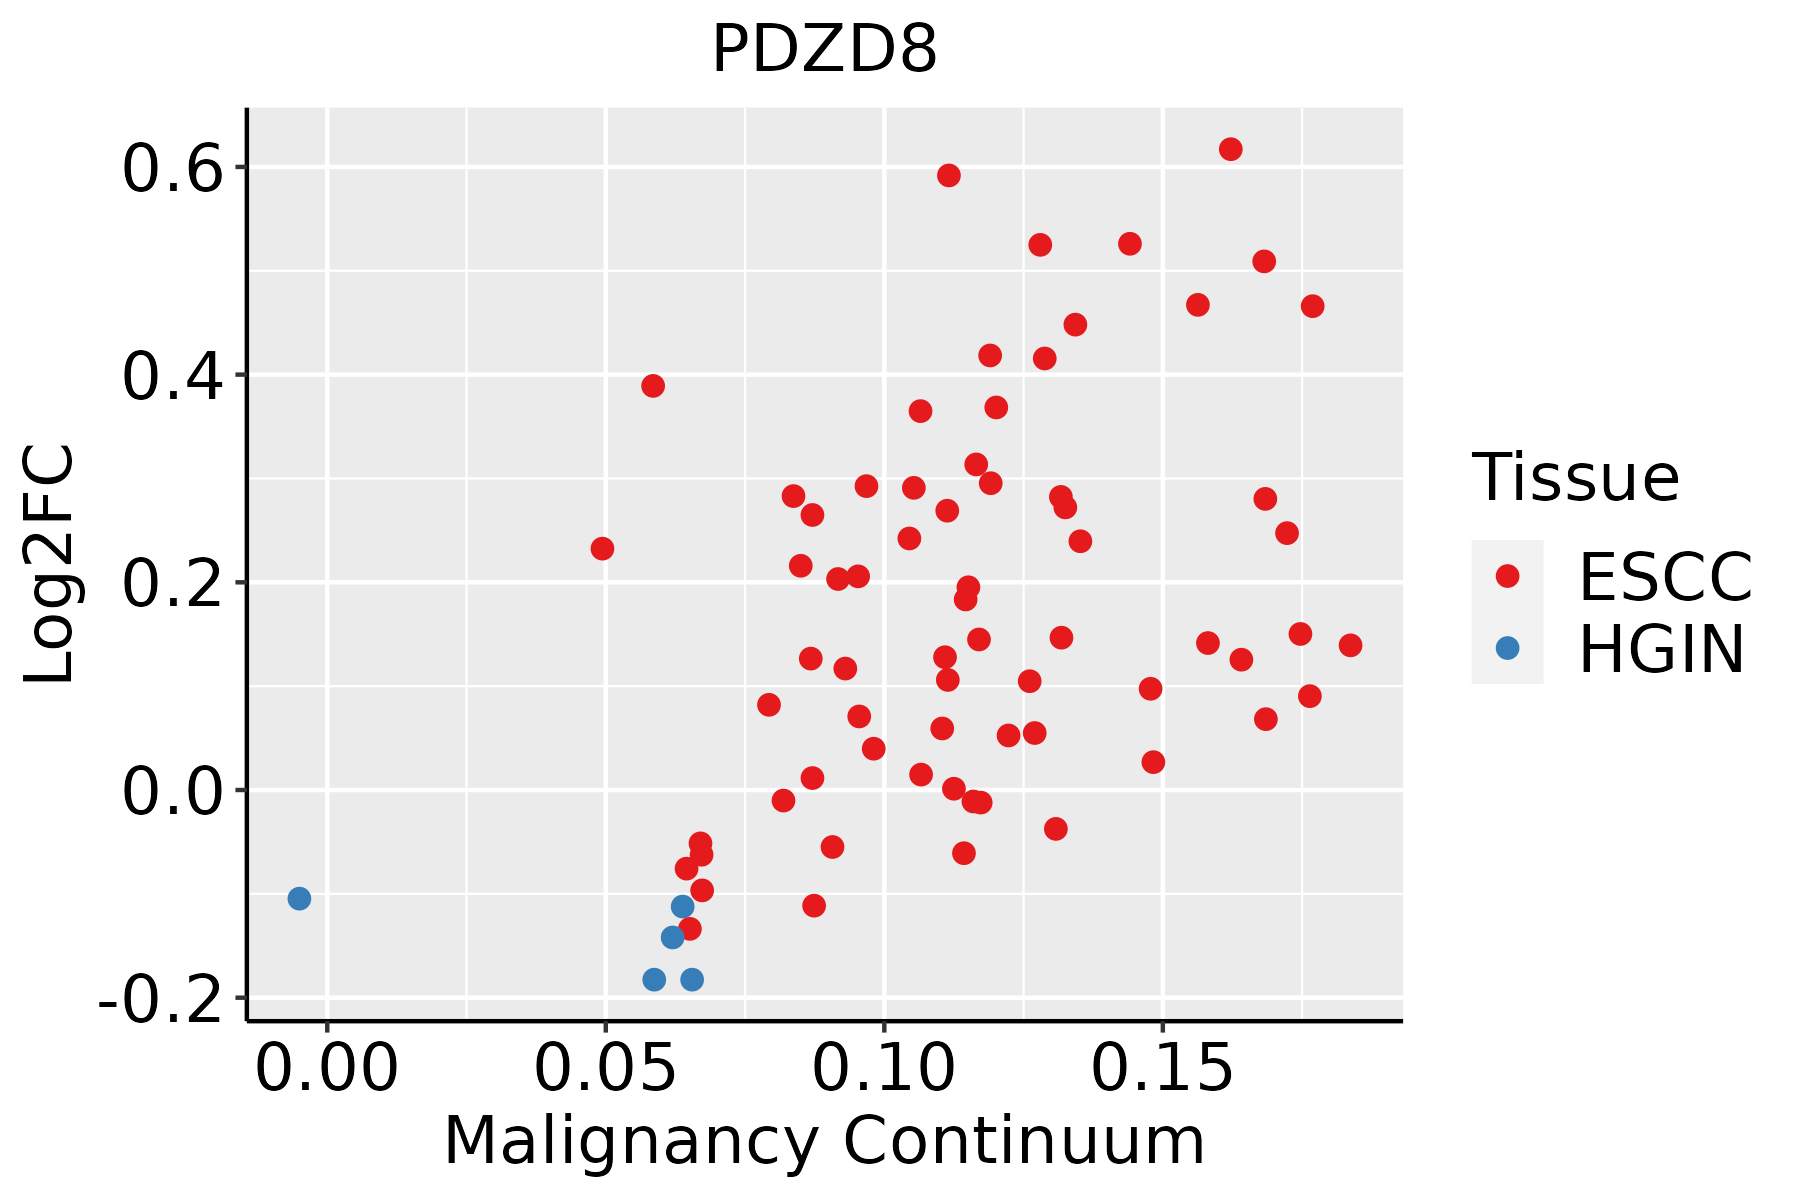 | ESCC: Esophageal squamous cell carcinoma |
| HGIN: High-grade intraepithelial neoplasias | ||
| LGIN: Low-grade intraepithelial neoplasias | ||
| Liver |  | HCC: Hepatocellular carcinoma |
| NAFLD: Non-alcoholic fatty liver disease | ||
| Lung | 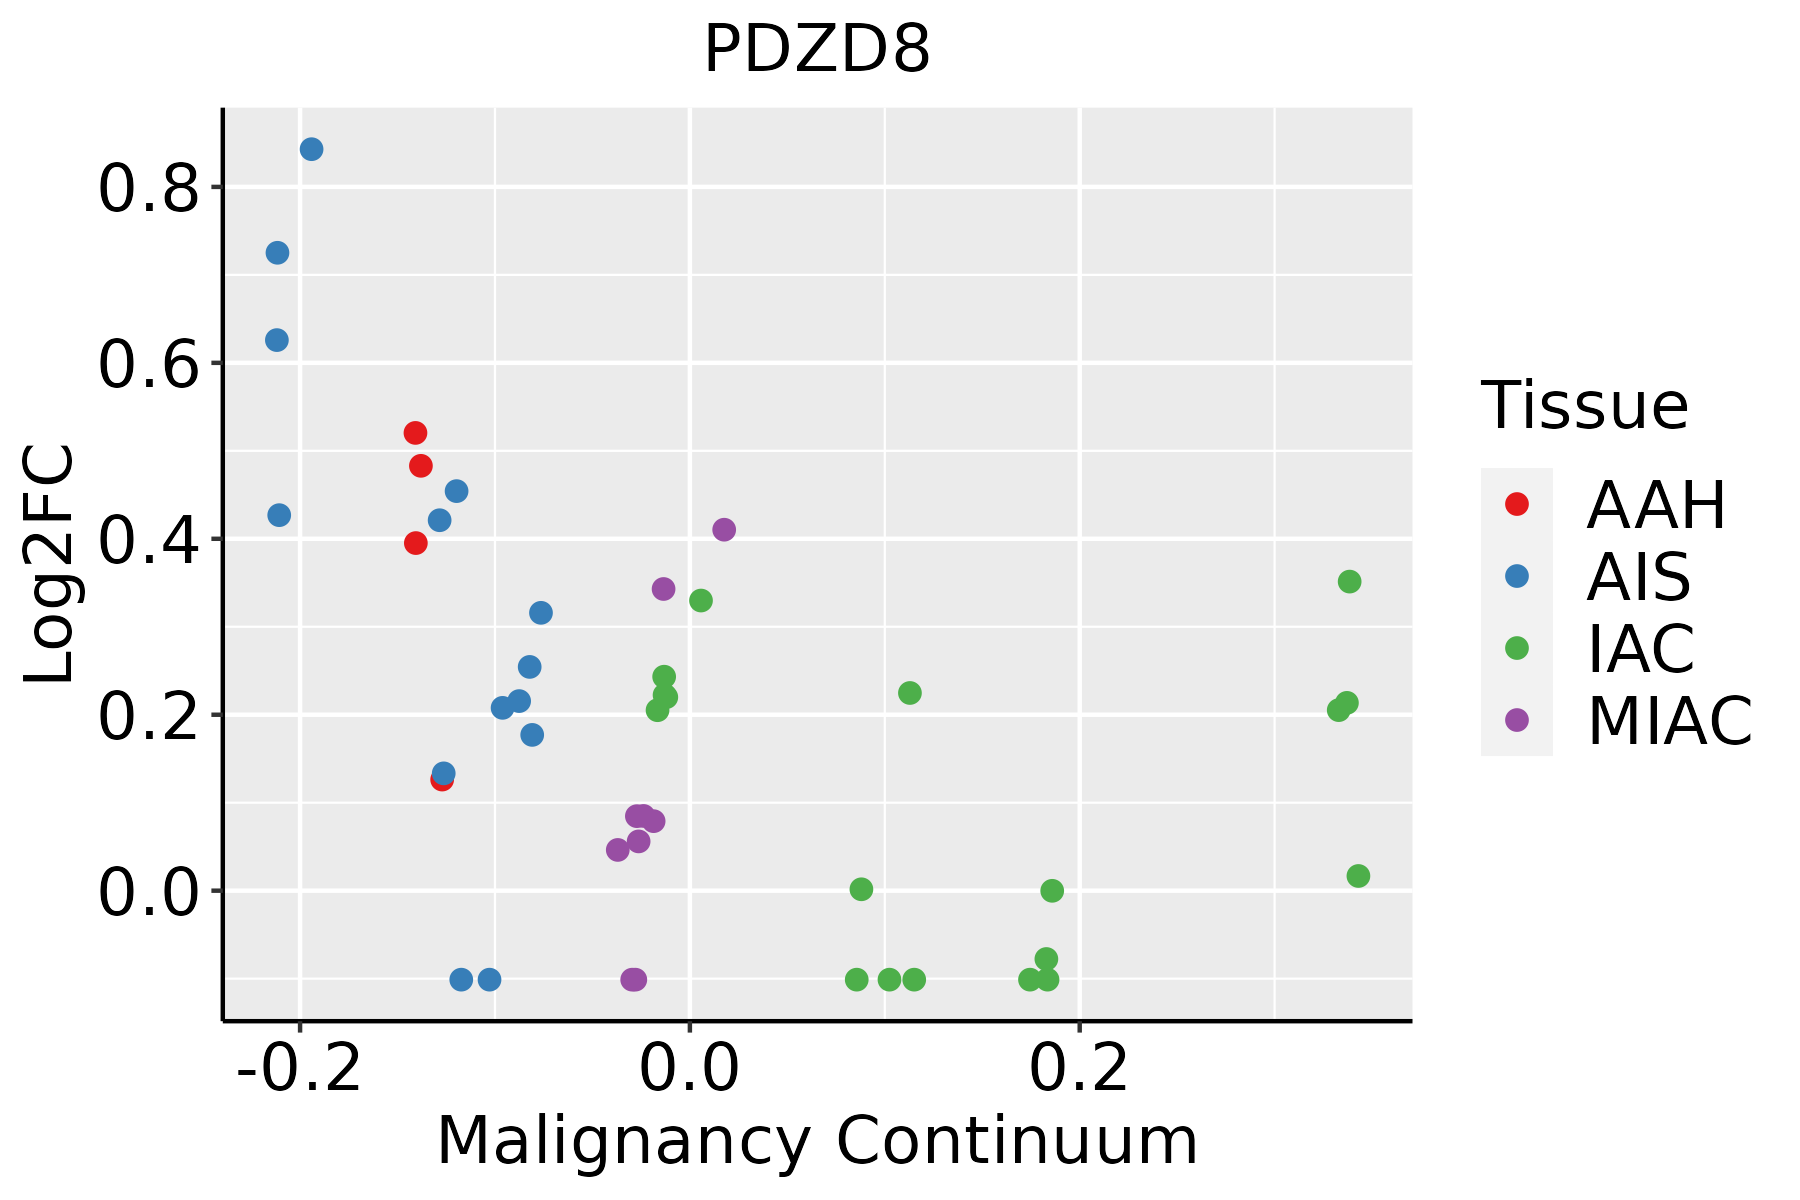 | AAH: Atypical adenomatous hyperplasia |
| AIS: Adenocarcinoma in situ | ||
| IAC: Invasive lung adenocarcinoma | ||
| MIA: Minimally invasive adenocarcinoma | ||
| Oral Cavity | 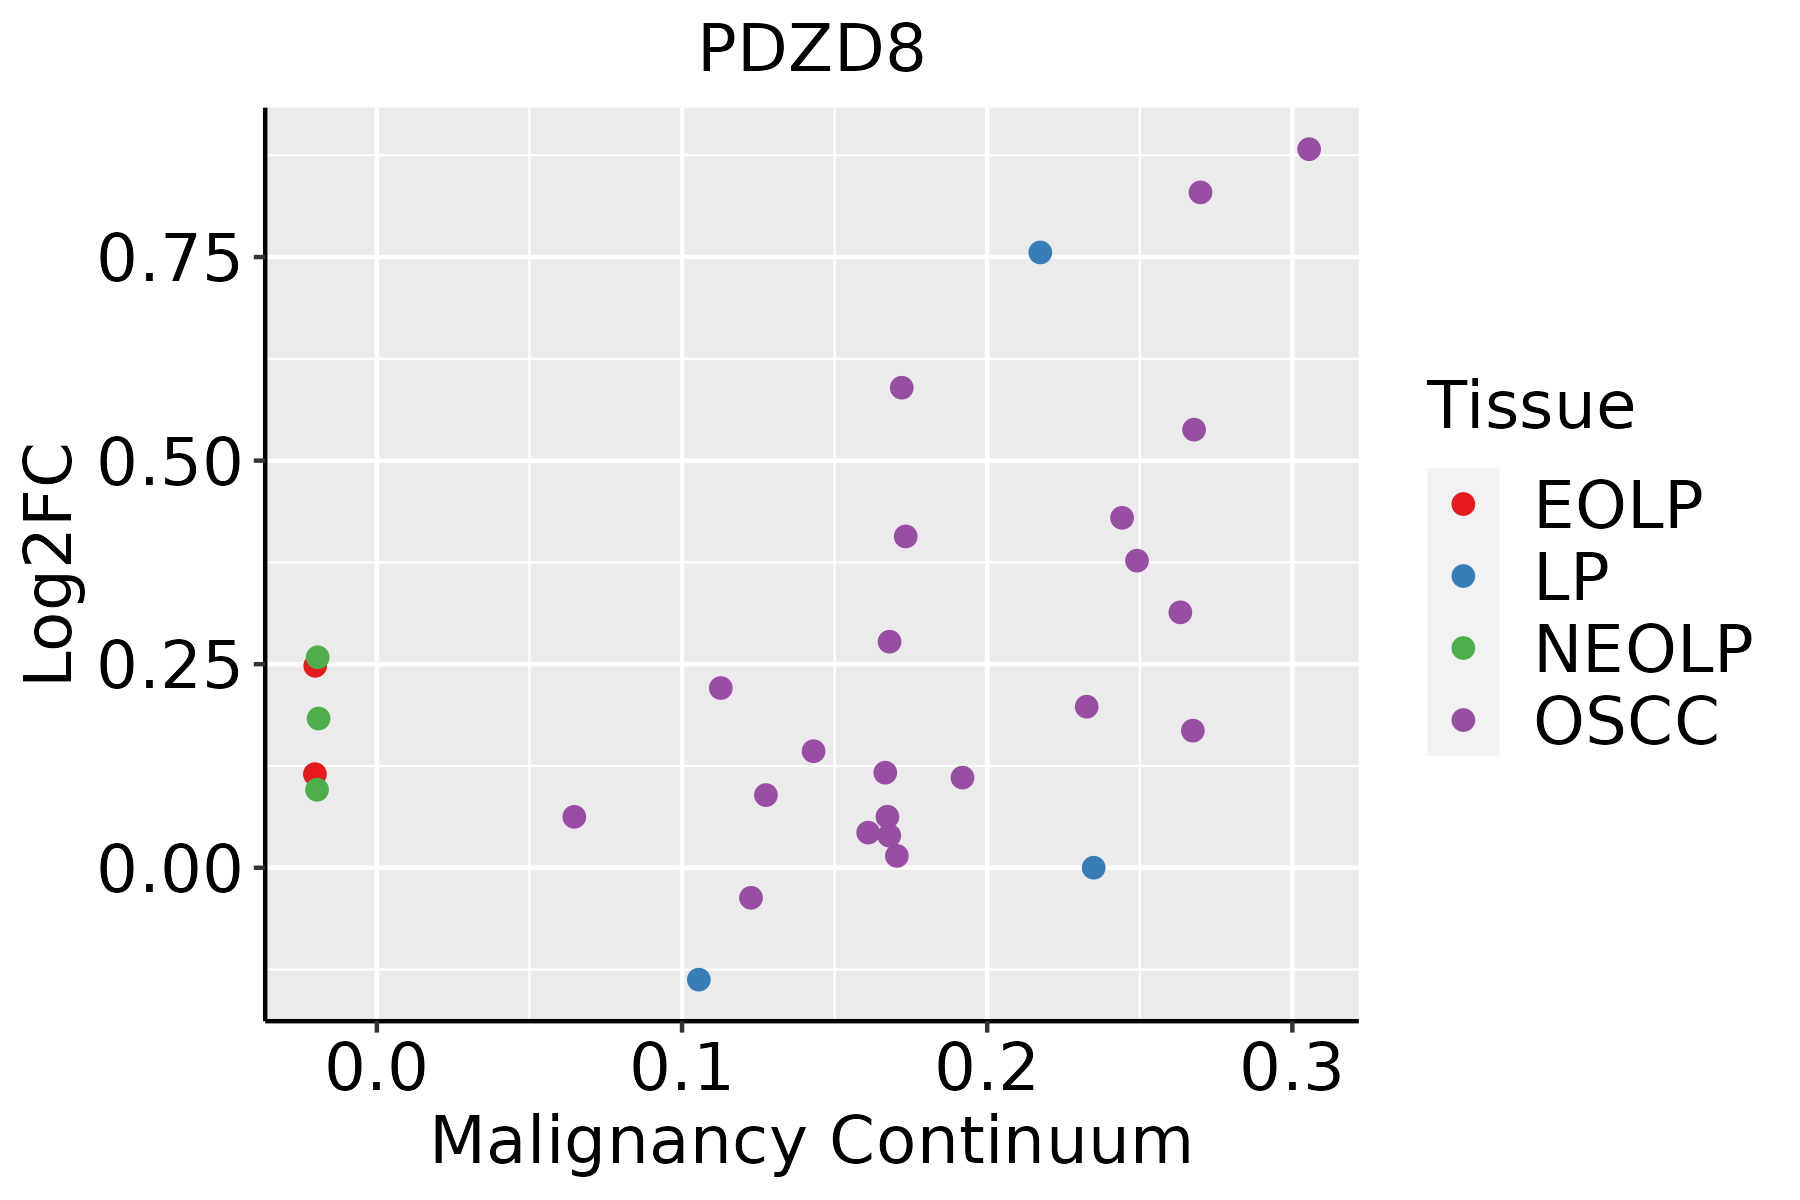 | EOLP: Erosive Oral lichen planus |
| LP: leukoplakia | ||
| NEOLP: Non-erosive oral lichen planus | ||
| OSCC: Oral squamous cell carcinoma | ||
| Thyroid |  | ATC: Anaplastic thyroid cancer |
| HT: Hashimoto's thyroiditis | ||
| PTC: Papillary thyroid cancer |
| ∗log2FC in expression of this searched gene in stem-like cells from each diseased tissue sample relative to stem-like cells in normal samples in each tissue plotted against the malignancy continuum. Samples are colored based on if they are from different disease stage. |
Top |
Malignant transformation related pathway analysis |
| Find out the enriched GO biological processes and KEGG pathways involved in transition from healthy to precancer to cancer |
| Tissue | Disease Stage | Enriched GO biological Processes |
| Colorectum | AD |  |
| Colorectum | SER |  |
| Colorectum | MSS |  |
| Colorectum | MSI-H |  |
| Colorectum | FAP |  |
| ∗Top 15 enriched GO BP terms are showed in the bar plot of each disease state in each tissue. Each row represents a significant GO biological process which is colored according to the -log10(p.adjust). |
| Page: 1 2 3 4 5 6 7 8 9 |
| GO ID | Tissue | Disease Stage | Description | Gene Ratio | Bg Ratio | pvalue | p.adjust | Count |
| GO:0022604 | Colorectum | AD | regulation of cell morphogenesis | 109/3918 | 309/18723 | 3.08e-09 | 2.07e-07 | 109 |
| GO:0022406 | Colorectum | AD | membrane docking | 31/3918 | 86/18723 | 8.67e-04 | 8.45e-03 | 31 |
| GO:0051560 | Colorectum | AD | mitochondrial calcium ion homeostasis | 13/3918 | 26/18723 | 9.41e-04 | 8.92e-03 | 13 |
| GO:0140056 | Colorectum | AD | organelle localization by membrane tethering | 28/3918 | 77/18723 | 1.29e-03 | 1.14e-02 | 28 |
| GO:0010876 | Colorectum | AD | lipid localization | 120/3918 | 448/18723 | 1.59e-03 | 1.33e-02 | 120 |
| GO:0006869 | Colorectum | AD | lipid transport | 108/3918 | 398/18723 | 1.67e-03 | 1.39e-02 | 108 |
| GO:00226041 | Colorectum | SER | regulation of cell morphogenesis | 89/2897 | 309/18723 | 1.51e-09 | 1.52e-07 | 89 |
| GO:00515601 | Colorectum | SER | mitochondrial calcium ion homeostasis | 11/2897 | 26/18723 | 9.60e-04 | 1.15e-02 | 11 |
| GO:00224061 | Colorectum | SER | membrane docking | 25/2897 | 86/18723 | 9.88e-04 | 1.17e-02 | 25 |
| GO:01400561 | Colorectum | SER | organelle localization by membrane tethering | 22/2897 | 77/18723 | 2.46e-03 | 2.32e-02 | 22 |
| GO:00226042 | Colorectum | MSS | regulation of cell morphogenesis | 103/3467 | 309/18723 | 2.70e-10 | 2.56e-08 | 103 |
| GO:00515602 | Colorectum | MSS | mitochondrial calcium ion homeostasis | 12/3467 | 26/18723 | 1.16e-03 | 1.12e-02 | 12 |
| GO:00224062 | Colorectum | MSS | membrane docking | 28/3467 | 86/18723 | 1.27e-03 | 1.21e-02 | 28 |
| GO:01400562 | Colorectum | MSS | organelle localization by membrane tethering | 25/3467 | 77/18723 | 2.34e-03 | 1.91e-02 | 25 |
| GO:00108761 | Colorectum | MSS | lipid localization | 104/3467 | 448/18723 | 6.76e-03 | 4.38e-02 | 104 |
| GO:00226044 | Colorectum | FAP | regulation of cell morphogenesis | 87/2622 | 309/18723 | 4.89e-11 | 1.87e-08 | 87 |
| GO:00068691 | Colorectum | FAP | lipid transport | 81/2622 | 398/18723 | 2.84e-04 | 3.76e-03 | 81 |
| GO:00108762 | Colorectum | FAP | lipid localization | 85/2622 | 448/18723 | 1.92e-03 | 1.63e-02 | 85 |
| GO:00224063 | Colorectum | FAP | membrane docking | 22/2622 | 86/18723 | 3.11e-03 | 2.33e-02 | 22 |
| GO:00515603 | Colorectum | FAP | mitochondrial calcium ion homeostasis | 9/2622 | 26/18723 | 6.73e-03 | 4.14e-02 | 9 |
| Page: 1 2 3 4 |
| Pathway ID | Tissue | Disease Stage | Description | Gene Ratio | Bg Ratio | pvalue | p.adjust | qvalue | Count |
| Page: 1 |
Top |
Cell-cell communication analysis |
| Identification of potential cell-cell interactions between two cell types and their ligand-receptor pairs for different disease states |
| Ligand | Receptor | LRpair | Pathway | Tissue | Disease Stage |
| Page: 1 |
Top |
Single-cell gene regulatory network inference analysis |
| Find out the significant the regulons (TFs) and the target genes of each regulon across cell types for different disease states |
| TF | Cell Type | Tissue | Disease Stage | Target Gene | RSS | Regulon Activity |
| ∗The dot plots of a searched regulon are shown for all cell subpopulations in each disease state of each tissue based on the regulon specific score inferred using pySCENIC and by calculating the average expression. |
| Page: 1 |
Top |
Somatic mutation of malignant transformation related genes |
| Annotation of somatic variants for genes involved in malignant transformation |
| Hugo Symbol | Variant Class | Variant Classification | dbSNP RS | HGVSc | HGVSp | HGVSp Short | SWISSPROT | BIOTYPE | SIFT | PolyPhen | Tumor Sample Barcode | Tissue | Histology | Sex | Age | Stage | Therapy Types | Drugs | Outcome |
| PDZD8 | SNV | Missense_Mutation | c.3112N>C | p.Phe1038Leu | p.F1038L | Q8NEN9 | protein_coding | tolerated(0.67) | benign(0.009) | TCGA-A8-A08T-01 | Breast | breast invasive carcinoma | Female | <65 | III/IV | Unknown | Unknown | PD | |
| PDZD8 | SNV | Missense_Mutation | c.576C>G | p.Phe192Leu | p.F192L | Q8NEN9 | protein_coding | tolerated(0.38) | probably_damaging(0.985) | TCGA-AC-A23H-01 | Breast | breast invasive carcinoma | Female | >=65 | I/II | Unknown | Unknown | PD | |
| PDZD8 | SNV | Missense_Mutation | novel | c.3163N>C | p.Asn1055His | p.N1055H | Q8NEN9 | protein_coding | deleterious(0) | probably_damaging(0.996) | TCGA-AN-A046-01 | Breast | breast invasive carcinoma | Female | >=65 | I/II | Unknown | Unknown | SD |
| PDZD8 | SNV | Missense_Mutation | c.1024N>A | p.Glu342Lys | p.E342K | Q8NEN9 | protein_coding | deleterious(0) | probably_damaging(0.994) | TCGA-E2-A14Y-01 | Breast | breast invasive carcinoma | Female | <65 | I/II | Chemotherapy | carboplatin | SD | |
| PDZD8 | insertion | Frame_Shift_Ins | novel | c.2977_2978insAA | p.Arg993GlnfsTer8 | p.R993Qfs*8 | Q8NEN9 | protein_coding | TCGA-AR-A0U0-01 | Breast | breast invasive carcinoma | Female | >=65 | I/II | Unknown | Unknown | SD | ||
| PDZD8 | insertion | Nonsense_Mutation | novel | c.2976_2977insTAACA | p.Arg993Ter | p.R993* | Q8NEN9 | protein_coding | TCGA-AR-A0U0-01 | Breast | breast invasive carcinoma | Female | >=65 | I/II | Unknown | Unknown | SD | ||
| PDZD8 | SNV | Missense_Mutation | c.2374N>G | p.His792Asp | p.H792D | Q8NEN9 | protein_coding | tolerated(0.15) | benign(0.024) | TCGA-Q1-A73O-01 | Cervix | cervical & endocervical cancer | Female | <65 | I/II | Chemotherapy | cisplatin | CR | |
| PDZD8 | SNV | Missense_Mutation | novel | c.322G>A | p.Glu108Lys | p.E108K | Q8NEN9 | protein_coding | deleterious(0.01) | benign(0.012) | TCGA-VS-A9U7-01 | Cervix | cervical & endocervical cancer | Female | <65 | I/II | Chemotherapy | cisplatin | CR |
| PDZD8 | SNV | Missense_Mutation | novel | c.1040N>A | p.Cys347Tyr | p.C347Y | Q8NEN9 | protein_coding | deleterious(0) | probably_damaging(0.997) | TCGA-VS-A9UJ-01 | Cervix | cervical & endocervical cancer | Female | <65 | I/II | Unknown | Unknown | PD |
| PDZD8 | SNV | Missense_Mutation | novel | c.2801N>C | p.Leu934Ser | p.L934S | Q8NEN9 | protein_coding | deleterious(0) | probably_damaging(0.963) | TCGA-5M-AAT6-01 | Colorectum | colon adenocarcinoma | Female | <65 | III/IV | Unknown | Unknown | PD |
| Page: 1 2 3 4 5 6 7 8 9 10 11 12 13 |
Top |
Related drugs of malignant transformation related genes |
| Identification of chemicals and drugs interact with genes involved in malignant transfromation |
| (DGIdb 4.0) |
| Entrez ID | Symbol | Category | Interaction Types | Drug Claim Name | Drug Name | PMIDs |
| Page: 1 |

Copyright 2023-Present -The University of Texas Health Science Center at Houston |