
|
|||||
|
 | |
| |
| |
| |
| |
| |
|
Gene: PDZD2 |
Gene summary for PDZD2 |
| Gene information | Species | Human | Gene symbol | PDZD2 | Gene ID | 23037 |
| Gene name | PDZ domain containing 2 | |
| Gene Alias | AIPC | |
| Cytomap | 5p13.3 | |
| Gene Type | protein-coding | GO ID | GO:0007155 | UniProtAcc | A0A024RE15 |
Top |
Malignant transformation analysis |
| Identification of the aberrant gene expression in precancerous and cancerous lesions by comparing the gene expression of stem-like cells in diseased tissues with normal stem cells |
| Entrez ID | Symbol | Replicates | Species | Organ | Tissue | Adj P-value | Log2FC | Malignancy |
| 23037 | PDZD2 | AEH-subject5 | Human | Endometrium | AEH | 1.89e-30 | 6.04e-01 | -0.2953 |
| 23037 | PDZD2 | EEC-subject4 | Human | Endometrium | EEC | 3.00e-06 | 2.79e-01 | -0.2571 |
| 23037 | PDZD2 | LZE5T | Human | Esophagus | ESCC | 1.32e-06 | 4.91e-01 | 0.0514 |
| 23037 | PDZD2 | LZE20T | Human | Esophagus | ESCC | 3.02e-02 | 1.63e-01 | 0.0662 |
| 23037 | PDZD2 | LZE22T | Human | Esophagus | ESCC | 6.40e-04 | 3.12e-01 | 0.068 |
| 23037 | PDZD2 | P1T-E | Human | Esophagus | ESCC | 5.68e-05 | 5.76e-01 | 0.0875 |
| 23037 | PDZD2 | P2T-E | Human | Esophagus | ESCC | 3.22e-18 | 3.11e-01 | 0.1177 |
| 23037 | PDZD2 | P4T-E | Human | Esophagus | ESCC | 1.91e-05 | 1.86e-01 | 0.1323 |
| 23037 | PDZD2 | P5T-E | Human | Esophagus | ESCC | 6.38e-05 | 1.39e-01 | 0.1327 |
| 23037 | PDZD2 | P8T-E | Human | Esophagus | ESCC | 5.21e-11 | 3.01e-01 | 0.0889 |
| 23037 | PDZD2 | P10T-E | Human | Esophagus | ESCC | 1.11e-27 | 5.29e-01 | 0.116 |
| 23037 | PDZD2 | P12T-E | Human | Esophagus | ESCC | 2.61e-05 | 1.62e-01 | 0.1122 |
| 23037 | PDZD2 | P23T-E | Human | Esophagus | ESCC | 2.96e-07 | 3.00e-01 | 0.108 |
| 23037 | PDZD2 | P24T-E | Human | Esophagus | ESCC | 1.05e-06 | 1.84e-01 | 0.1287 |
| 23037 | PDZD2 | P27T-E | Human | Esophagus | ESCC | 7.54e-12 | 2.43e-01 | 0.1055 |
| 23037 | PDZD2 | P31T-E | Human | Esophagus | ESCC | 2.65e-12 | 3.35e-01 | 0.1251 |
| 23037 | PDZD2 | P36T-E | Human | Esophagus | ESCC | 1.23e-03 | 2.42e-01 | 0.1187 |
| 23037 | PDZD2 | P39T-E | Human | Esophagus | ESCC | 8.33e-06 | 2.76e-01 | 0.0894 |
| 23037 | PDZD2 | P52T-E | Human | Esophagus | ESCC | 4.74e-09 | 2.51e-01 | 0.1555 |
| 23037 | PDZD2 | P54T-E | Human | Esophagus | ESCC | 7.79e-03 | 1.61e-01 | 0.0975 |
| Page: 1 2 3 |
| Tissue | Expression Dynamics | Abbreviation |
| Endometrium | 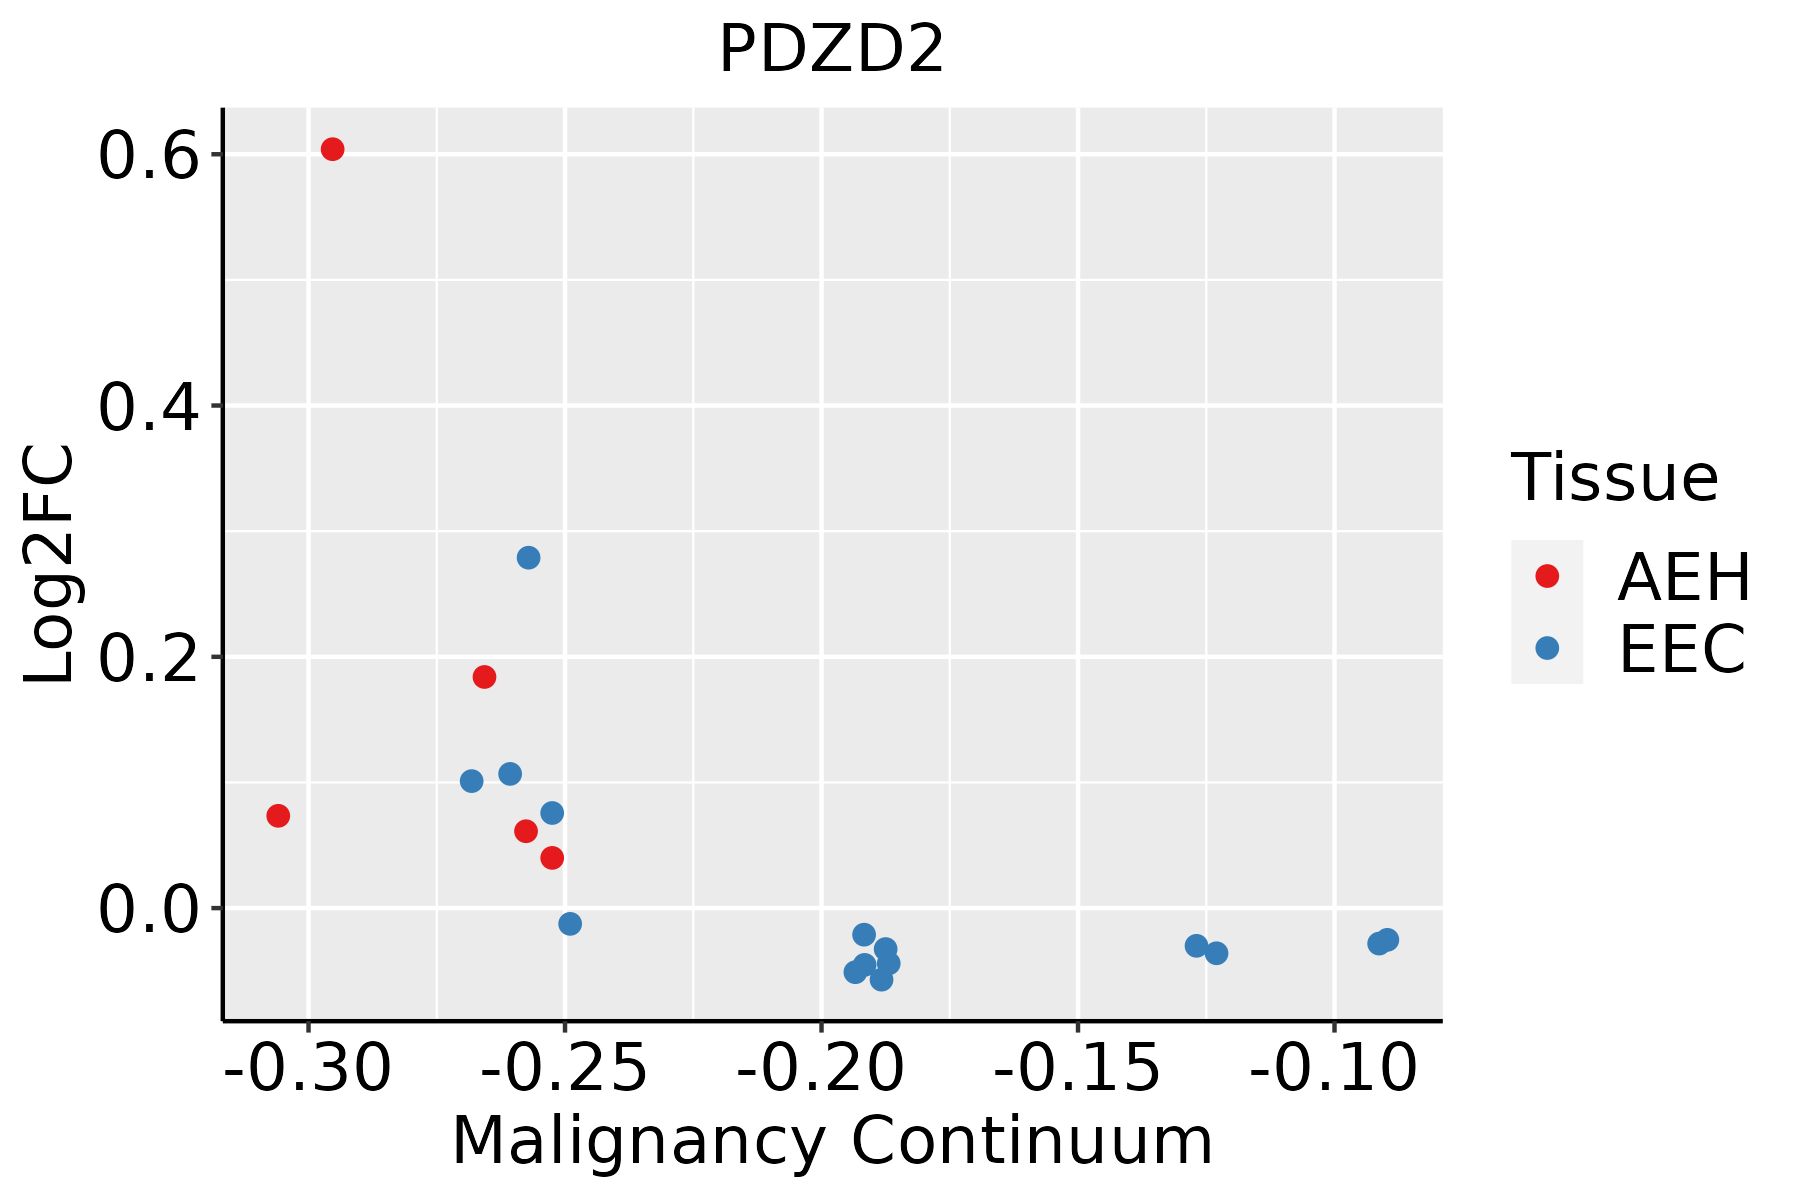 | AEH: Atypical endometrial hyperplasia |
| EEC: Endometrioid Cancer | ||
| Esophagus | 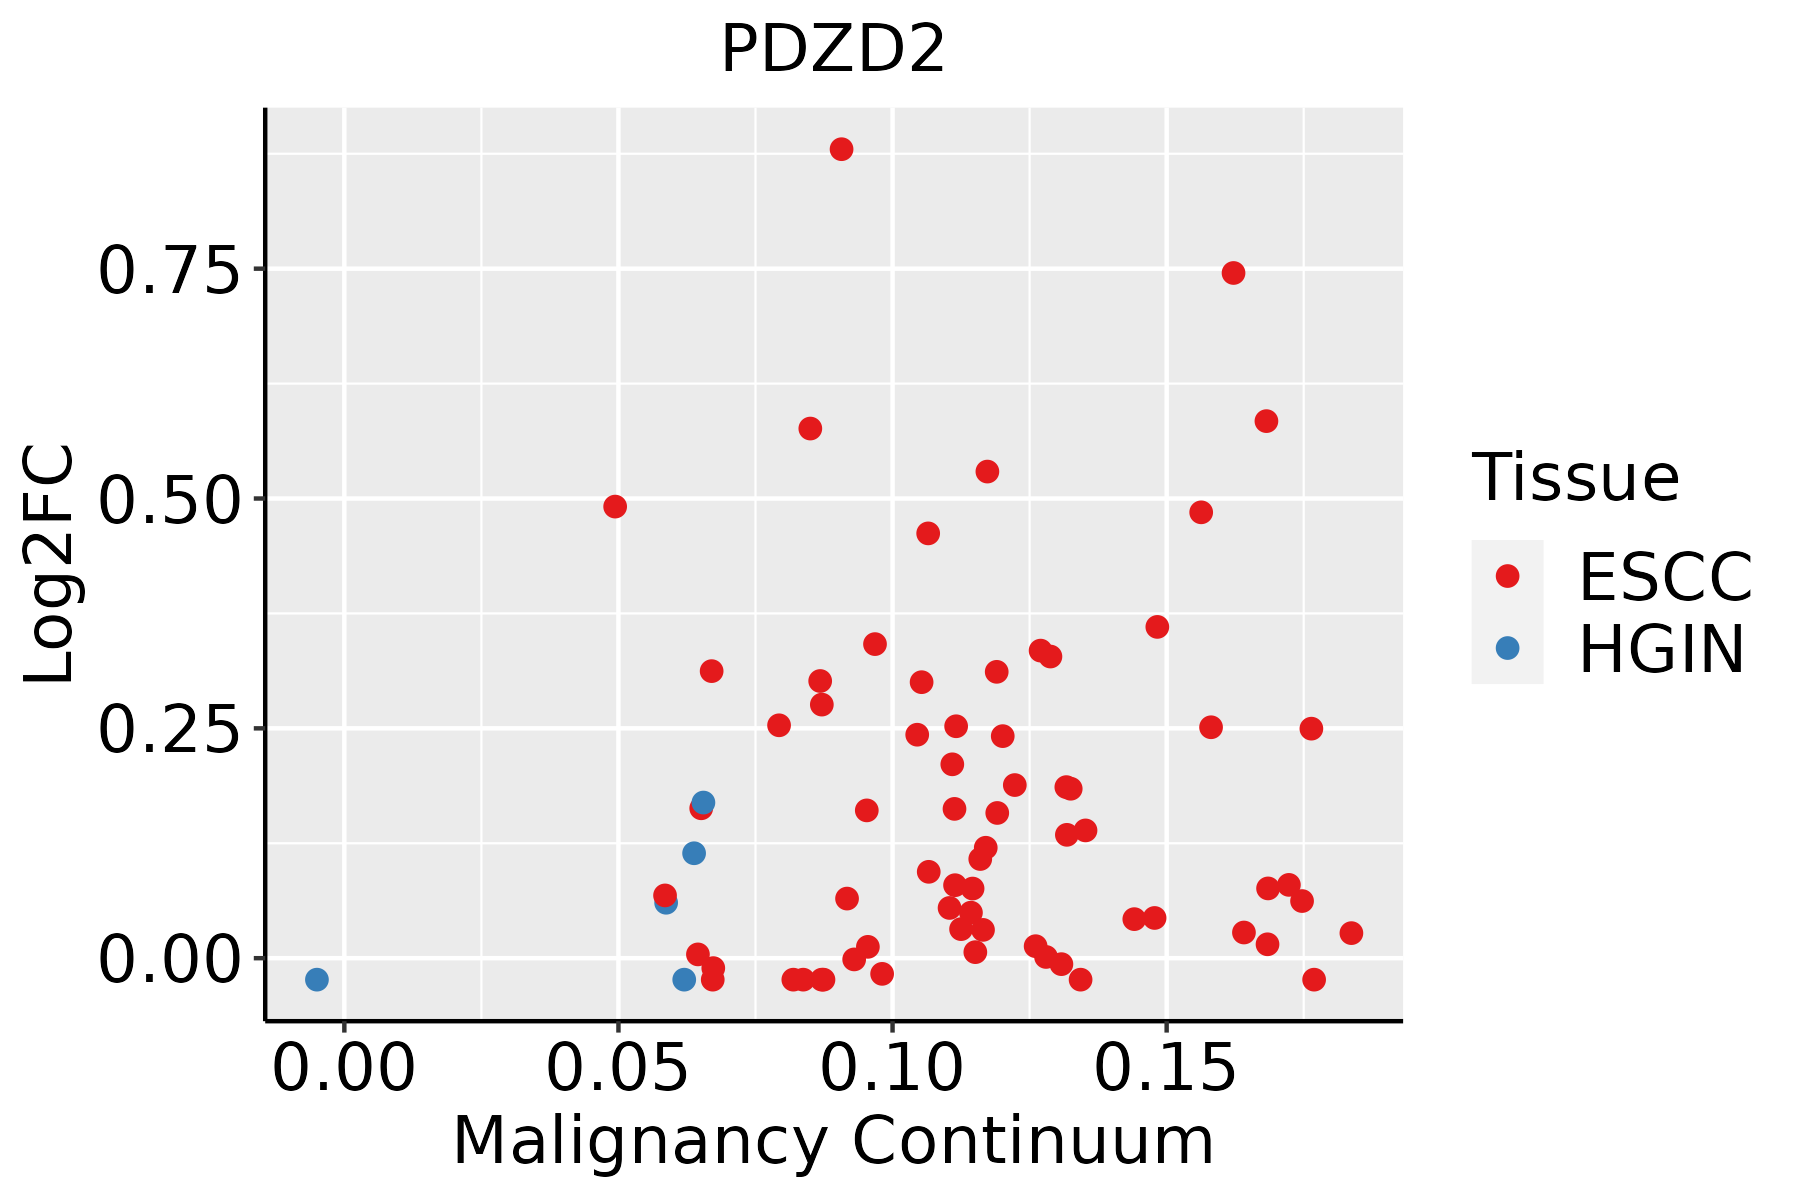 | ESCC: Esophageal squamous cell carcinoma |
| HGIN: High-grade intraepithelial neoplasias | ||
| LGIN: Low-grade intraepithelial neoplasias | ||
| Lung | 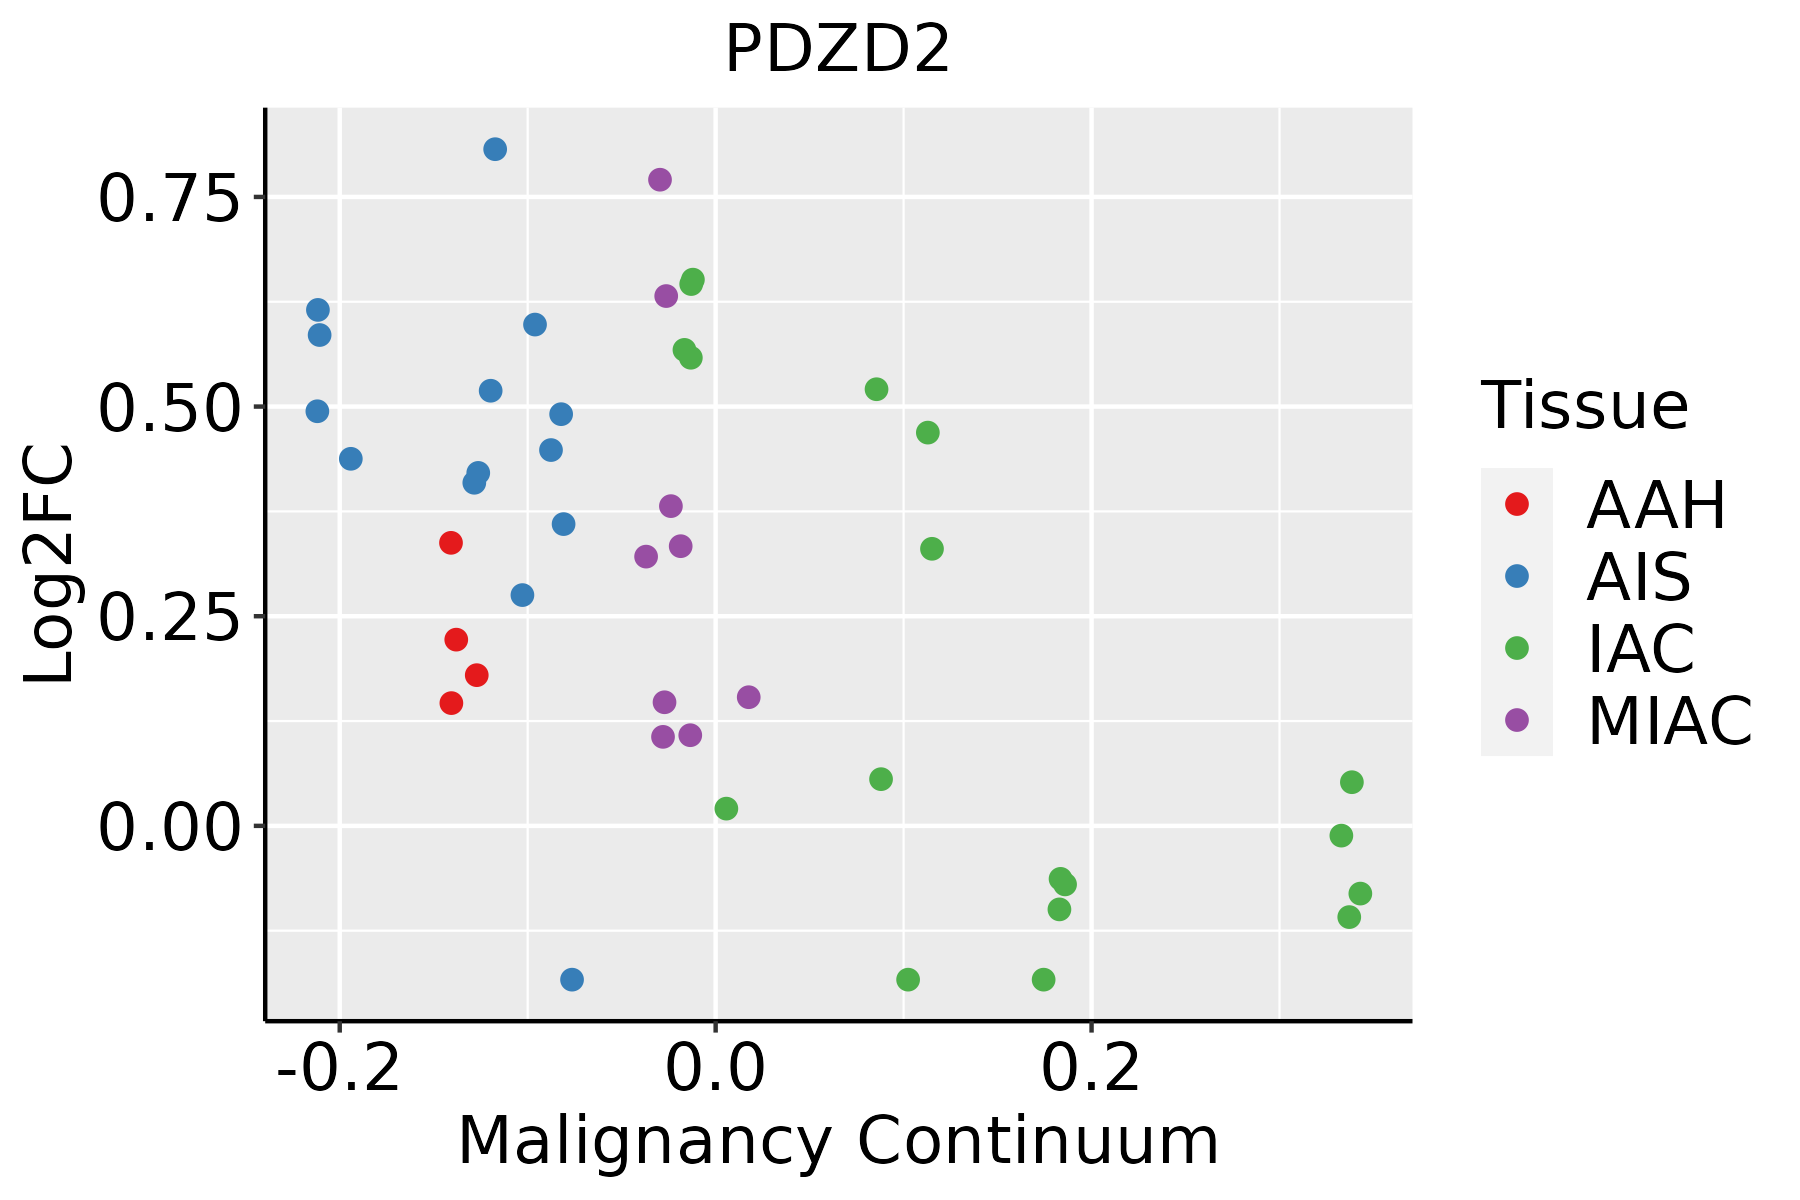 | AAH: Atypical adenomatous hyperplasia |
| AIS: Adenocarcinoma in situ | ||
| IAC: Invasive lung adenocarcinoma | ||
| MIA: Minimally invasive adenocarcinoma | ||
| Skin | 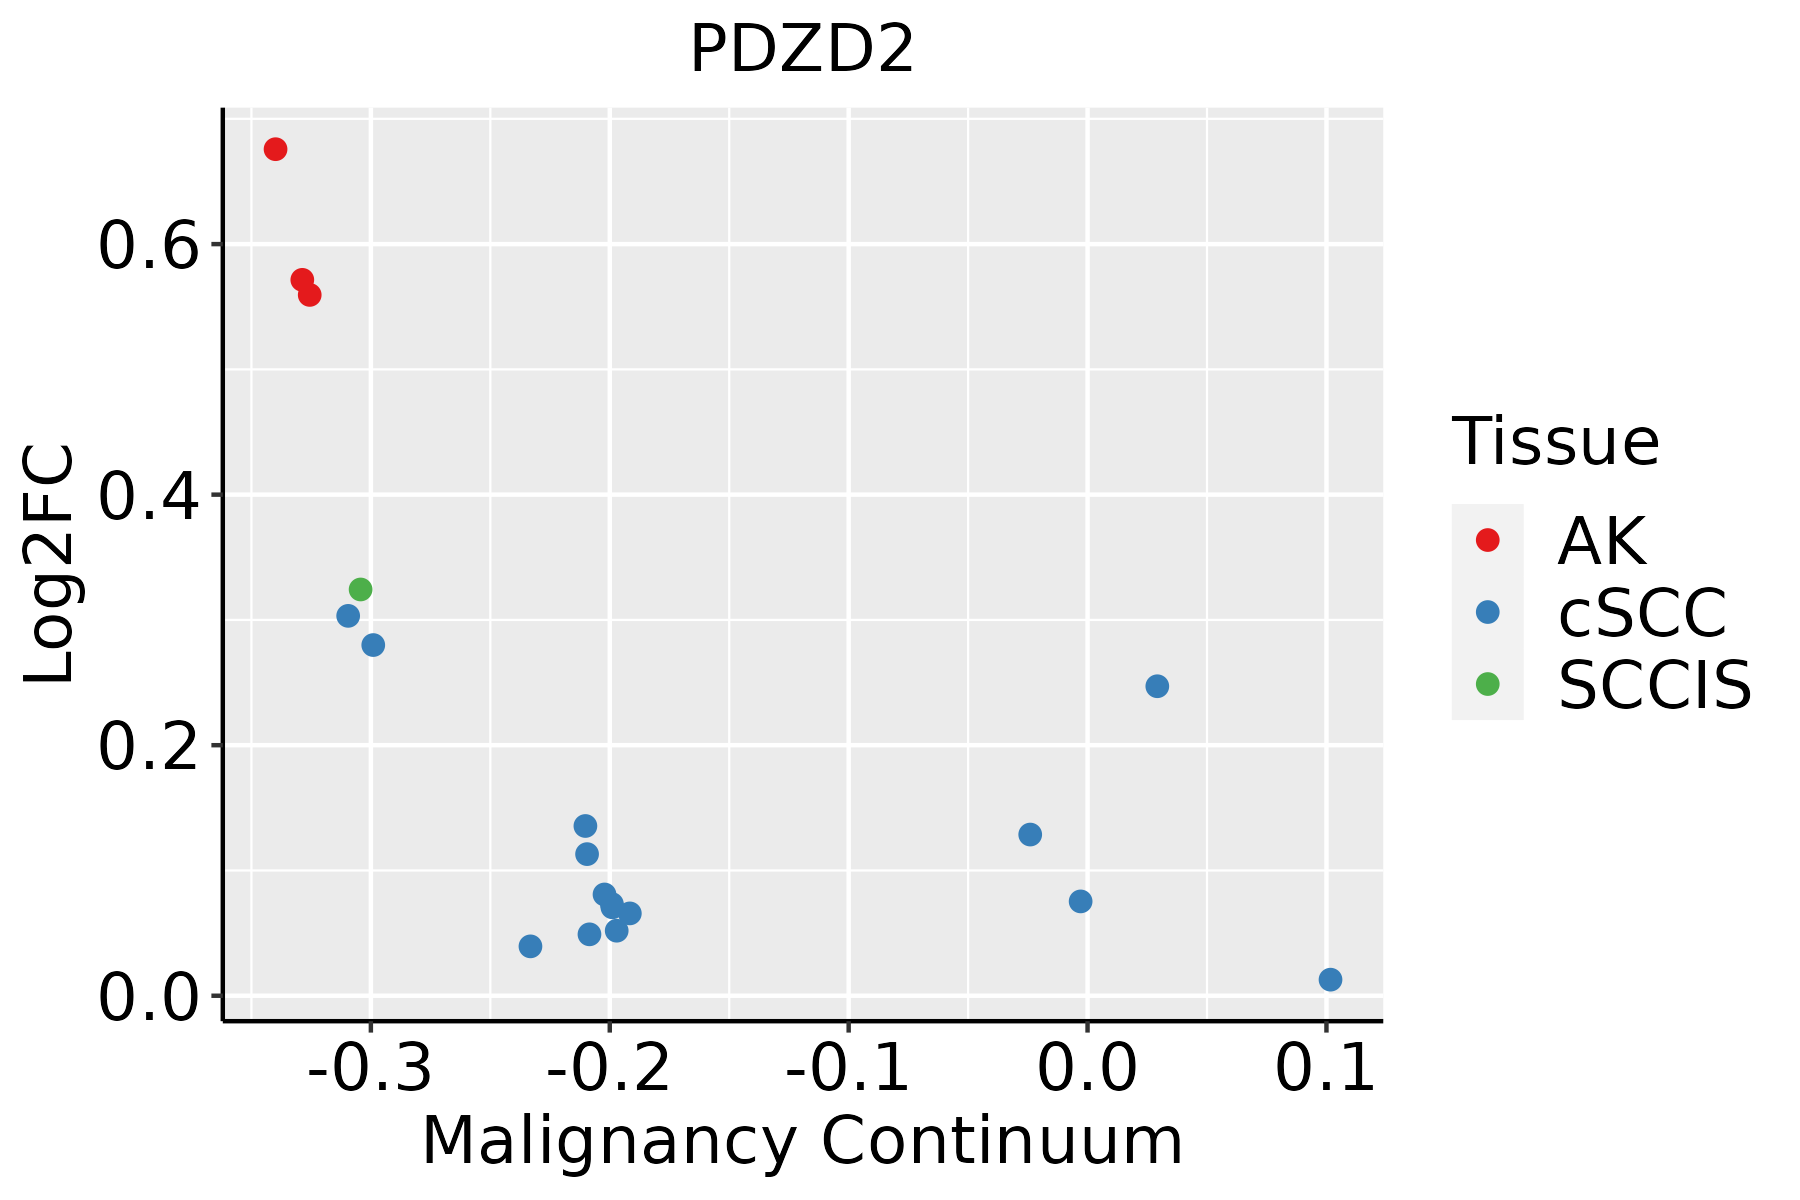 | AK: Actinic keratosis |
| cSCC: Cutaneous squamous cell carcinoma | ||
| SCCIS:squamous cell carcinoma in situ | ||
| Thyroid | 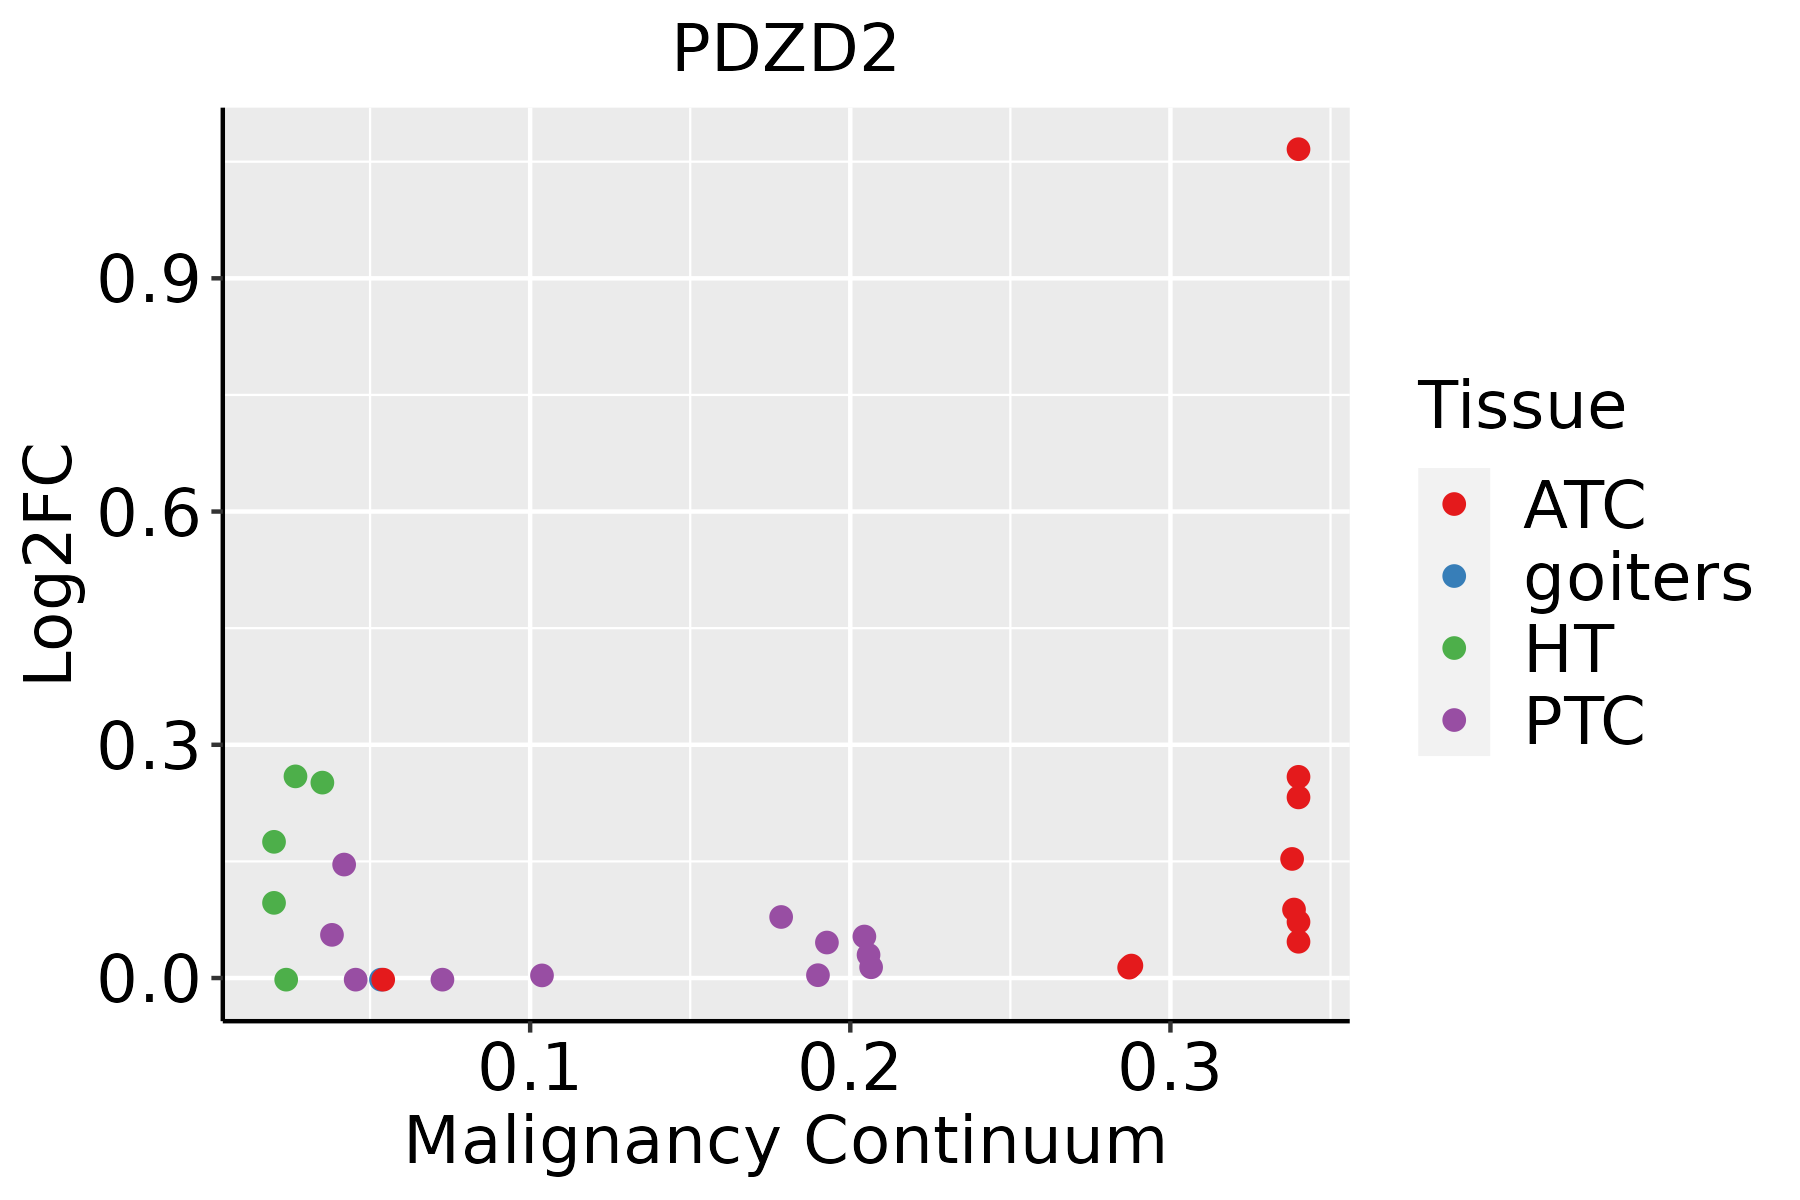 | ATC: Anaplastic thyroid cancer |
| HT: Hashimoto's thyroiditis | ||
| PTC: Papillary thyroid cancer |
| ∗log2FC in expression of this searched gene in stem-like cells from each diseased tissue sample relative to stem-like cells in normal samples in each tissue plotted against the malignancy continuum. Samples are colored based on if they are from different disease stage. |
Top |
Malignant transformation related pathway analysis |
| Find out the enriched GO biological processes and KEGG pathways involved in transition from healthy to precancer to cancer |
| Tissue | Disease Stage | Enriched GO biological Processes |
| Colorectum | AD |  |
| Colorectum | SER |  |
| Colorectum | MSS |  |
| Colorectum | MSI-H |  |
| Colorectum | FAP |  |
| ∗Top 15 enriched GO BP terms are showed in the bar plot of each disease state in each tissue. Each row represents a significant GO biological process which is colored according to the -log10(p.adjust). |
| Page: 1 2 3 4 5 6 7 8 9 |
| GO ID | Tissue | Disease Stage | Description | Gene Ratio | Bg Ratio | pvalue | p.adjust | Count |
| Page: 1 |
| Pathway ID | Tissue | Disease Stage | Description | Gene Ratio | Bg Ratio | pvalue | p.adjust | qvalue | Count |
| Page: 1 |
Top |
Cell-cell communication analysis |
| Identification of potential cell-cell interactions between two cell types and their ligand-receptor pairs for different disease states |
| Ligand | Receptor | LRpair | Pathway | Tissue | Disease Stage |
| Page: 1 |
Top |
Single-cell gene regulatory network inference analysis |
| Find out the significant the regulons (TFs) and the target genes of each regulon across cell types for different disease states |
| TF | Cell Type | Tissue | Disease Stage | Target Gene | RSS | Regulon Activity |
| ∗The dot plots of a searched regulon are shown for all cell subpopulations in each disease state of each tissue based on the regulon specific score inferred using pySCENIC and by calculating the average expression. |
| Page: 1 |
Top |
Somatic mutation of malignant transformation related genes |
| Annotation of somatic variants for genes involved in malignant transformation |
| Hugo Symbol | Variant Class | Variant Classification | dbSNP RS | HGVSc | HGVSp | HGVSp Short | SWISSPROT | BIOTYPE | SIFT | PolyPhen | Tumor Sample Barcode | Tissue | Histology | Sex | Age | Stage | Therapy Types | Drugs | Outcome |
| PDZD2 | SNV | Missense_Mutation | c.7537N>A | p.Glu2513Lys | p.E2513K | O15018 | protein_coding | deleterious(0) | benign(0.265) | TCGA-AC-A23H-01 | Breast | breast invasive carcinoma | Female | >=65 | I/II | Unknown | Unknown | PD | |
| PDZD2 | SNV | Missense_Mutation | novel | c.5095N>T | p.Val1699Phe | p.V1699F | O15018 | protein_coding | deleterious(0.02) | benign(0.188) | TCGA-AC-A3TM-01 | Breast | breast invasive carcinoma | Female | <65 | III/IV | Chemotherapy | cytoxan | CR |
| PDZD2 | SNV | Missense_Mutation | c.194N>G | p.Glu65Gly | p.E65G | O15018 | protein_coding | tolerated(0.32) | benign(0.003) | TCGA-AO-A0J8-01 | Breast | breast invasive carcinoma | Female | <65 | I/II | Chemotherapy | cyclophosphamide | SD | |
| PDZD2 | SNV | Missense_Mutation | rs768167722 | c.7709G>A | p.Arg2570Lys | p.R2570K | O15018 | protein_coding | tolerated(0.16) | benign(0.071) | TCGA-AR-A0TX-01 | Breast | breast invasive carcinoma | Female | <65 | I/II | Unknown | Unknown | SD |
| PDZD2 | SNV | Missense_Mutation | rs372658069 | c.2435N>A | p.Arg812Gln | p.R812Q | O15018 | protein_coding | deleterious(0) | probably_damaging(0.998) | TCGA-AR-A1AI-01 | Breast | breast invasive carcinoma | Female | <65 | I/II | Chemotherapy | cytoxan | PD |
| PDZD2 | SNV | Missense_Mutation | c.4741C>T | p.Arg1581Cys | p.R1581C | O15018 | protein_coding | tolerated(0.2) | benign(0.424) | TCGA-BH-A0AY-01 | Breast | breast invasive carcinoma | Female | <65 | I/II | Chemotherapy | SD | ||
| PDZD2 | SNV | Missense_Mutation | rs777626634 | c.193N>A | p.Glu65Lys | p.E65K | O15018 | protein_coding | tolerated(0.08) | benign(0.223) | TCGA-BH-A0EA-01 | Breast | breast invasive carcinoma | Female | >=65 | I/II | Chemotherapy | taxotere | CR |
| PDZD2 | SNV | Missense_Mutation | c.5855N>A | p.Arg1952Lys | p.R1952K | O15018 | protein_coding | tolerated(1) | benign(0) | TCGA-BH-A0HF-01 | Breast | breast invasive carcinoma | Female | >=65 | I/II | Hormone Therapy | arimidex | SD | |
| PDZD2 | SNV | Missense_Mutation | rs150231394 | c.7049N>A | p.Arg2350Gln | p.R2350Q | O15018 | protein_coding | deleterious(0) | probably_damaging(0.971) | TCGA-BH-A0HF-01 | Breast | breast invasive carcinoma | Female | >=65 | I/II | Hormone Therapy | arimidex | SD |
| PDZD2 | SNV | Missense_Mutation | c.7294N>C | p.Glu2432Gln | p.E2432Q | O15018 | protein_coding | tolerated(0.08) | possibly_damaging(0.598) | TCGA-BH-A0W7-01 | Breast | breast invasive carcinoma | Female | <65 | I/II | Chemotherapy | taxotere | CR |
| Page: 1 2 3 4 5 6 7 8 9 10 11 12 13 14 15 16 17 18 19 20 21 22 23 24 25 26 27 28 29 30 31 32 33 34 35 36 37 |
Top |
Related drugs of malignant transformation related genes |
| Identification of chemicals and drugs interact with genes involved in malignant transfromation |
| (DGIdb 4.0) |
| Entrez ID | Symbol | Category | Interaction Types | Drug Claim Name | Drug Name | PMIDs |
| Page: 1 |

Copyright 2023-Present -The University of Texas Health Science Center at Houston |