
|
|||||
|
 | |
| |
| |
| |
| |
| |
|
Gene: PDXK |
Gene summary for PDXK |
| Gene information | Species | Human | Gene symbol | PDXK | Gene ID | 8566 |
| Gene name | pyridoxal kinase | |
| Gene Alias | C21orf124 | |
| Cytomap | 21q22.3 | |
| Gene Type | protein-coding | GO ID | GO:0006081 | UniProtAcc | F2Z2Y4 |
Top |
Malignant transformation analysis |
| Identification of the aberrant gene expression in precancerous and cancerous lesions by comparing the gene expression of stem-like cells in diseased tissues with normal stem cells |
| Entrez ID | Symbol | Replicates | Species | Organ | Tissue | Adj P-value | Log2FC | Malignancy |
| 8566 | PDXK | CA_HPV_1 | Human | Cervix | CC | 2.71e-05 | -2.47e-02 | 0.0264 |
| 8566 | PDXK | N_HPV_1 | Human | Cervix | N_HPV | 4.74e-02 | -1.55e-01 | 0.0079 |
| 8566 | PDXK | CCI_2 | Human | Cervix | CC | 1.80e-06 | 8.73e-01 | 0.5249 |
| 8566 | PDXK | CCI_3 | Human | Cervix | CC | 5.11e-03 | 6.68e-01 | 0.516 |
| 8566 | PDXK | HTA11_3410_2000001011 | Human | Colorectum | AD | 1.24e-04 | 1.62e-01 | 0.0155 |
| 8566 | PDXK | HTA11_2487_2000001011 | Human | Colorectum | SER | 2.03e-16 | 6.31e-01 | -0.1808 |
| 8566 | PDXK | HTA11_1938_2000001011 | Human | Colorectum | AD | 5.37e-16 | 7.70e-01 | -0.0811 |
| 8566 | PDXK | HTA11_78_2000001011 | Human | Colorectum | AD | 2.95e-05 | 3.61e-01 | -0.1088 |
| 8566 | PDXK | HTA11_347_2000001011 | Human | Colorectum | AD | 7.80e-18 | 6.07e-01 | -0.1954 |
| 8566 | PDXK | HTA11_411_2000001011 | Human | Colorectum | SER | 1.36e-02 | 6.62e-01 | -0.2602 |
| 8566 | PDXK | HTA11_2112_2000001011 | Human | Colorectum | SER | 6.94e-04 | 7.71e-01 | -0.2196 |
| 8566 | PDXK | HTA11_3361_2000001011 | Human | Colorectum | AD | 4.64e-10 | 6.68e-01 | -0.1207 |
| 8566 | PDXK | HTA11_83_2000001011 | Human | Colorectum | SER | 1.51e-06 | 5.48e-01 | -0.1526 |
| 8566 | PDXK | HTA11_696_2000001011 | Human | Colorectum | AD | 1.46e-25 | 8.22e-01 | -0.1464 |
| 8566 | PDXK | HTA11_866_2000001011 | Human | Colorectum | AD | 5.51e-11 | 5.84e-01 | -0.1001 |
| 8566 | PDXK | HTA11_1391_2000001011 | Human | Colorectum | AD | 2.34e-22 | 8.37e-01 | -0.059 |
| 8566 | PDXK | HTA11_5212_2000001011 | Human | Colorectum | AD | 6.81e-03 | 4.24e-01 | -0.2061 |
| 8566 | PDXK | HTA11_546_2000001011 | Human | Colorectum | AD | 4.31e-06 | 6.35e-01 | -0.0842 |
| 8566 | PDXK | HTA11_7862_2000001011 | Human | Colorectum | AD | 4.32e-02 | 3.29e-01 | -0.0179 |
| 8566 | PDXK | HTA11_866_3004761011 | Human | Colorectum | AD | 6.92e-07 | 3.99e-01 | 0.096 |
| Page: 1 2 3 4 5 6 7 8 |
| Tissue | Expression Dynamics | Abbreviation |
| Cervix | 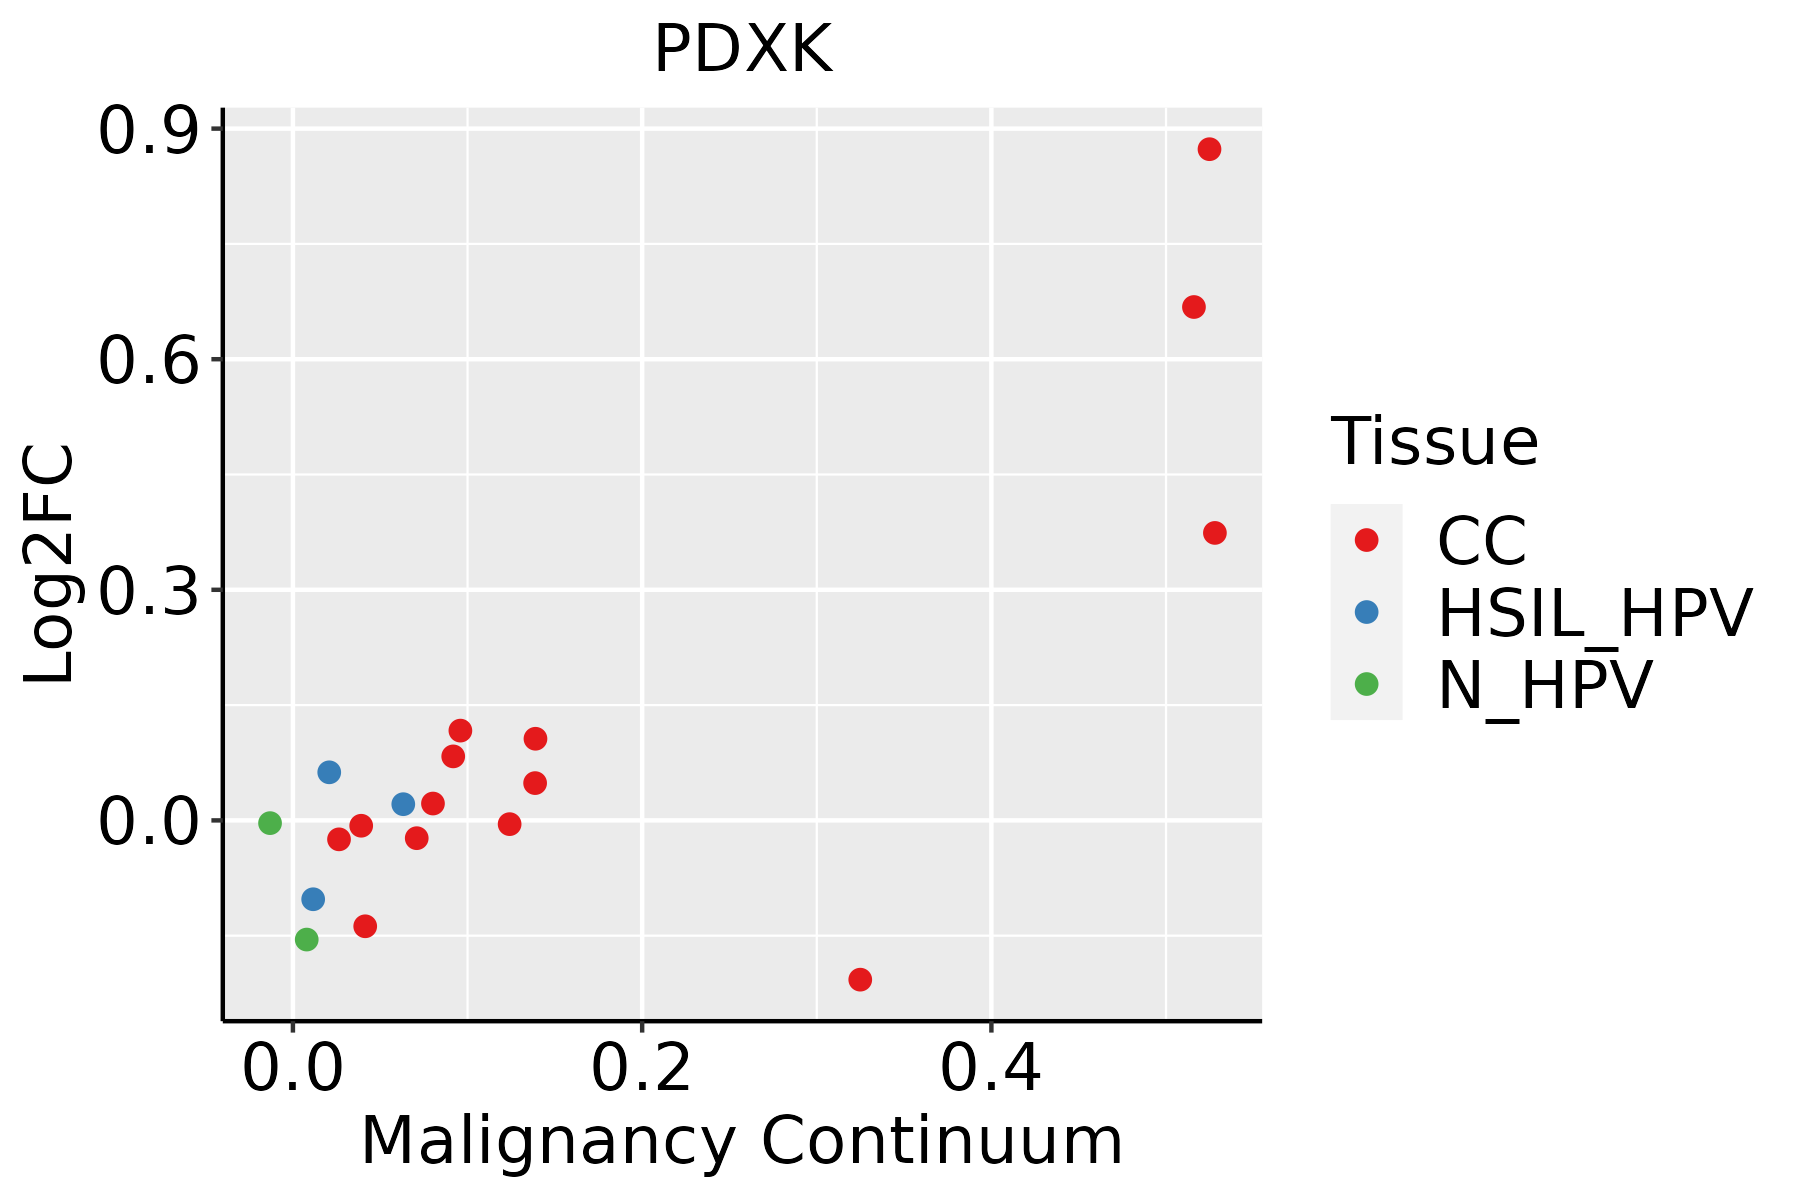 | CC: Cervix cancer |
| HSIL_HPV: HPV-infected high-grade squamous intraepithelial lesions | ||
| N_HPV: HPV-infected normal cervix | ||
| Colorectum (GSE201348) |  | FAP: Familial adenomatous polyposis |
| CRC: Colorectal cancer | ||
| Colorectum (HTA11) |  | AD: Adenomas |
| SER: Sessile serrated lesions | ||
| MSI-H: Microsatellite-high colorectal cancer | ||
| MSS: Microsatellite stable colorectal cancer | ||
| Esophagus |  | ESCC: Esophageal squamous cell carcinoma |
| HGIN: High-grade intraepithelial neoplasias | ||
| LGIN: Low-grade intraepithelial neoplasias | ||
| Liver |  | HCC: Hepatocellular carcinoma |
| NAFLD: Non-alcoholic fatty liver disease | ||
| Oral Cavity | 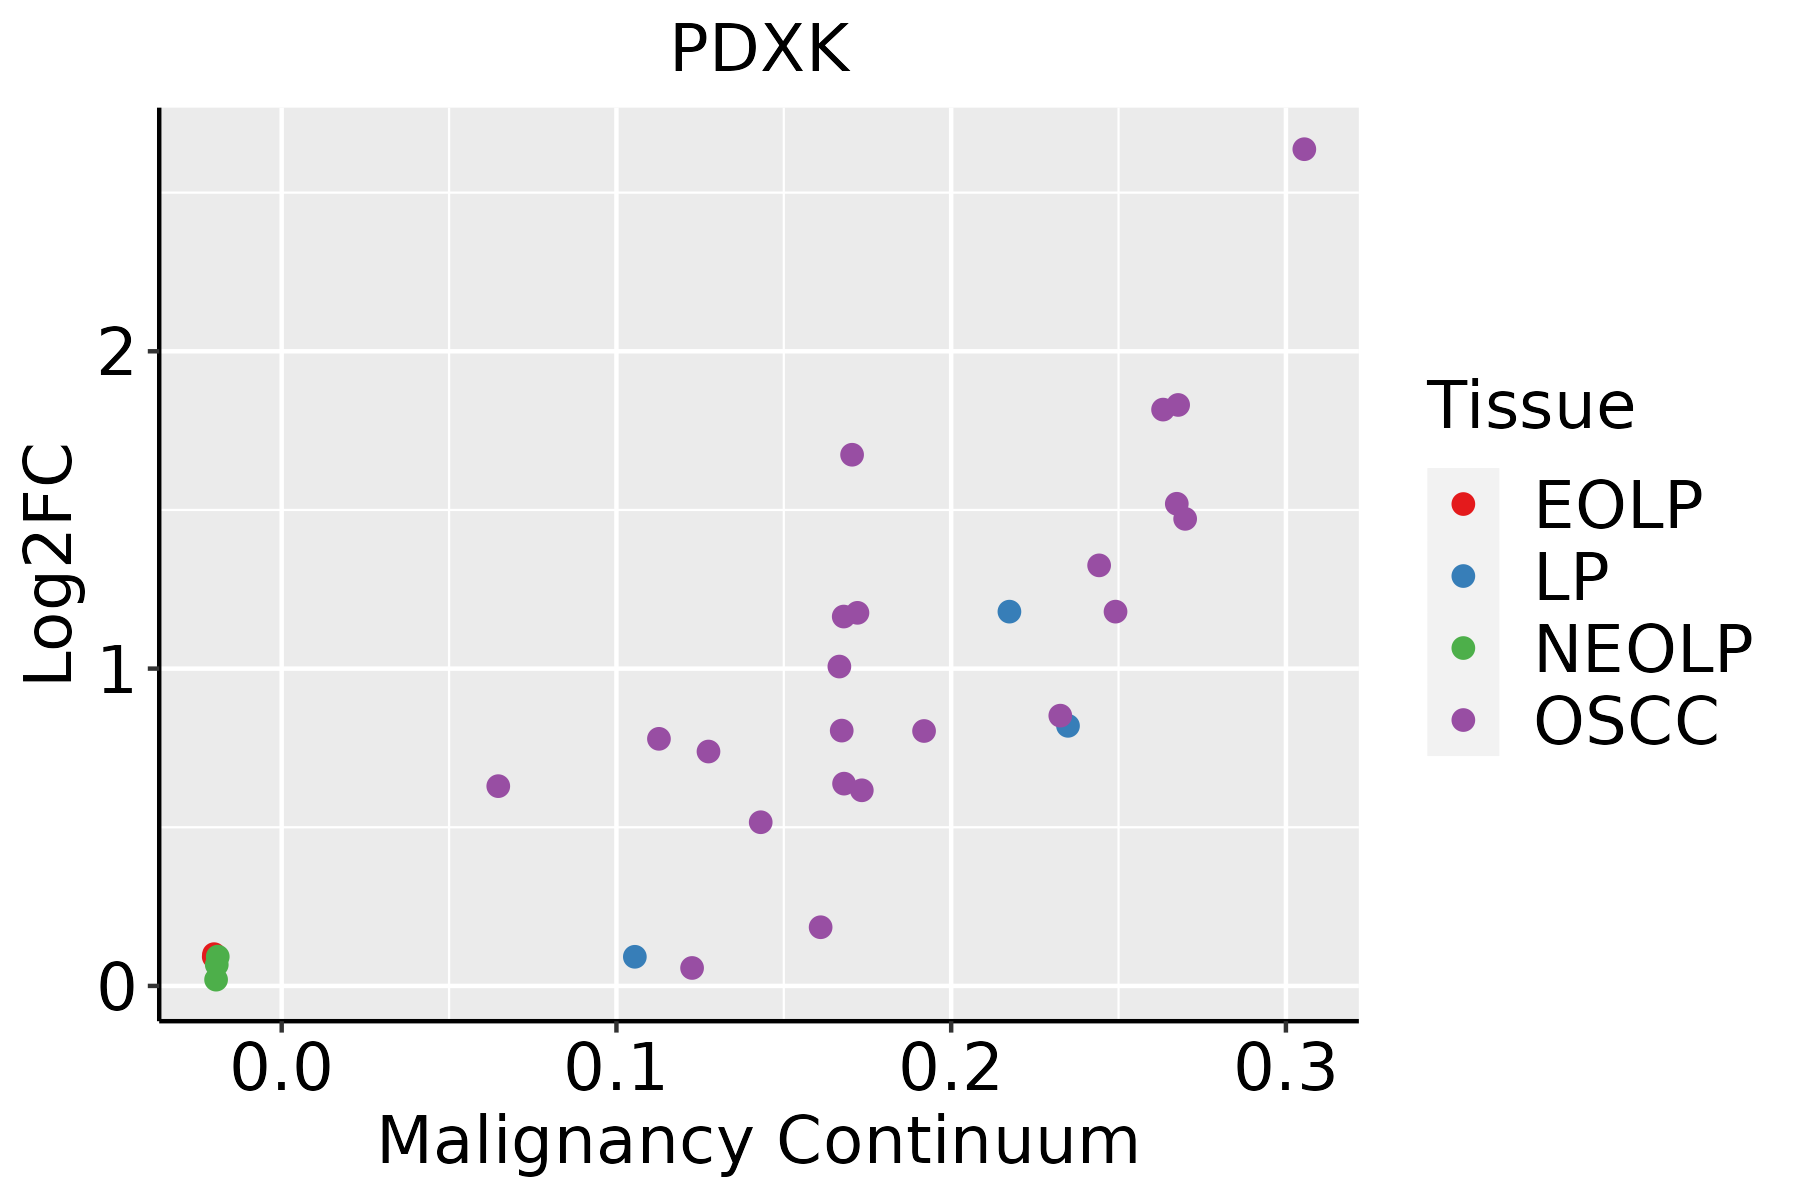 | EOLP: Erosive Oral lichen planus |
| LP: leukoplakia | ||
| NEOLP: Non-erosive oral lichen planus | ||
| OSCC: Oral squamous cell carcinoma | ||
| Skin | 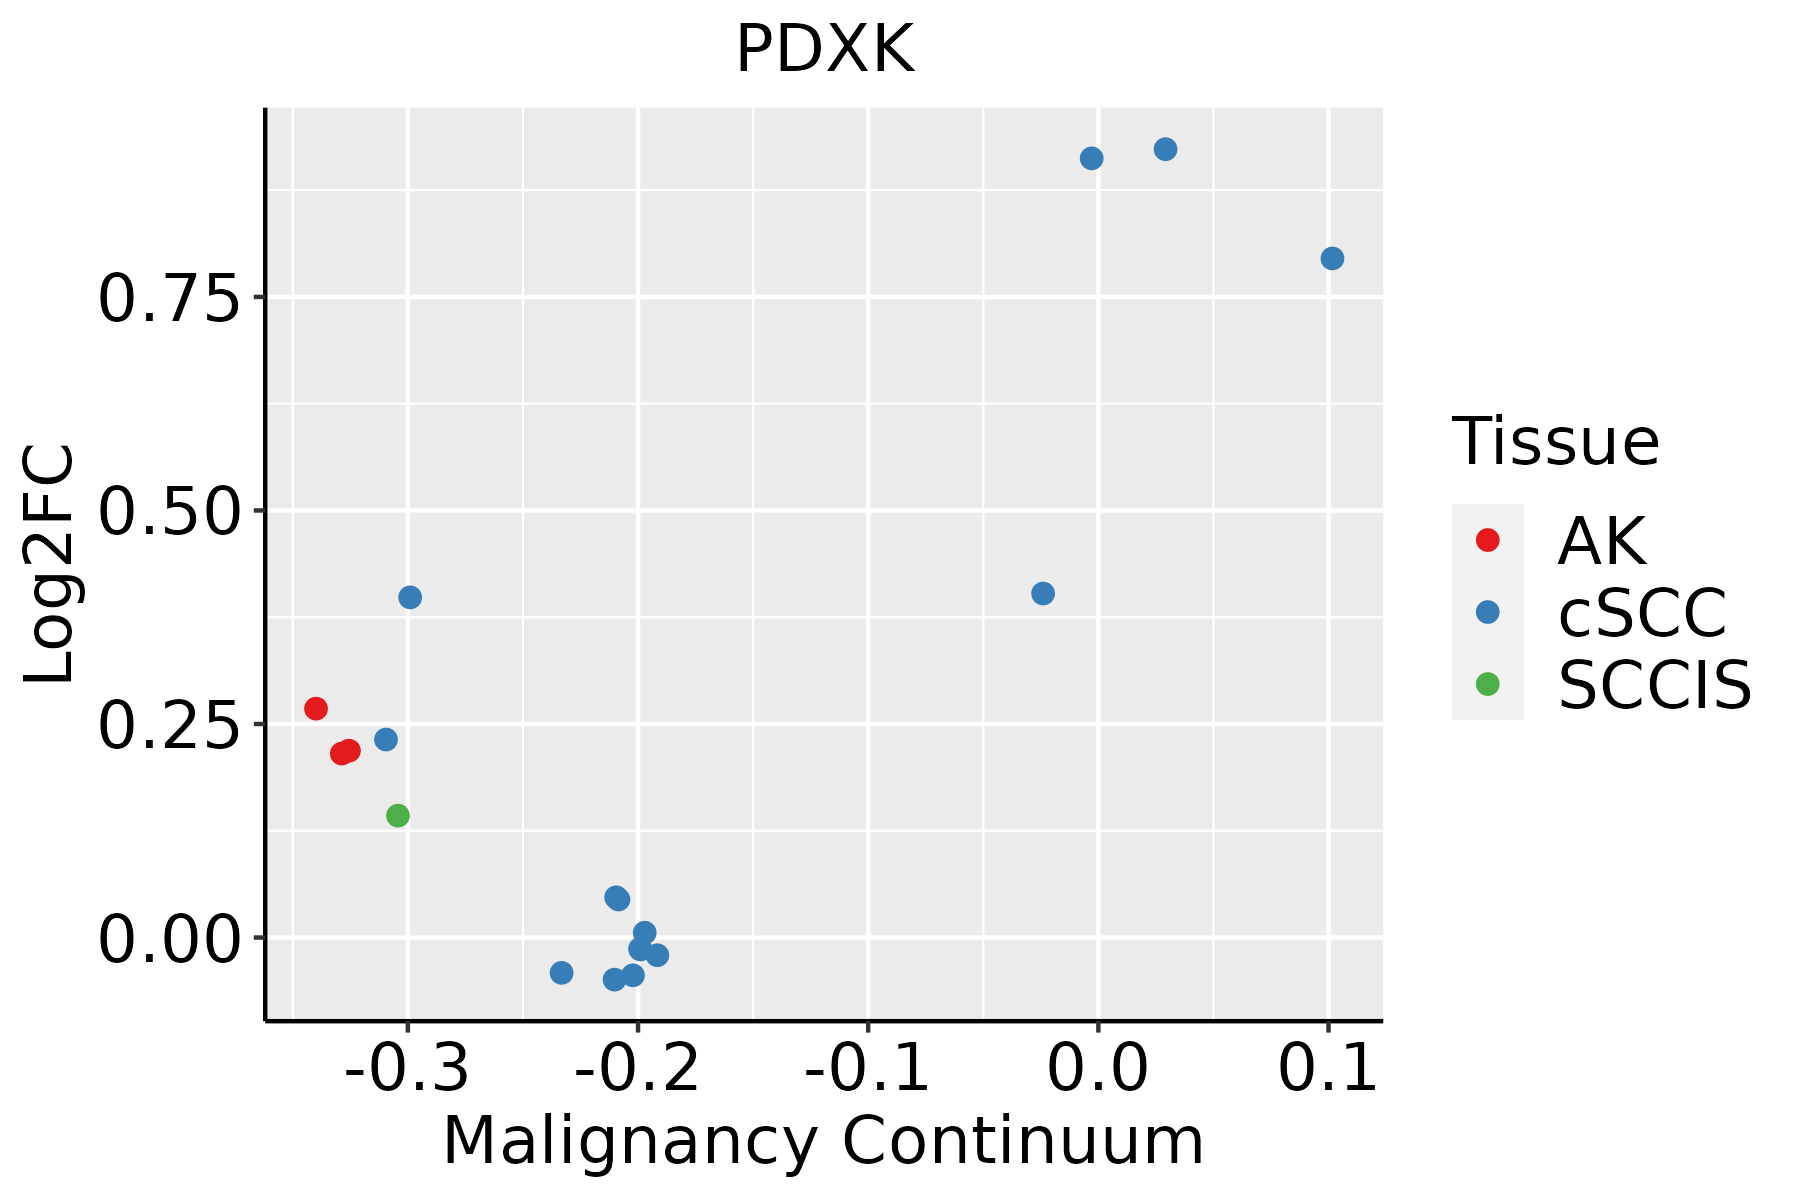 | AK: Actinic keratosis |
| cSCC: Cutaneous squamous cell carcinoma | ||
| SCCIS:squamous cell carcinoma in situ | ||
| Thyroid |  | ATC: Anaplastic thyroid cancer |
| HT: Hashimoto's thyroiditis | ||
| PTC: Papillary thyroid cancer |
| ∗log2FC in expression of this searched gene in stem-like cells from each diseased tissue sample relative to stem-like cells in normal samples in each tissue plotted against the malignancy continuum. Samples are colored based on if they are from different disease stage. |
Top |
Malignant transformation related pathway analysis |
| Find out the enriched GO biological processes and KEGG pathways involved in transition from healthy to precancer to cancer |
| Tissue | Disease Stage | Enriched GO biological Processes |
| Colorectum | AD |  |
| Colorectum | SER |  |
| Colorectum | MSS |  |
| Colorectum | MSI-H |  |
| Colorectum | FAP |  |
| ∗Top 15 enriched GO BP terms are showed in the bar plot of each disease state in each tissue. Each row represents a significant GO biological process which is colored according to the -log10(p.adjust). |
| Page: 1 2 3 4 5 6 7 8 9 |
| GO ID | Tissue | Disease Stage | Description | Gene Ratio | Bg Ratio | pvalue | p.adjust | Count |
| GO:0006081 | Colorectum | AD | cellular aldehyde metabolic process | 22/3918 | 60/18723 | 3.64e-03 | 2.60e-02 | 22 |
| GO:00060811 | Colorectum | MSS | cellular aldehyde metabolic process | 21/3467 | 60/18723 | 1.81e-03 | 1.60e-02 | 21 |
| GO:00060812 | Colorectum | MSI-H | cellular aldehyde metabolic process | 13/1319 | 60/18723 | 2.27e-04 | 5.94e-03 | 13 |
| GO:00067671 | Esophagus | ESCC | water-soluble vitamin metabolic process | 41/8552 | 59/18723 | 1.84e-04 | 1.17e-03 | 41 |
| GO:00067661 | Esophagus | ESCC | vitamin metabolic process | 67/8552 | 106/18723 | 2.03e-04 | 1.28e-03 | 67 |
| GO:00060818 | Esophagus | ESCC | cellular aldehyde metabolic process | 40/8552 | 60/18723 | 8.30e-04 | 4.28e-03 | 40 |
| GO:19016174 | Esophagus | ESCC | organic hydroxy compound biosynthetic process | 128/8552 | 237/18723 | 5.86e-03 | 2.16e-02 | 128 |
| GO:0009110 | Esophagus | ESCC | vitamin biosynthetic process | 15/8552 | 20/18723 | 7.60e-03 | 2.71e-02 | 15 |
| GO:00430941 | Esophagus | ESCC | cellular metabolic compound salvage | 18/8552 | 26/18723 | 1.32e-02 | 4.31e-02 | 18 |
| GO:19016172 | Liver | HCC | organic hydroxy compound biosynthetic process | 129/7958 | 237/18723 | 1.32e-04 | 1.08e-03 | 129 |
| GO:0006767 | Liver | HCC | water-soluble vitamin metabolic process | 39/7958 | 59/18723 | 2.14e-04 | 1.63e-03 | 39 |
| GO:000608112 | Liver | HCC | cellular aldehyde metabolic process | 39/7958 | 60/18723 | 3.61e-04 | 2.50e-03 | 39 |
| GO:0043094 | Liver | HCC | cellular metabolic compound salvage | 20/7958 | 26/18723 | 3.82e-04 | 2.61e-03 | 20 |
| GO:0072525 | Liver | HCC | pyridine-containing compound biosynthetic process | 22/7958 | 32/18723 | 2.43e-03 | 1.18e-02 | 22 |
| GO:0072524 | Liver | HCC | pyridine-containing compound metabolic process | 25/7958 | 38/18723 | 3.18e-03 | 1.47e-02 | 25 |
| GO:0006766 | Liver | HCC | vitamin metabolic process | 57/7958 | 106/18723 | 1.25e-02 | 4.53e-02 | 57 |
| GO:00060817 | Oral cavity | OSCC | cellular aldehyde metabolic process | 36/7305 | 60/18723 | 7.94e-04 | 4.27e-03 | 36 |
| GO:19016173 | Oral cavity | OSCC | organic hydroxy compound biosynthetic process | 115/7305 | 237/18723 | 1.73e-03 | 8.18e-03 | 115 |
| GO:00060819 | Skin | cSCC | cellular aldehyde metabolic process | 28/4864 | 60/18723 | 4.35e-04 | 3.36e-03 | 28 |
| GO:00067672 | Skin | cSCC | water-soluble vitamin metabolic process | 24/4864 | 59/18723 | 9.59e-03 | 4.30e-02 | 24 |
| Page: 1 |
| Pathway ID | Tissue | Disease Stage | Description | Gene Ratio | Bg Ratio | pvalue | p.adjust | qvalue | Count |
| hsa012405 | Esophagus | ESCC | Biosynthesis of cofactors | 97/4205 | 153/8465 | 3.88e-04 | 1.35e-03 | 6.94e-04 | 97 |
| hsa0124012 | Esophagus | ESCC | Biosynthesis of cofactors | 97/4205 | 153/8465 | 3.88e-04 | 1.35e-03 | 6.94e-04 | 97 |
| hsa012402 | Liver | HCC | Biosynthesis of cofactors | 103/4020 | 153/8465 | 4.67e-07 | 5.05e-06 | 2.81e-06 | 103 |
| hsa012403 | Liver | HCC | Biosynthesis of cofactors | 103/4020 | 153/8465 | 4.67e-07 | 5.05e-06 | 2.81e-06 | 103 |
| hsa012404 | Oral cavity | OSCC | Biosynthesis of cofactors | 88/3704 | 153/8465 | 3.84e-04 | 1.20e-03 | 6.12e-04 | 88 |
| hsa0124011 | Oral cavity | OSCC | Biosynthesis of cofactors | 88/3704 | 153/8465 | 3.84e-04 | 1.20e-03 | 6.12e-04 | 88 |
| Page: 1 |
Top |
Cell-cell communication analysis |
| Identification of potential cell-cell interactions between two cell types and their ligand-receptor pairs for different disease states |
| Ligand | Receptor | LRpair | Pathway | Tissue | Disease Stage |
| Page: 1 |
Top |
Single-cell gene regulatory network inference analysis |
| Find out the significant the regulons (TFs) and the target genes of each regulon across cell types for different disease states |
| TF | Cell Type | Tissue | Disease Stage | Target Gene | RSS | Regulon Activity |
| ∗The dot plots of a searched regulon are shown for all cell subpopulations in each disease state of each tissue based on the regulon specific score inferred using pySCENIC and by calculating the average expression. |
| Page: 1 |
Top |
Somatic mutation of malignant transformation related genes |
| Annotation of somatic variants for genes involved in malignant transformation |
| Hugo Symbol | Variant Class | Variant Classification | dbSNP RS | HGVSc | HGVSp | HGVSp Short | SWISSPROT | BIOTYPE | SIFT | PolyPhen | Tumor Sample Barcode | Tissue | Histology | Sex | Age | Stage | Therapy Types | Drugs | Outcome |
| PDXK | deletion | Frame_Shift_Del | novel | c.485delN | p.Ile162ThrfsTer10 | p.I162Tfs*10 | O00764 | protein_coding | TCGA-D8-A27V-01 | Breast | breast invasive carcinoma | Female | <65 | I/II | Hormone Therapy | tamoxiphen | SD | ||
| PDXK | SNV | Missense_Mutation | novel | c.563N>T | p.Ser188Phe | p.S188F | O00764 | protein_coding | deleterious(0.04) | probably_damaging(0.935) | TCGA-UC-A7PG-06 | Cervix | cervical & endocervical cancer | Female | <65 | III/IV | Chemotherapy | cisplatin | PD |
| PDXK | SNV | Missense_Mutation | c.496G>C | p.Glu166Gln | p.E166Q | O00764 | protein_coding | tolerated(0.19) | benign(0.098) | TCGA-ZJ-AB0H-01 | Cervix | cervical & endocervical cancer | Female | <65 | III/IV | Unknown | Unknown | SD | |
| PDXK | SNV | Missense_Mutation | c.526C>T | p.His176Tyr | p.H176Y | O00764 | protein_coding | deleterious(0.01) | probably_damaging(0.981) | TCGA-CK-6746-01 | Colorectum | colon adenocarcinoma | Female | >=65 | I/II | Unknown | Unknown | SD | |
| PDXK | SNV | Missense_Mutation | c.796N>A | p.Val266Ile | p.V266I | O00764 | protein_coding | tolerated(0.12) | benign(0.368) | TCGA-CM-6676-01 | Colorectum | colon adenocarcinoma | Male | >=65 | I/II | Unknown | Unknown | SD | |
| PDXK | SNV | Missense_Mutation | rs372671985 | c.929N>T | p.Thr310Met | p.T310M | O00764 | protein_coding | deleterious(0.01) | benign(0.282) | TCGA-WS-AB45-01 | Colorectum | colon adenocarcinoma | Female | <65 | I/II | Unknown | Unknown | SD |
| PDXK | SNV | Missense_Mutation | rs200647993 | c.653N>A | p.Arg218His | p.R218H | O00764 | protein_coding | deleterious(0) | possibly_damaging(0.548) | TCGA-AJ-A2QO-01 | Endometrium | uterine corpus endometrioid carcinoma | Female | >=65 | I/II | Unknown | Unknown | SD |
| PDXK | SNV | Missense_Mutation | novel | c.305A>C | p.Lys102Thr | p.K102T | O00764 | protein_coding | deleterious(0) | probably_damaging(0.989) | TCGA-AJ-A3EL-01 | Endometrium | uterine corpus endometrioid carcinoma | Female | <65 | I/II | Unknown | Unknown | SD |
| PDXK | SNV | Missense_Mutation | rs369091058 | c.541G>A | p.Asp181Asn | p.D181N | O00764 | protein_coding | tolerated(0.12) | benign(0.017) | TCGA-AP-A0LM-01 | Endometrium | uterine corpus endometrioid carcinoma | Female | <65 | III/IV | Chemotherapy | cisplatin | SD |
| PDXK | SNV | Missense_Mutation | c.331N>A | p.Val111Met | p.V111M | O00764 | protein_coding | deleterious(0) | probably_damaging(0.999) | TCGA-AX-A2H5-01 | Endometrium | uterine corpus endometrioid carcinoma | Female | >=65 | III/IV | Chemotherapy | carboplatin | CR |
| Page: 1 2 3 |
Top |
Related drugs of malignant transformation related genes |
| Identification of chemicals and drugs interact with genes involved in malignant transfromation |
| (DGIdb 4.0) |
| Entrez ID | Symbol | Category | Interaction Types | Drug Claim Name | Drug Name | PMIDs |
| Page: 1 |

Copyright 2023-Present -The University of Texas Health Science Center at Houston |