
|
|||||
|
 | |
| |
| |
| |
| |
| |
|
Gene: PDXDC1 |
Gene summary for PDXDC1 |
| Gene information | Species | Human | Gene symbol | PDXDC1 | Gene ID | 23042 |
| Gene name | pyridoxal dependent decarboxylase domain containing 1 | |
| Gene Alias | LP8165 | |
| Cytomap | 16p13.11 | |
| Gene Type | protein-coding | GO ID | GO:0006082 | UniProtAcc | Q6P996 |
Top |
Malignant transformation analysis |
| Identification of the aberrant gene expression in precancerous and cancerous lesions by comparing the gene expression of stem-like cells in diseased tissues with normal stem cells |
| Entrez ID | Symbol | Replicates | Species | Organ | Tissue | Adj P-value | Log2FC | Malignancy |
| 23042 | PDXDC1 | CA_HPV_2 | Human | Cervix | CC | 8.83e-05 | 3.43e-01 | 0.0391 |
| 23042 | PDXDC1 | CCI_2 | Human | Cervix | CC | 2.58e-05 | 7.50e-01 | 0.5249 |
| 23042 | PDXDC1 | CCI_3 | Human | Cervix | CC | 5.88e-03 | 5.29e-01 | 0.516 |
| 23042 | PDXDC1 | H2 | Human | Cervix | HSIL_HPV | 1.79e-12 | 3.67e-01 | 0.0632 |
| 23042 | PDXDC1 | HTA11_3410_2000001011 | Human | Colorectum | AD | 9.61e-09 | -3.53e-01 | 0.0155 |
| 23042 | PDXDC1 | HTA11_347_2000001011 | Human | Colorectum | AD | 2.30e-20 | 7.84e-01 | -0.1954 |
| 23042 | PDXDC1 | HTA11_411_2000001011 | Human | Colorectum | SER | 2.83e-15 | 1.03e+00 | -0.2602 |
| 23042 | PDXDC1 | HTA11_99999965062_69753 | Human | Colorectum | MSI-H | 1.66e-05 | 7.89e-01 | 0.3487 |
| 23042 | PDXDC1 | HTA11_99999965104_69814 | Human | Colorectum | MSS | 1.53e-07 | 6.82e-01 | 0.281 |
| 23042 | PDXDC1 | HTA11_99999974143_84620 | Human | Colorectum | MSS | 5.01e-12 | -4.98e-01 | 0.3005 |
| 23042 | PDXDC1 | F007 | Human | Colorectum | FAP | 1.36e-02 | -3.06e-01 | 0.1176 |
| 23042 | PDXDC1 | A001-C-207 | Human | Colorectum | FAP | 4.82e-05 | -2.99e-01 | 0.1278 |
| 23042 | PDXDC1 | A015-C-203 | Human | Colorectum | FAP | 4.26e-45 | -7.08e-01 | -0.1294 |
| 23042 | PDXDC1 | A015-C-204 | Human | Colorectum | FAP | 1.73e-14 | -5.97e-01 | -0.0228 |
| 23042 | PDXDC1 | A014-C-040 | Human | Colorectum | FAP | 7.43e-10 | -5.72e-01 | -0.1184 |
| 23042 | PDXDC1 | A002-C-201 | Human | Colorectum | FAP | 5.40e-18 | -4.60e-01 | 0.0324 |
| 23042 | PDXDC1 | A002-C-203 | Human | Colorectum | FAP | 3.96e-07 | -2.32e-01 | 0.2786 |
| 23042 | PDXDC1 | A001-C-119 | Human | Colorectum | FAP | 4.60e-07 | -3.40e-01 | -0.1557 |
| 23042 | PDXDC1 | A001-C-108 | Human | Colorectum | FAP | 1.50e-18 | -3.72e-01 | -0.0272 |
| 23042 | PDXDC1 | A002-C-205 | Human | Colorectum | FAP | 4.09e-28 | -3.96e-01 | -0.1236 |
| Page: 1 2 3 4 5 6 7 8 |
| Tissue | Expression Dynamics | Abbreviation |
| Cervix |  | CC: Cervix cancer |
| HSIL_HPV: HPV-infected high-grade squamous intraepithelial lesions | ||
| N_HPV: HPV-infected normal cervix | ||
| Colorectum (GSE201348) | 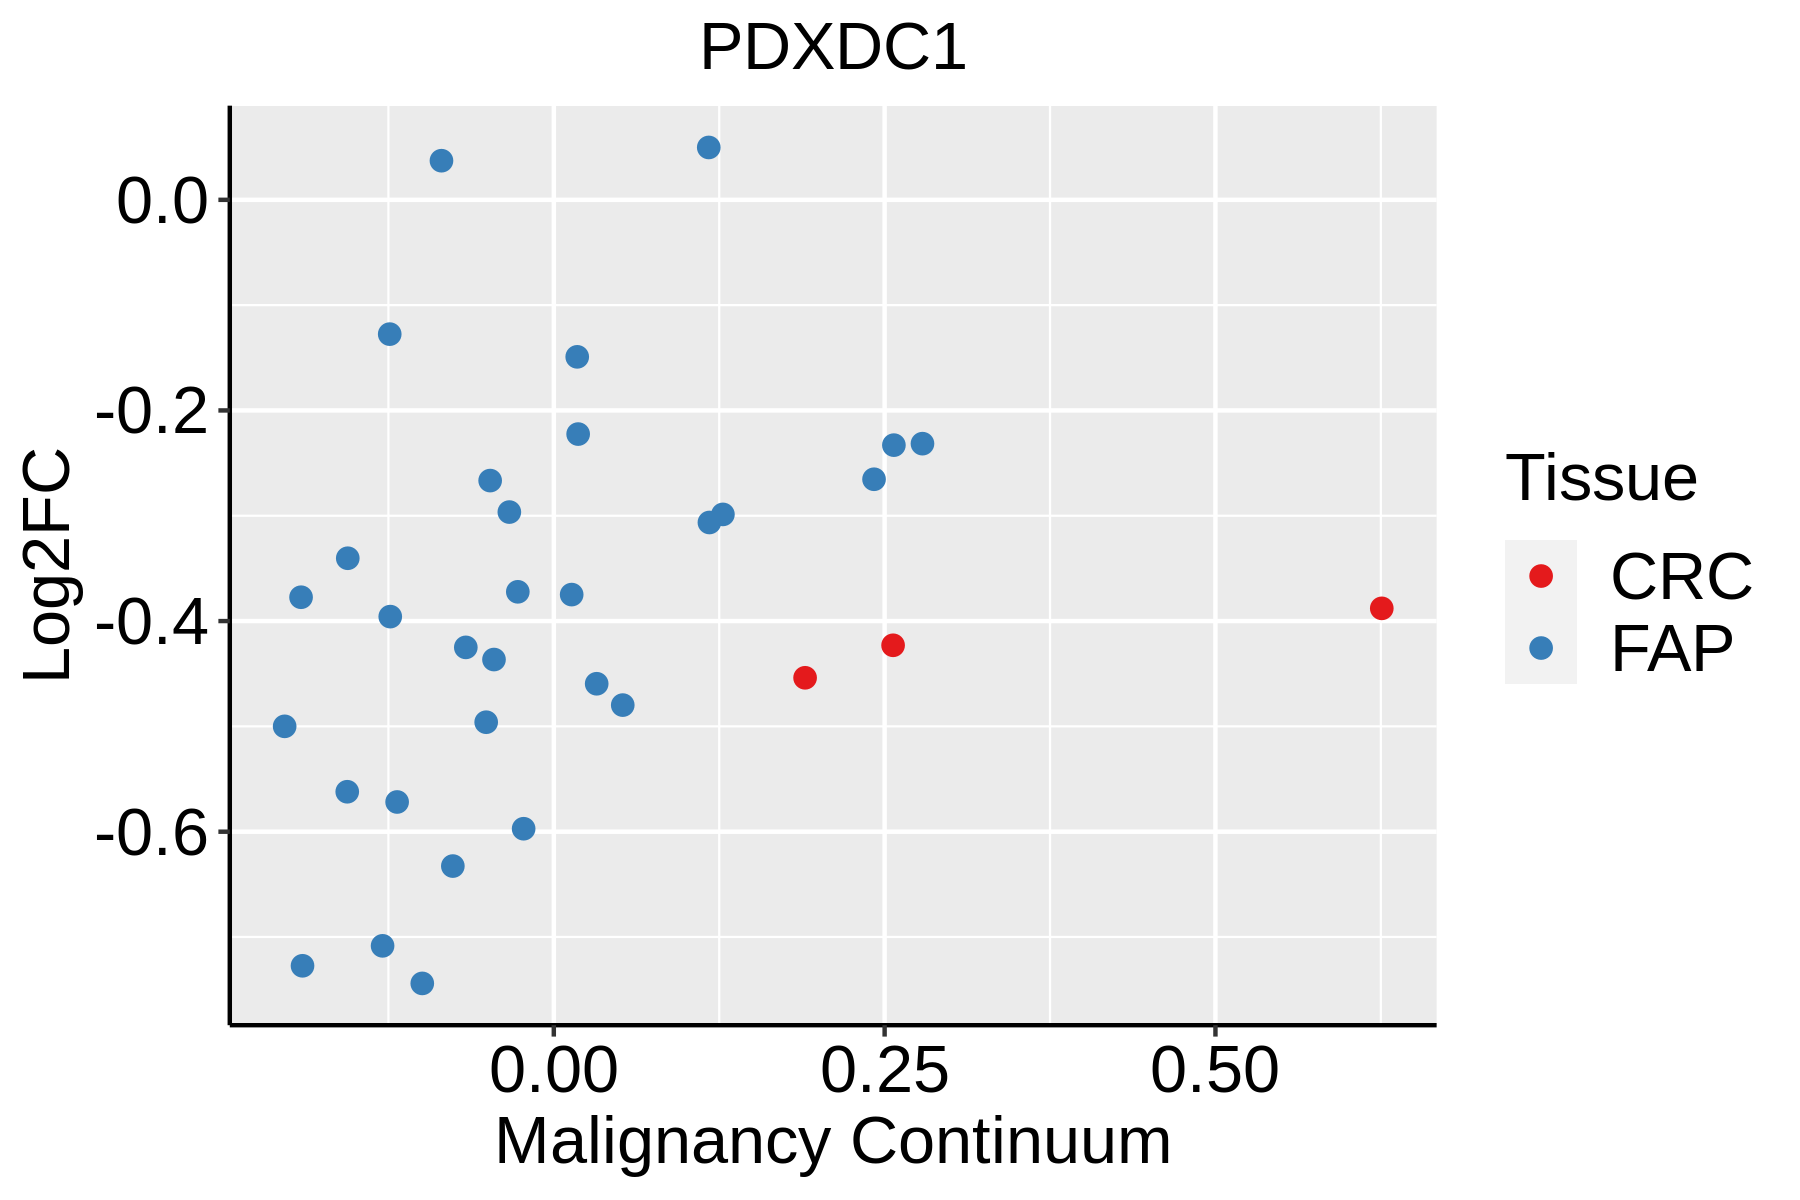 | FAP: Familial adenomatous polyposis |
| CRC: Colorectal cancer | ||
| Colorectum (HTA11) |  | AD: Adenomas |
| SER: Sessile serrated lesions | ||
| MSI-H: Microsatellite-high colorectal cancer | ||
| MSS: Microsatellite stable colorectal cancer | ||
| Esophagus | 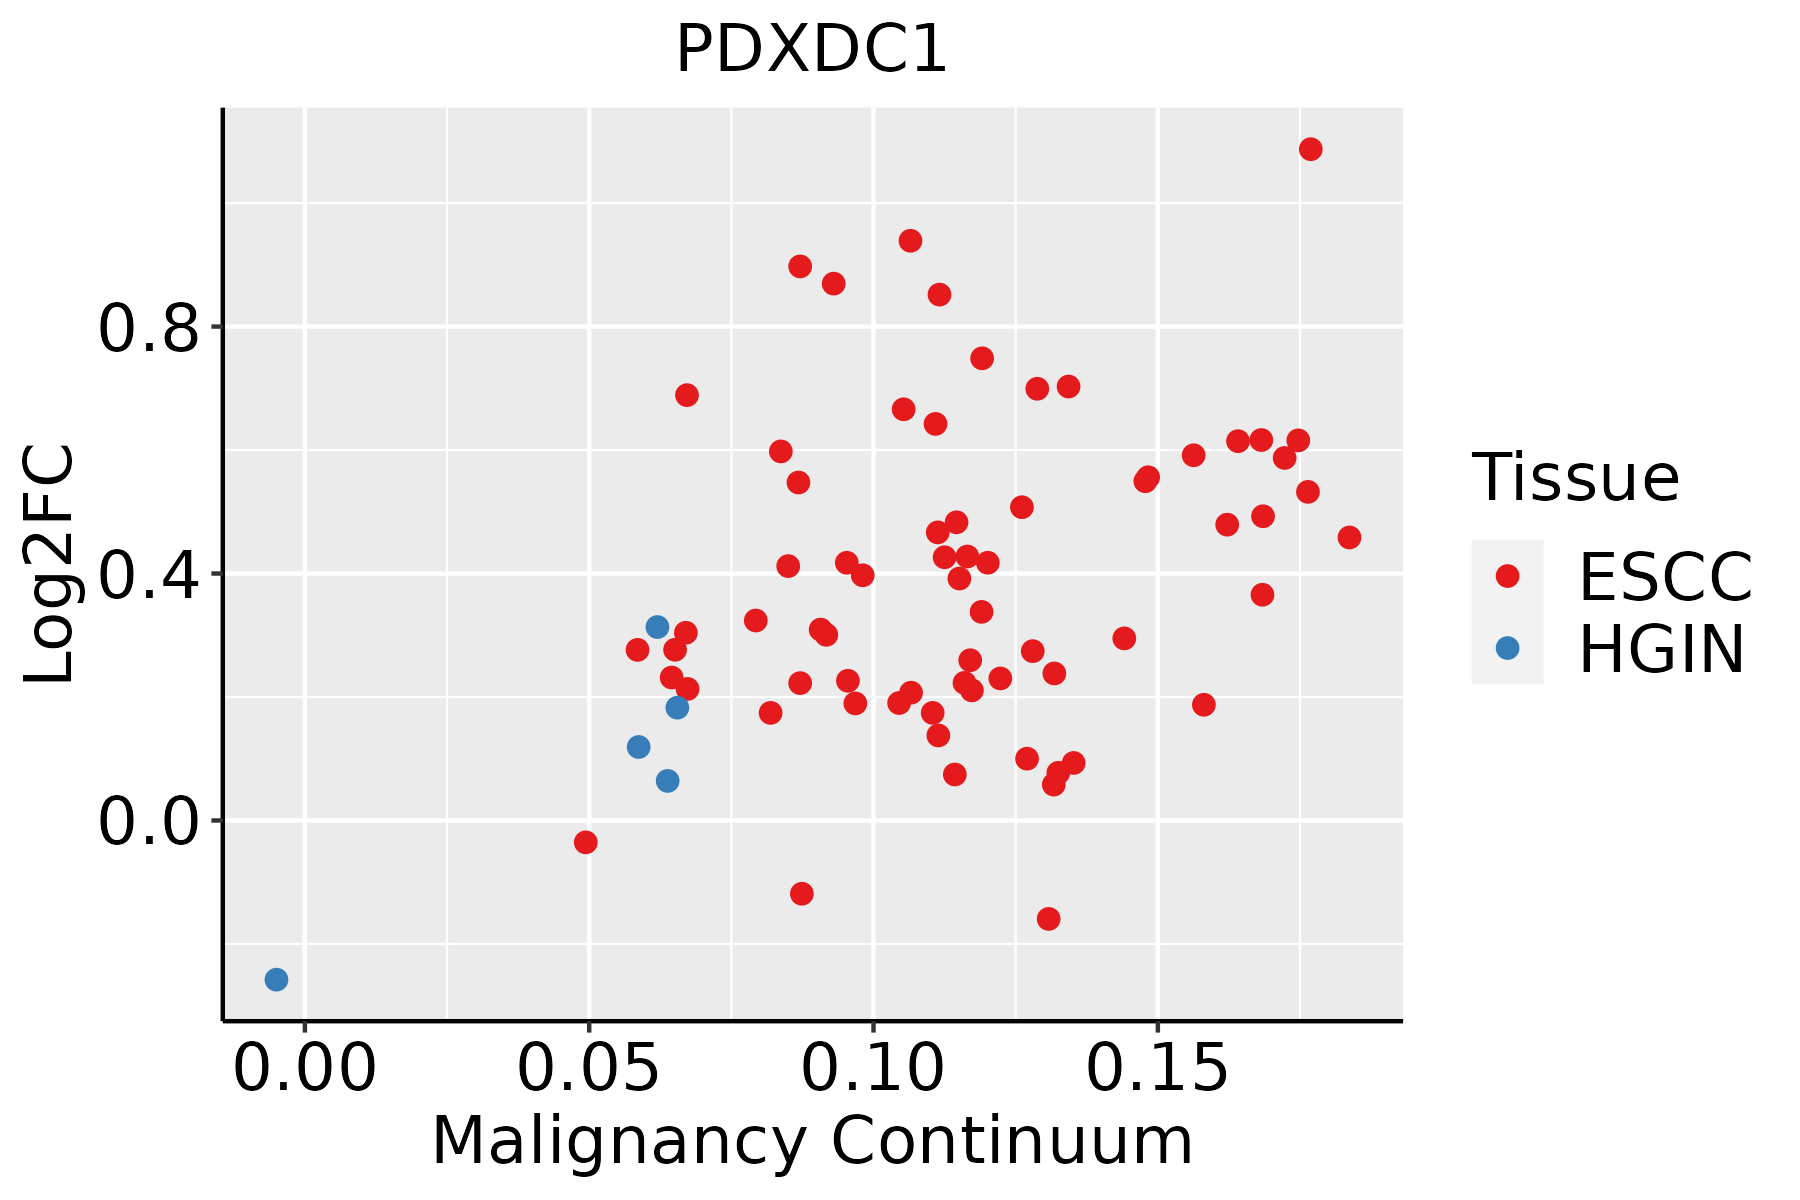 | ESCC: Esophageal squamous cell carcinoma |
| HGIN: High-grade intraepithelial neoplasias | ||
| LGIN: Low-grade intraepithelial neoplasias | ||
| Liver | 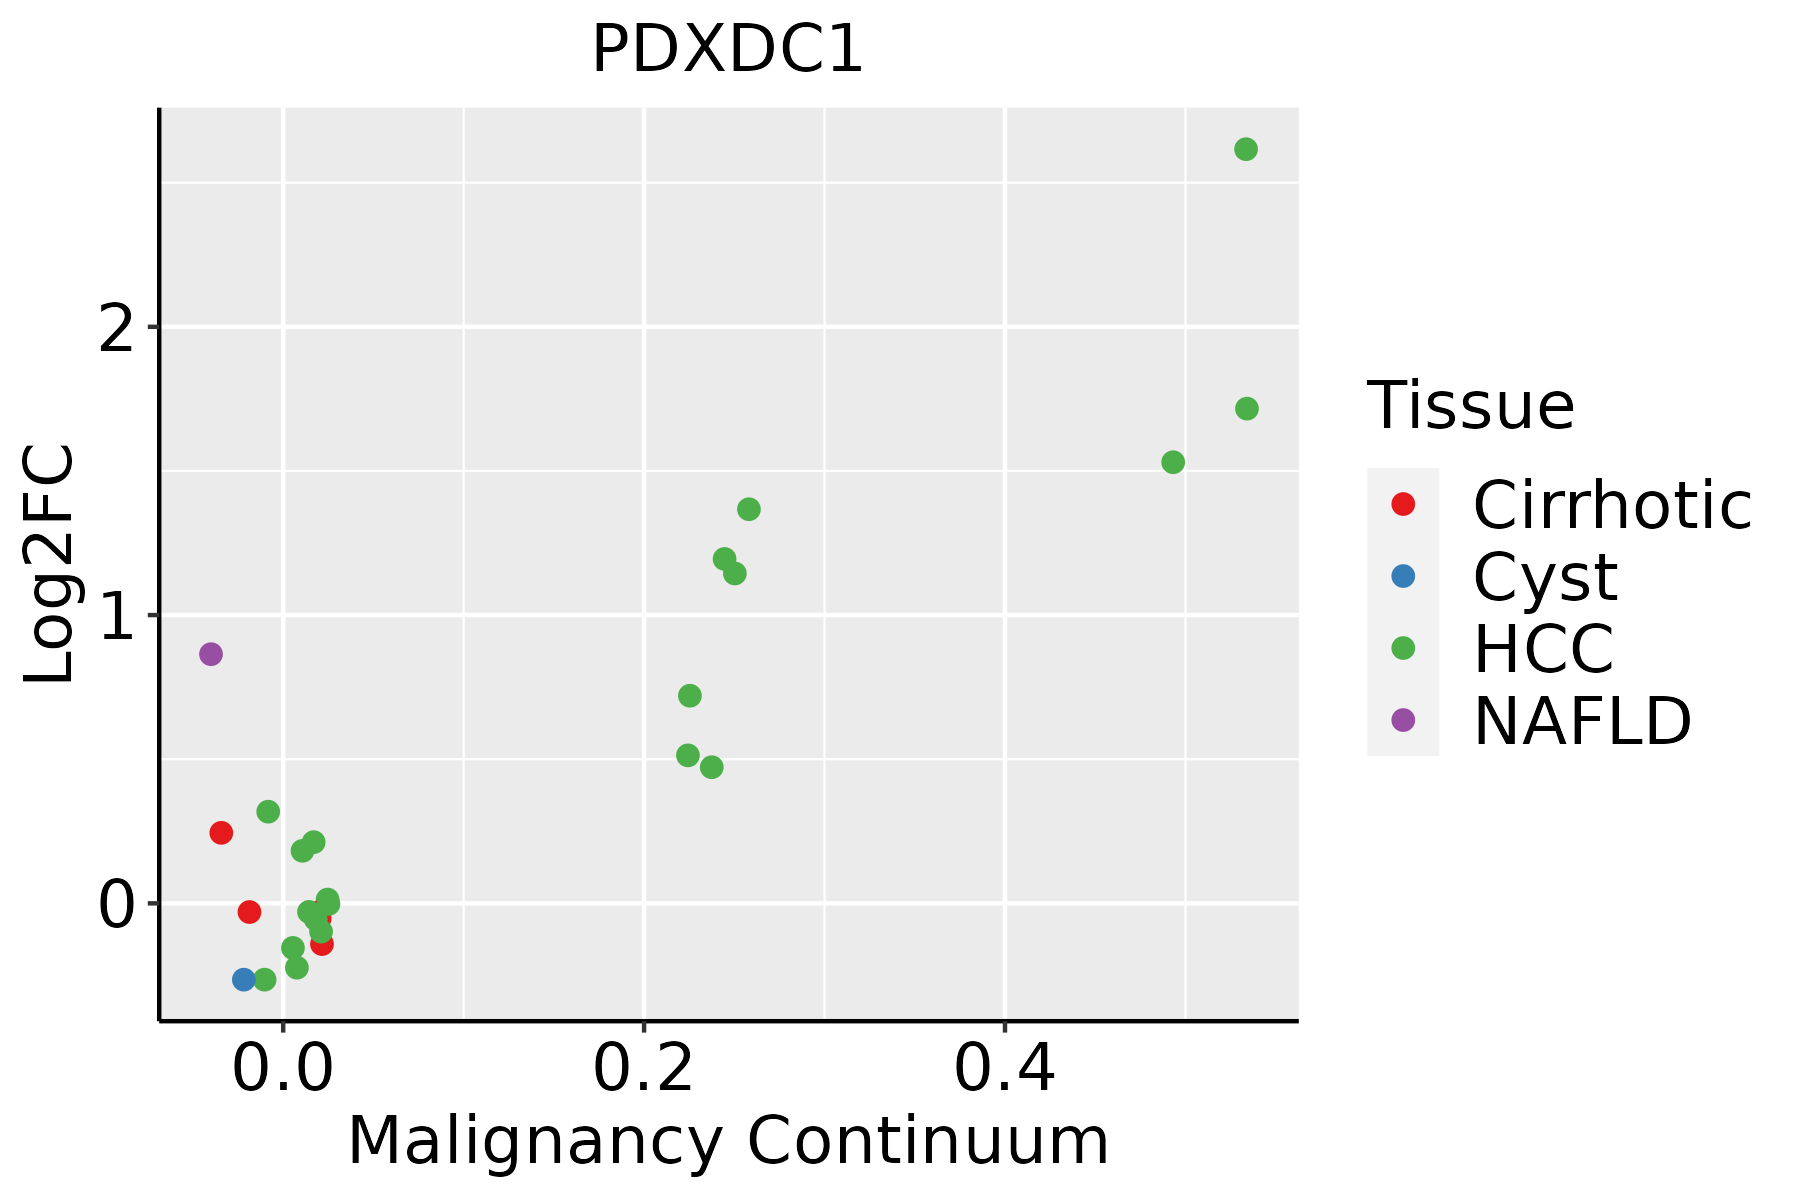 | HCC: Hepatocellular carcinoma |
| NAFLD: Non-alcoholic fatty liver disease | ||
| Oral Cavity |  | EOLP: Erosive Oral lichen planus |
| LP: leukoplakia | ||
| NEOLP: Non-erosive oral lichen planus | ||
| OSCC: Oral squamous cell carcinoma | ||
| Prostate | 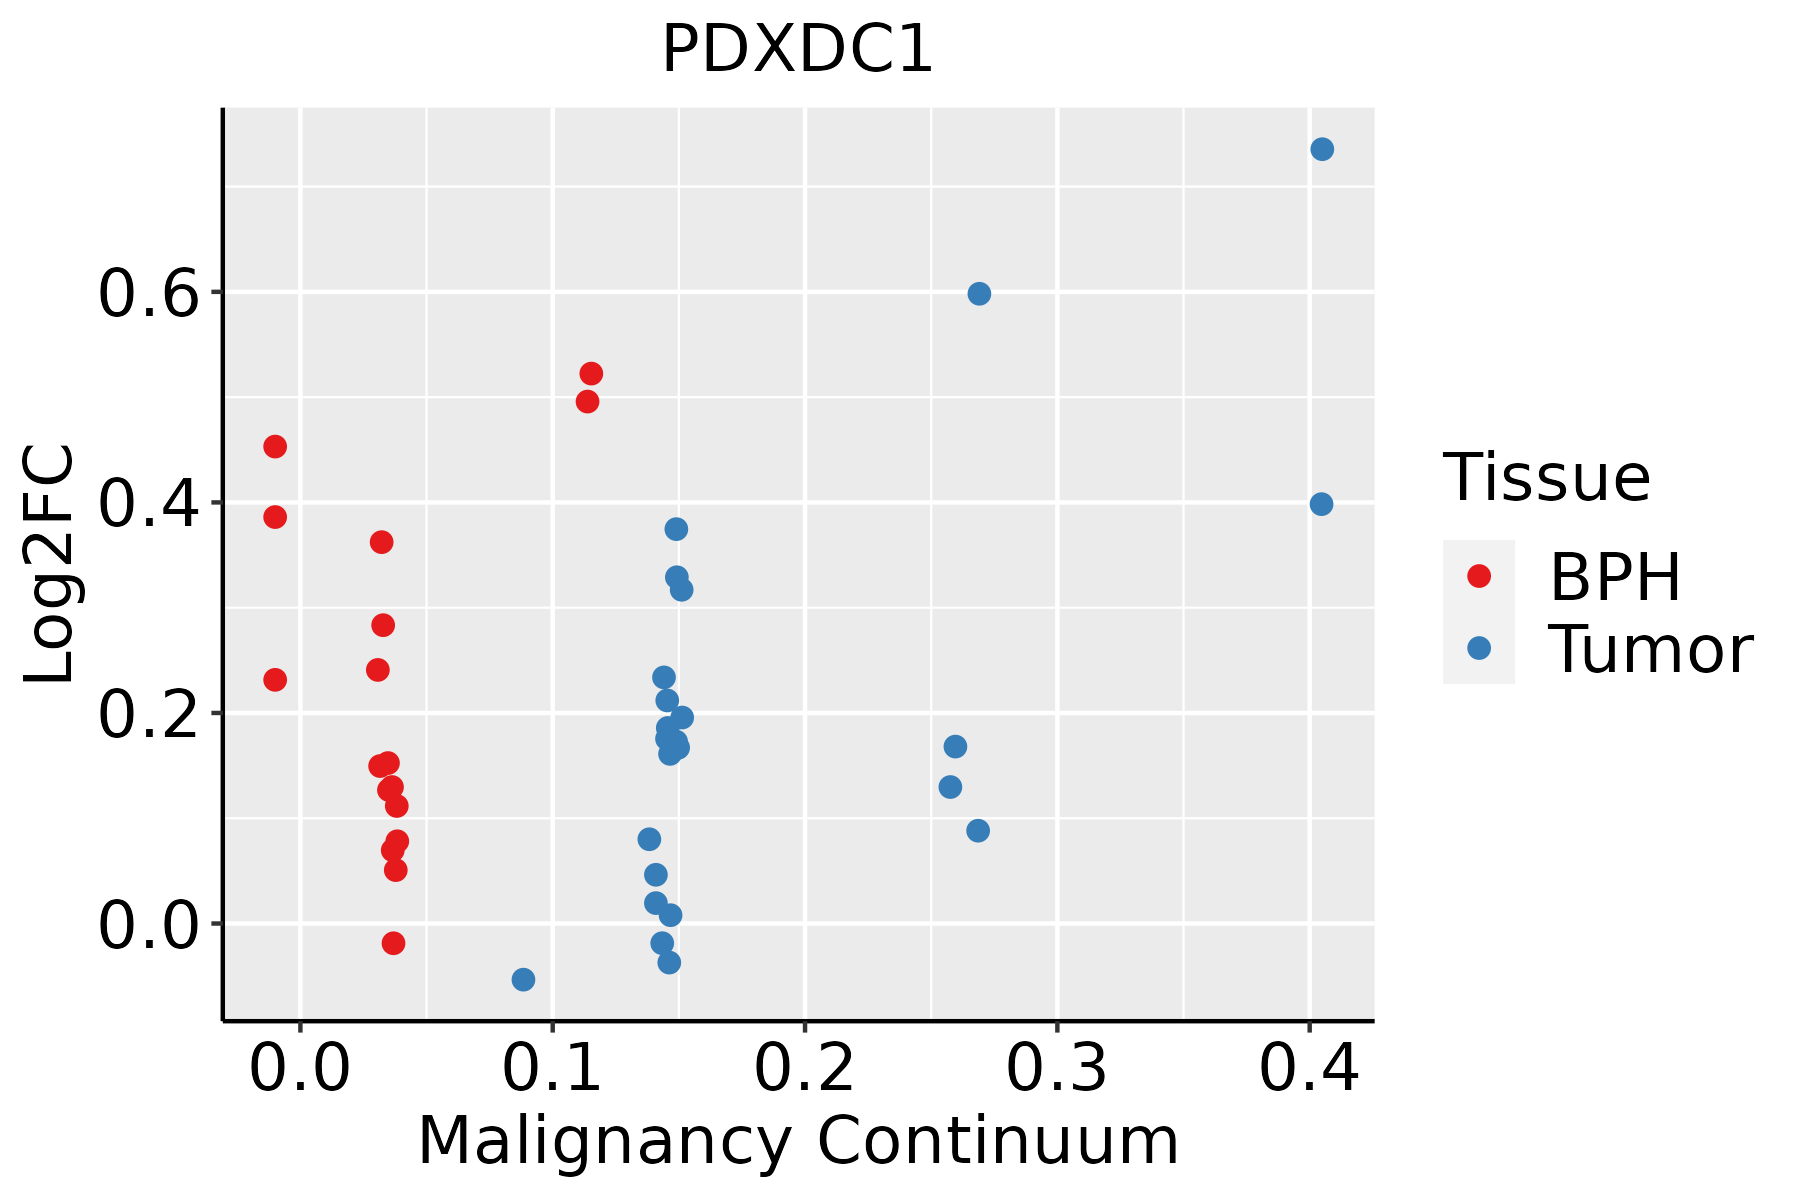 | BPH: Benign Prostatic Hyperplasia |
| Thyroid |  | ATC: Anaplastic thyroid cancer |
| HT: Hashimoto's thyroiditis | ||
| PTC: Papillary thyroid cancer |
| ∗log2FC in expression of this searched gene in stem-like cells from each diseased tissue sample relative to stem-like cells in normal samples in each tissue plotted against the malignancy continuum. Samples are colored based on if they are from different disease stage. |
Top |
Malignant transformation related pathway analysis |
| Find out the enriched GO biological processes and KEGG pathways involved in transition from healthy to precancer to cancer |
| Tissue | Disease Stage | Enriched GO biological Processes |
| Colorectum | AD |  |
| Colorectum | SER |  |
| Colorectum | MSS |  |
| Colorectum | MSI-H |  |
| Colorectum | FAP |  |
| ∗Top 15 enriched GO BP terms are showed in the bar plot of each disease state in each tissue. Each row represents a significant GO biological process which is colored according to the -log10(p.adjust). |
| Page: 1 2 3 4 5 6 7 8 9 |
| GO ID | Tissue | Disease Stage | Description | Gene Ratio | Bg Ratio | pvalue | p.adjust | Count |
| Page: 1 |
| Pathway ID | Tissue | Disease Stage | Description | Gene Ratio | Bg Ratio | pvalue | p.adjust | qvalue | Count |
| Page: 1 |
Top |
Cell-cell communication analysis |
| Identification of potential cell-cell interactions between two cell types and their ligand-receptor pairs for different disease states |
| Ligand | Receptor | LRpair | Pathway | Tissue | Disease Stage |
| Page: 1 |
Top |
Single-cell gene regulatory network inference analysis |
| Find out the significant the regulons (TFs) and the target genes of each regulon across cell types for different disease states |
| TF | Cell Type | Tissue | Disease Stage | Target Gene | RSS | Regulon Activity |
| ∗The dot plots of a searched regulon are shown for all cell subpopulations in each disease state of each tissue based on the regulon specific score inferred using pySCENIC and by calculating the average expression. |
| Page: 1 |
Top |
Somatic mutation of malignant transformation related genes |
| Annotation of somatic variants for genes involved in malignant transformation |
| Hugo Symbol | Variant Class | Variant Classification | dbSNP RS | HGVSc | HGVSp | HGVSp Short | SWISSPROT | BIOTYPE | SIFT | PolyPhen | Tumor Sample Barcode | Tissue | Histology | Sex | Age | Stage | Therapy Types | Drugs | Outcome |
| PDXDC1 | SNV | Missense_Mutation | c.881N>A | p.Ser294Asn | p.S294N | Q6P996 | protein_coding | deleterious(0) | probably_damaging(1) | TCGA-AN-A0AK-01 | Breast | breast invasive carcinoma | Female | >=65 | I/II | Unknown | Unknown | SD | |
| PDXDC1 | SNV | Missense_Mutation | c.1006C>T | p.Leu336Phe | p.L336F | Q6P996 | protein_coding | deleterious(0) | probably_damaging(0.992) | TCGA-AR-A1AI-01 | Breast | breast invasive carcinoma | Female | <65 | I/II | Chemotherapy | cytoxan | PD | |
| PDXDC1 | SNV | Missense_Mutation | c.496N>C | p.Phe166Leu | p.F166L | Q6P996 | protein_coding | deleterious(0.01) | possibly_damaging(0.559) | TCGA-BH-A0DL-01 | Breast | breast invasive carcinoma | Female | <65 | I/II | Chemotherapy | cytoxan | CR | |
| PDXDC1 | SNV | Missense_Mutation | novel | c.93N>C | p.Gln31His | p.Q31H | Q6P996 | protein_coding | deleterious(0.03) | benign(0.014) | TCGA-EW-A6SD-01 | Breast | breast invasive carcinoma | Female | <65 | I/II | Chemotherapy | tch | SD |
| PDXDC1 | SNV | Missense_Mutation | novel | c.1768N>A | p.Glu590Lys | p.E590K | Q6P996 | protein_coding | tolerated(0.21) | possibly_damaging(0.576) | TCGA-PE-A5DE-01 | Breast | breast invasive carcinoma | Female | <65 | I/II | Chemotherapy | taxotere | CR |
| PDXDC1 | insertion | Frame_Shift_Ins | novel | c.2145_2146insATCTTGGTAGCCGTGGGATTCA | p.Ala716IlefsTer11 | p.A716Ifs*11 | Q6P996 | protein_coding | TCGA-A8-A08Z-01 | Breast | breast invasive carcinoma | Female | >=65 | III/IV | Unknown | Unknown | SD | ||
| PDXDC1 | insertion | Frame_Shift_Ins | novel | c.1656_1657insGTATCTTACCATTTCGGTCGAAC | p.Asn553ValfsTer15 | p.N553Vfs*15 | Q6P996 | protein_coding | TCGA-A8-A09D-01 | Breast | breast invasive carcinoma | Female | <65 | I/II | Chemotherapy | doxorubicin | CR | ||
| PDXDC1 | insertion | Frame_Shift_Ins | novel | c.862_863insAA | p.Ala288GlufsTer9 | p.A288Efs*9 | Q6P996 | protein_coding | TCGA-AN-A03X-01 | Breast | breast invasive carcinoma | Female | >=65 | I/II | Unknown | Unknown | SD | ||
| PDXDC1 | insertion | Nonsense_Mutation | novel | c.373_374insAATATAATATATAA | p.Leu125GlnfsTer5 | p.L125Qfs*5 | Q6P996 | protein_coding | TCGA-AO-A03R-01 | Breast | breast invasive carcinoma | Female | <65 | I/II | Chemotherapy | doxorubicin | SD | ||
| PDXDC1 | SNV | Missense_Mutation | novel | c.519G>T | p.Lys173Asn | p.K173N | Q6P996 | protein_coding | tolerated(0.16) | benign(0.003) | TCGA-2W-A8YY-01 | Cervix | cervical & endocervical cancer | Female | <65 | I/II | Chemotherapy | cisplatin | CR |
| Page: 1 2 3 4 5 6 7 8 9 |
Top |
Related drugs of malignant transformation related genes |
| Identification of chemicals and drugs interact with genes involved in malignant transfromation |
| (DGIdb 4.0) |
| Entrez ID | Symbol | Category | Interaction Types | Drug Claim Name | Drug Name | PMIDs |
| Page: 1 |

Copyright 2023-Present -The University of Texas Health Science Center at Houston |