
|
|||||
|
 | |
| |
| |
| |
| |
| |
|
Gene: PDSS2 |
Gene summary for PDSS2 |
| Gene information | Species | Human | Gene symbol | PDSS2 | Gene ID | 57107 |
| Gene name | decaprenyl diphosphate synthase subunit 2 | |
| Gene Alias | C6orf210 | |
| Cytomap | 6q21 | |
| Gene Type | protein-coding | GO ID | GO:0006629 | UniProtAcc | Q86YH6 |
Top |
Malignant transformation analysis |
| Identification of the aberrant gene expression in precancerous and cancerous lesions by comparing the gene expression of stem-like cells in diseased tissues with normal stem cells |
| Entrez ID | Symbol | Replicates | Species | Organ | Tissue | Adj P-value | Log2FC | Malignancy |
| 57107 | PDSS2 | GSM4909315 | Human | Breast | IDC | 5.64e-71 | 1.26e+00 | 0.21 |
| 57107 | PDSS2 | GSM4909316 | Human | Breast | IDC | 9.53e-27 | 1.10e+00 | 0.21 |
| 57107 | PDSS2 | DCIS2 | Human | Breast | DCIS | 2.38e-18 | 7.28e-02 | 0.0085 |
| 57107 | PDSS2 | CCI_2 | Human | Cervix | CC | 4.28e-09 | 8.47e-01 | 0.5249 |
| 57107 | PDSS2 | CCI_3 | Human | Cervix | CC | 3.83e-12 | 6.70e-01 | 0.516 |
| 57107 | PDSS2 | HTA11_347_2000001011 | Human | Colorectum | AD | 7.12e-10 | 5.44e-01 | -0.1954 |
| 57107 | PDSS2 | HTA11_10711_2000001011 | Human | Colorectum | AD | 2.66e-02 | -2.42e-01 | 0.0338 |
| 57107 | PDSS2 | HTA11_99999974143_84620 | Human | Colorectum | MSS | 5.89e-11 | -5.37e-01 | 0.3005 |
| 57107 | PDSS2 | A001-C-207 | Human | Colorectum | FAP | 1.50e-04 | -2.36e-01 | 0.1278 |
| 57107 | PDSS2 | A015-C-203 | Human | Colorectum | FAP | 9.29e-35 | -4.60e-01 | -0.1294 |
| 57107 | PDSS2 | A015-C-204 | Human | Colorectum | FAP | 2.99e-07 | -4.63e-01 | -0.0228 |
| 57107 | PDSS2 | A014-C-040 | Human | Colorectum | FAP | 2.19e-05 | -4.96e-01 | -0.1184 |
| 57107 | PDSS2 | A002-C-201 | Human | Colorectum | FAP | 3.84e-14 | -3.27e-01 | 0.0324 |
| 57107 | PDSS2 | A002-C-203 | Human | Colorectum | FAP | 9.82e-04 | -9.49e-02 | 0.2786 |
| 57107 | PDSS2 | A001-C-119 | Human | Colorectum | FAP | 2.27e-07 | -4.00e-01 | -0.1557 |
| 57107 | PDSS2 | A001-C-108 | Human | Colorectum | FAP | 5.44e-15 | -3.14e-01 | -0.0272 |
| 57107 | PDSS2 | A002-C-205 | Human | Colorectum | FAP | 5.40e-26 | -4.85e-01 | -0.1236 |
| 57107 | PDSS2 | A001-C-104 | Human | Colorectum | FAP | 8.90e-06 | -3.18e-01 | 0.0184 |
| 57107 | PDSS2 | A015-C-005 | Human | Colorectum | FAP | 1.89e-04 | -2.87e-01 | -0.0336 |
| 57107 | PDSS2 | A015-C-006 | Human | Colorectum | FAP | 4.89e-19 | -4.93e-01 | -0.0994 |
| Page: 1 2 3 4 5 6 7 |
| Tissue | Expression Dynamics | Abbreviation |
| Breast | 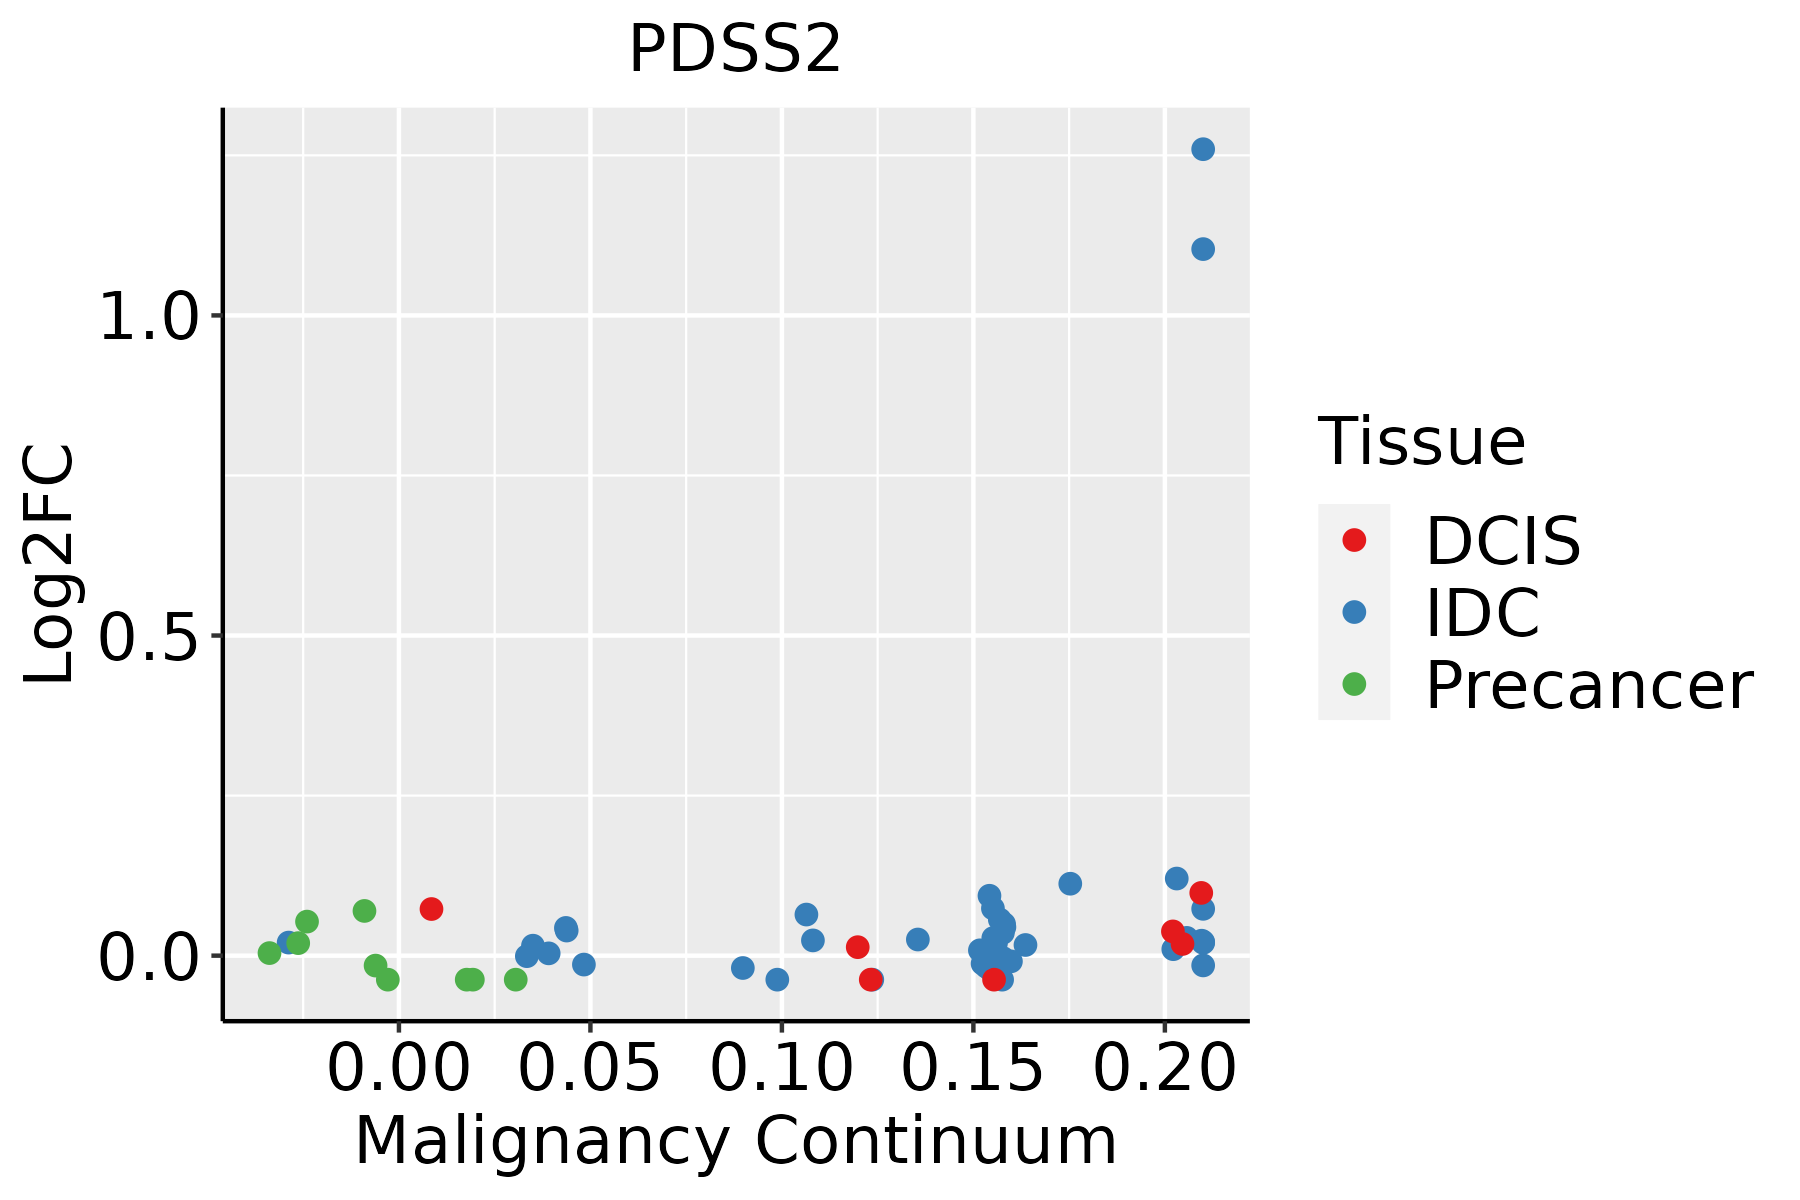 | IDC: Invasive ductal carcinoma |
| DCIS: Ductal carcinoma in situ | ||
| Precancer(BRCA1-mut): Precancerous lesion from BRCA1 mutation carriers | ||
| Cervix | 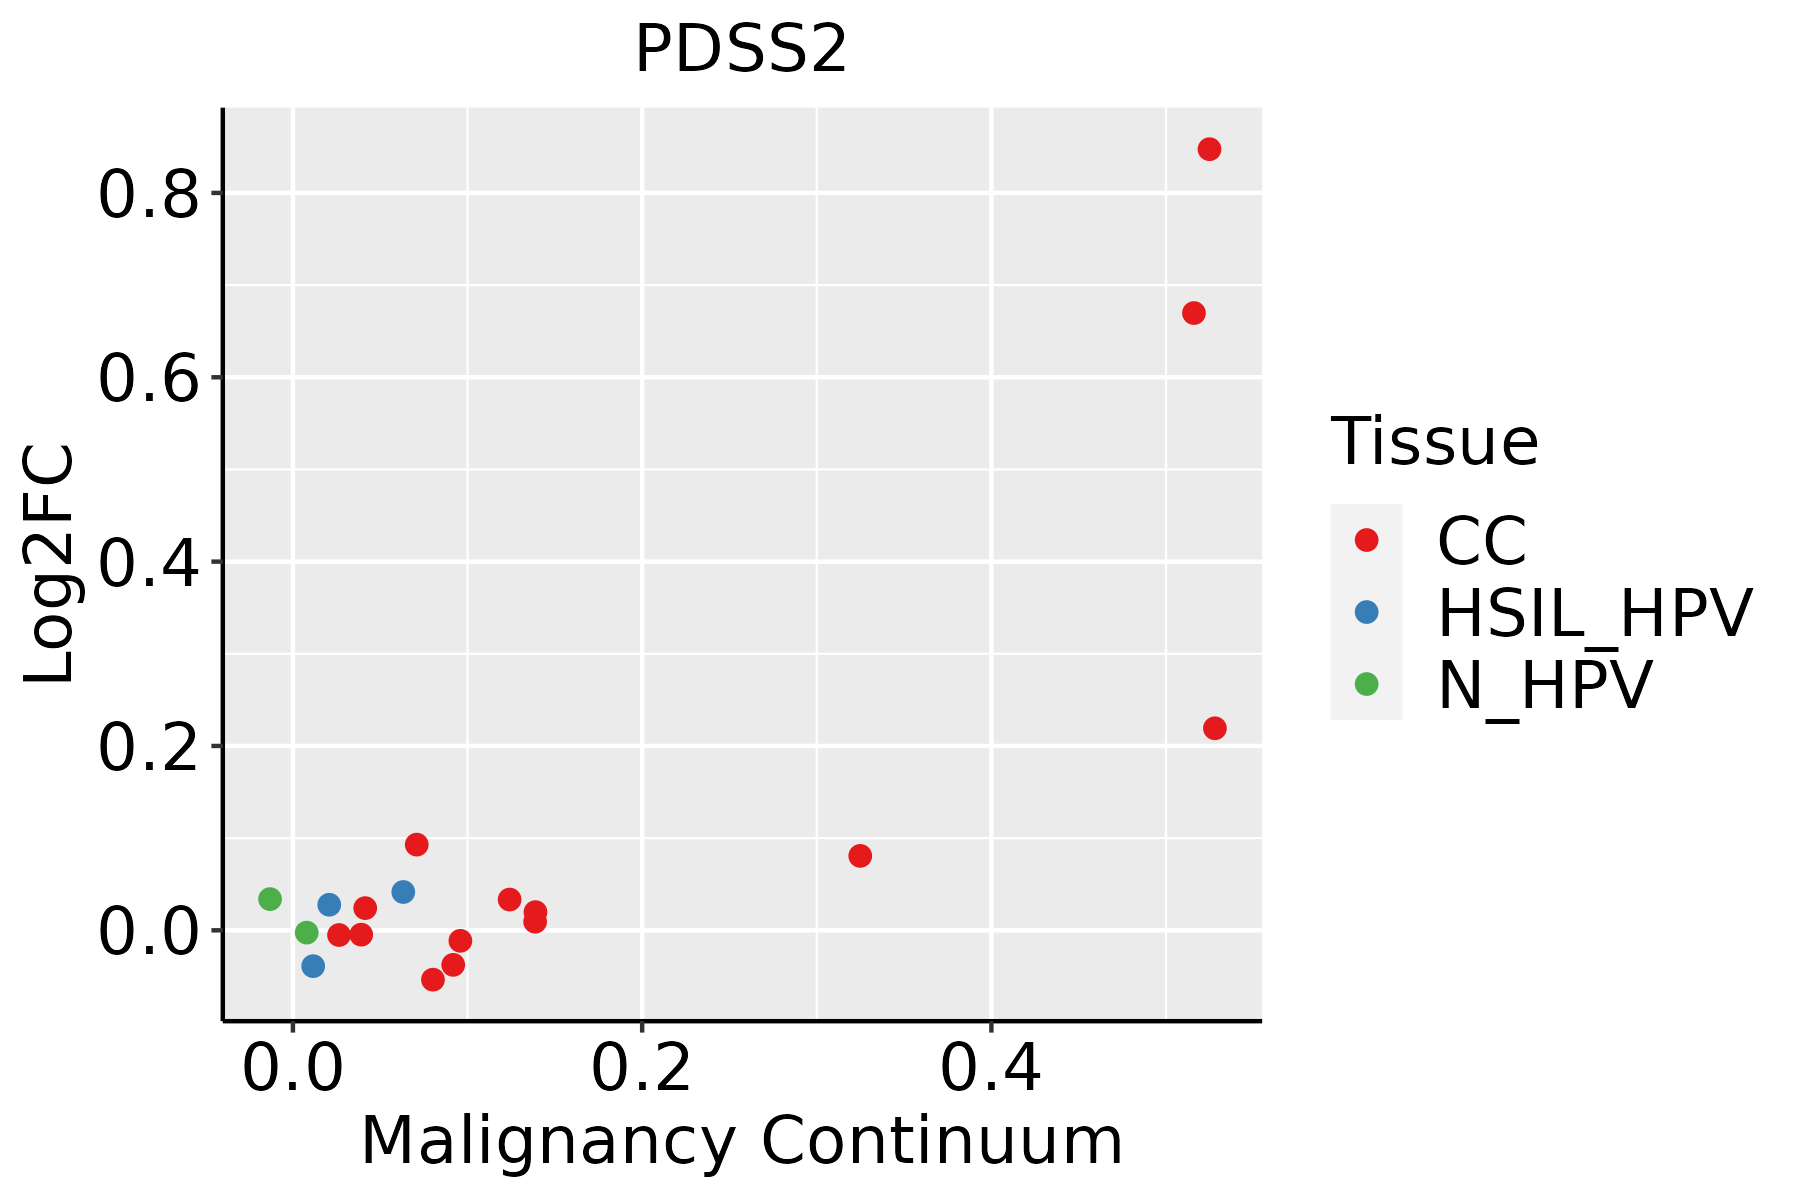 | CC: Cervix cancer |
| HSIL_HPV: HPV-infected high-grade squamous intraepithelial lesions | ||
| N_HPV: HPV-infected normal cervix | ||
| Colorectum (GSE201348) |  | FAP: Familial adenomatous polyposis |
| CRC: Colorectal cancer | ||
| Colorectum (HTA11) |  | AD: Adenomas |
| SER: Sessile serrated lesions | ||
| MSI-H: Microsatellite-high colorectal cancer | ||
| MSS: Microsatellite stable colorectal cancer | ||
| Esophagus | 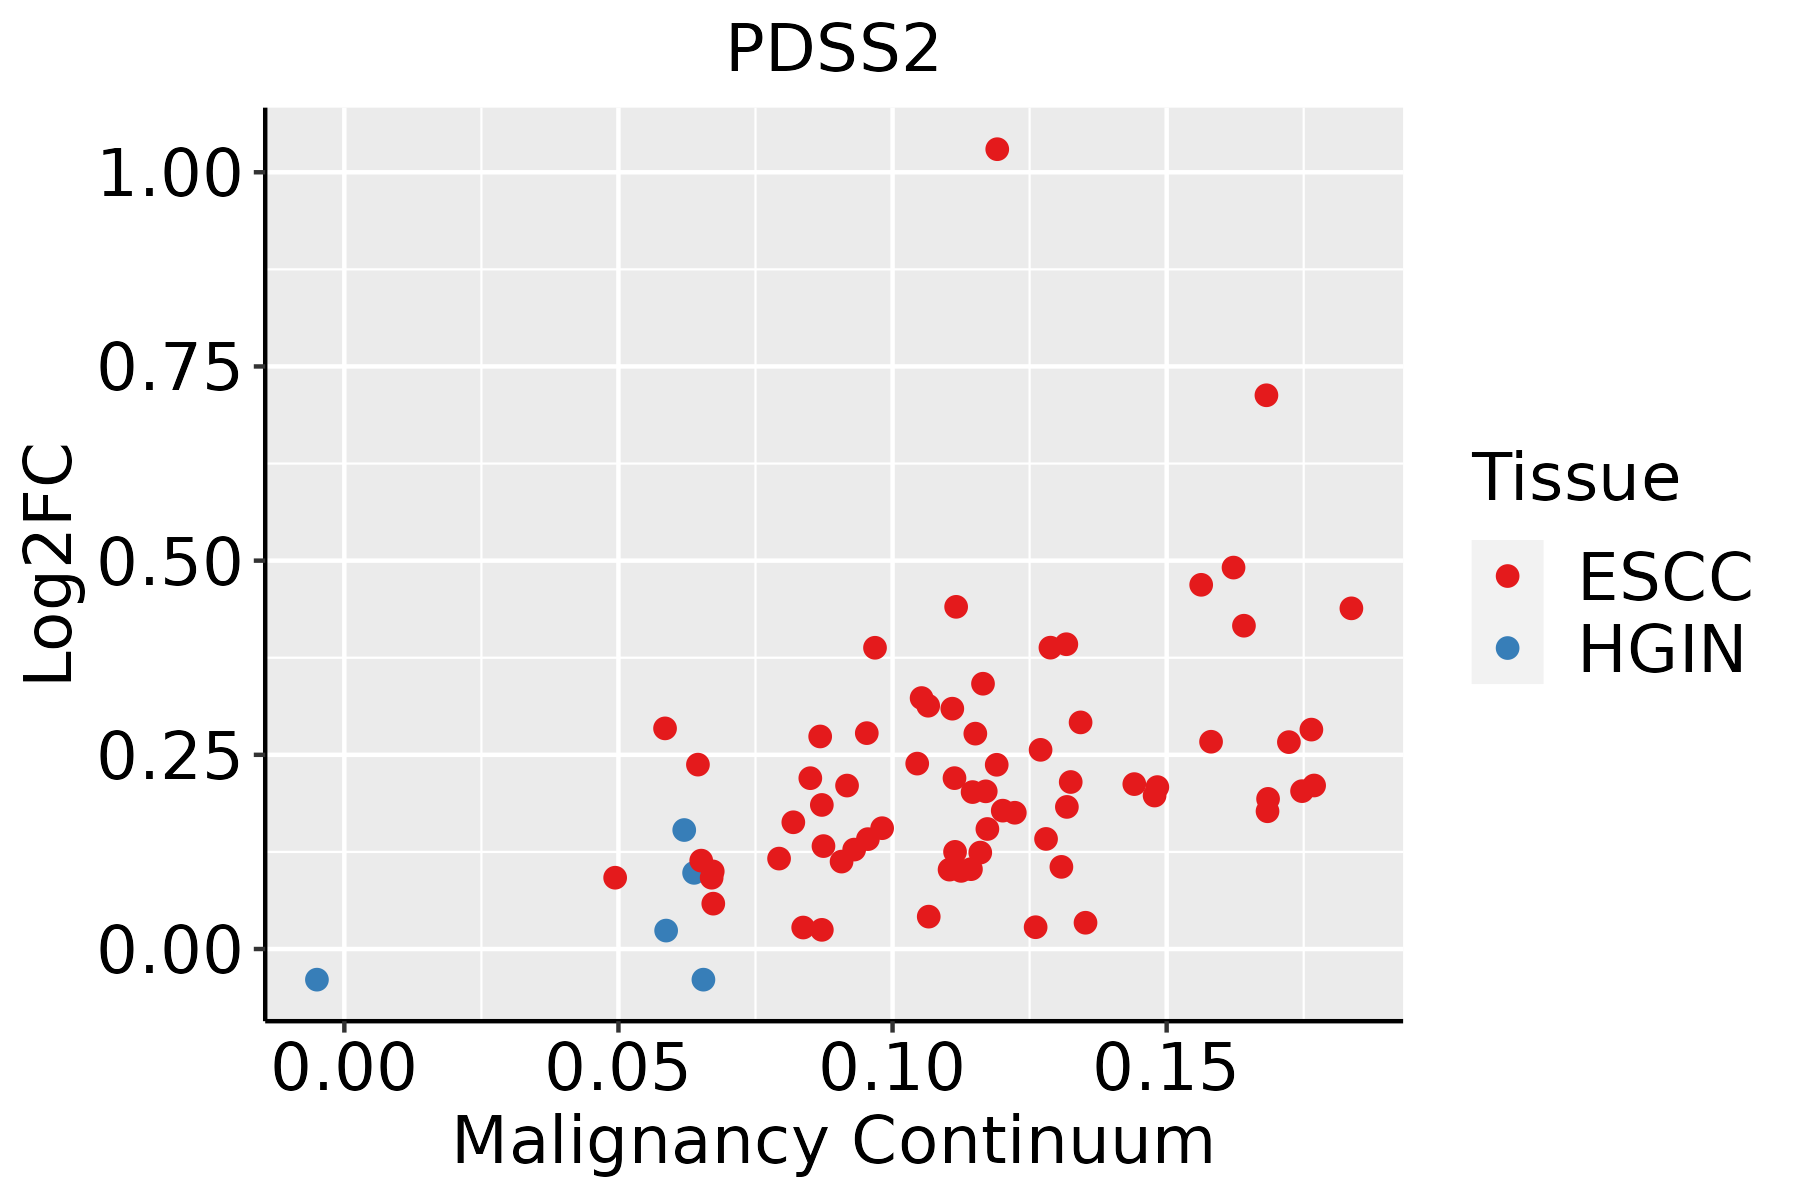 | ESCC: Esophageal squamous cell carcinoma |
| HGIN: High-grade intraepithelial neoplasias | ||
| LGIN: Low-grade intraepithelial neoplasias | ||
| Lung | 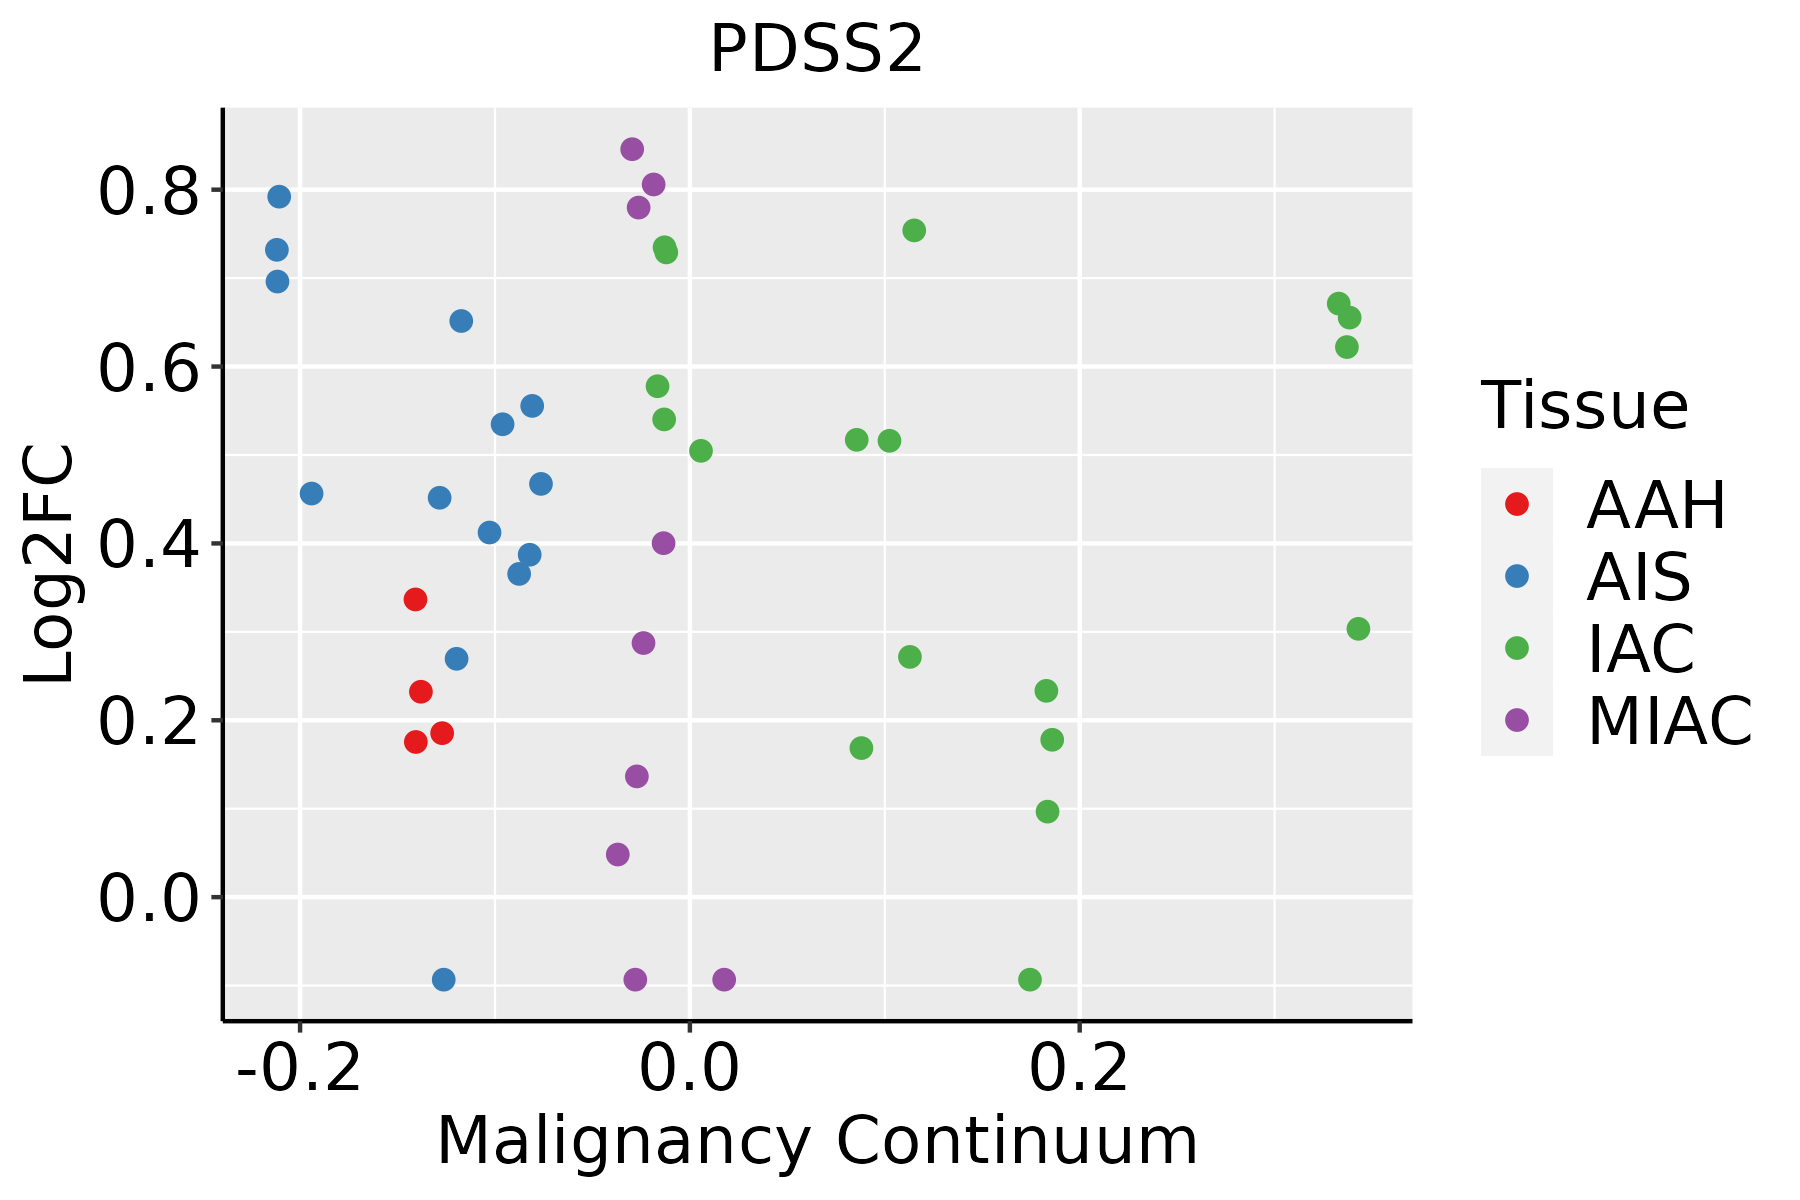 | AAH: Atypical adenomatous hyperplasia |
| AIS: Adenocarcinoma in situ | ||
| IAC: Invasive lung adenocarcinoma | ||
| MIA: Minimally invasive adenocarcinoma | ||
| Oral Cavity |  | EOLP: Erosive Oral lichen planus |
| LP: leukoplakia | ||
| NEOLP: Non-erosive oral lichen planus | ||
| OSCC: Oral squamous cell carcinoma |
| ∗log2FC in expression of this searched gene in stem-like cells from each diseased tissue sample relative to stem-like cells in normal samples in each tissue plotted against the malignancy continuum. Samples are colored based on if they are from different disease stage. |
Top |
Malignant transformation related pathway analysis |
| Find out the enriched GO biological processes and KEGG pathways involved in transition from healthy to precancer to cancer |
| Tissue | Disease Stage | Enriched GO biological Processes |
| Colorectum | AD |  |
| Colorectum | SER |  |
| Colorectum | MSS |  |
| Colorectum | MSI-H |  |
| Colorectum | FAP |  |
| ∗Top 15 enriched GO BP terms are showed in the bar plot of each disease state in each tissue. Each row represents a significant GO biological process which is colored according to the -log10(p.adjust). |
| Page: 1 2 3 4 5 6 7 8 9 |
| GO ID | Tissue | Disease Stage | Description | Gene Ratio | Bg Ratio | pvalue | p.adjust | Count |
| GO:005087813 | Breast | IDC | regulation of body fluid levels | 50/1434 | 379/18723 | 1.12e-04 | 2.10e-03 | 50 |
| GO:005087823 | Breast | DCIS | regulation of body fluid levels | 50/1390 | 379/18723 | 5.17e-05 | 1.06e-03 | 50 |
| GO:005087810 | Cervix | CC | regulation of body fluid levels | 78/2311 | 379/18723 | 3.20e-06 | 8.77e-05 | 78 |
| GO:0050878 | Colorectum | AD | regulation of body fluid levels | 108/3918 | 379/18723 | 2.54e-04 | 3.20e-03 | 108 |
| GO:00508782 | Colorectum | MSS | regulation of body fluid levels | 99/3467 | 379/18723 | 1.40e-04 | 2.07e-03 | 99 |
| GO:00508784 | Colorectum | FAP | regulation of body fluid levels | 79/2622 | 379/18723 | 1.52e-04 | 2.35e-03 | 79 |
| GO:00508785 | Colorectum | CRC | regulation of body fluid levels | 65/2078 | 379/18723 | 2.38e-04 | 3.96e-03 | 65 |
| GO:190166112 | Esophagus | ESCC | quinone metabolic process | 34/8552 | 40/18723 | 3.00e-07 | 4.27e-06 | 34 |
| GO:00067432 | Esophagus | ESCC | ubiquinone metabolic process | 17/8552 | 19/18723 | 9.02e-05 | 6.50e-04 | 17 |
| GO:00067442 | Esophagus | ESCC | ubiquinone biosynthetic process | 15/8552 | 17/18723 | 3.48e-04 | 2.03e-03 | 15 |
| GO:19016632 | Esophagus | ESCC | quinone biosynthetic process | 15/8552 | 17/18723 | 3.48e-04 | 2.03e-03 | 15 |
| GO:00421805 | Esophagus | ESCC | cellular ketone metabolic process | 120/8552 | 211/18723 | 6.70e-04 | 3.55e-03 | 120 |
| GO:00082991 | Esophagus | ESCC | isoprenoid biosynthetic process | 21/8552 | 28/18723 | 1.57e-03 | 7.33e-03 | 21 |
| GO:00508788 | Lung | AIS | regulation of body fluid levels | 57/1849 | 379/18723 | 8.60e-04 | 1.17e-02 | 57 |
| GO:19016613 | Oral cavity | OSCC | quinone metabolic process | 32/7305 | 40/18723 | 1.40e-07 | 2.34e-06 | 32 |
| GO:00421804 | Oral cavity | OSCC | cellular ketone metabolic process | 111/7305 | 211/18723 | 3.94e-05 | 3.45e-04 | 111 |
| GO:0006743 | Oral cavity | OSCC | ubiquinone metabolic process | 16/7305 | 19/18723 | 7.05e-05 | 5.60e-04 | 16 |
| GO:0006744 | Oral cavity | OSCC | ubiquinone biosynthetic process | 14/7305 | 17/18723 | 3.31e-04 | 2.04e-03 | 14 |
| GO:1901663 | Oral cavity | OSCC | quinone biosynthetic process | 14/7305 | 17/18723 | 3.31e-04 | 2.04e-03 | 14 |
| GO:0008299 | Oral cavity | OSCC | isoprenoid biosynthetic process | 20/7305 | 28/18723 | 5.13e-04 | 2.99e-03 | 20 |
| Page: 1 2 |
| Pathway ID | Tissue | Disease Stage | Description | Gene Ratio | Bg Ratio | pvalue | p.adjust | qvalue | Count |
| hsa009005 | Esophagus | ESCC | Terpenoid backbone biosynthesis | 20/4205 | 23/8465 | 2.14e-04 | 7.87e-04 | 4.03e-04 | 20 |
| hsa0090012 | Esophagus | ESCC | Terpenoid backbone biosynthesis | 20/4205 | 23/8465 | 2.14e-04 | 7.87e-04 | 4.03e-04 | 20 |
| Page: 1 |
Top |
Cell-cell communication analysis |
| Identification of potential cell-cell interactions between two cell types and their ligand-receptor pairs for different disease states |
| Ligand | Receptor | LRpair | Pathway | Tissue | Disease Stage |
| Page: 1 |
Top |
Single-cell gene regulatory network inference analysis |
| Find out the significant the regulons (TFs) and the target genes of each regulon across cell types for different disease states |
| TF | Cell Type | Tissue | Disease Stage | Target Gene | RSS | Regulon Activity |
| ∗The dot plots of a searched regulon are shown for all cell subpopulations in each disease state of each tissue based on the regulon specific score inferred using pySCENIC and by calculating the average expression. |
| Page: 1 |
Top |
Somatic mutation of malignant transformation related genes |
| Annotation of somatic variants for genes involved in malignant transformation |
| Hugo Symbol | Variant Class | Variant Classification | dbSNP RS | HGVSc | HGVSp | HGVSp Short | SWISSPROT | BIOTYPE | SIFT | PolyPhen | Tumor Sample Barcode | Tissue | Histology | Sex | Age | Stage | Therapy Types | Drugs | Outcome |
| PDSS2 | SNV | Missense_Mutation | c.446N>T | p.Ala149Val | p.A149V | Q86YH6 | protein_coding | deleterious(0.01) | probably_damaging(1) | TCGA-AN-A0AK-01 | Breast | breast invasive carcinoma | Female | >=65 | I/II | Unknown | Unknown | SD | |
| PDSS2 | SNV | Missense_Mutation | novel | c.685N>A | p.Glu229Lys | p.E229K | Q86YH6 | protein_coding | tolerated(0.11) | possibly_damaging(0.776) | TCGA-E2-A155-01 | Breast | breast invasive carcinoma | Female | <65 | I/II | Chemotherapy | cytoxan | SD |
| PDSS2 | SNV | Missense_Mutation | novel | c.1084N>G | p.Ile362Val | p.I362V | Q86YH6 | protein_coding | tolerated(1) | benign(0.001) | TCGA-OL-A5RU-01 | Breast | breast invasive carcinoma | Female | <65 | I/II | Chemotherapy | cyclophosphamide | CR |
| PDSS2 | SNV | Missense_Mutation | novel | c.523N>A | p.Asp175Asn | p.D175N | Q86YH6 | protein_coding | deleterious(0.03) | possibly_damaging(0.607) | TCGA-C5-A1MH-01 | Cervix | cervical & endocervical cancer | Female | >=65 | III/IV | Chemotherapy | cisplatin | PD |
| PDSS2 | SNV | Missense_Mutation | novel | c.163G>A | p.Glu55Lys | p.E55K | Q86YH6 | protein_coding | deleterious(0) | benign(0.395) | TCGA-C5-A7X5-01 | Cervix | cervical & endocervical cancer | Female | >=65 | I/II | Chemotherapy | carboplatin | PD |
| PDSS2 | SNV | Missense_Mutation | c.863N>T | p.Ala288Val | p.A288V | Q86YH6 | protein_coding | deleterious(0) | possibly_damaging(0.673) | TCGA-A6-6780-01 | Colorectum | colon adenocarcinoma | Male | >=65 | I/II | Unknown | Unknown | SD | |
| PDSS2 | SNV | Missense_Mutation | rs782590458 | c.1097N>A | p.Arg366His | p.R366H | Q86YH6 | protein_coding | tolerated(0.14) | possibly_damaging(0.548) | TCGA-AA-3811-01 | Colorectum | colon adenocarcinoma | Female | >=65 | III/IV | Unknown | Unknown | PD |
| PDSS2 | SNV | Missense_Mutation | c.454N>G | p.Thr152Ala | p.T152A | Q86YH6 | protein_coding | deleterious(0.04) | probably_damaging(0.961) | TCGA-AD-5900-01 | Colorectum | colon adenocarcinoma | Male | >=65 | I/II | Unknown | Unknown | SD | |
| PDSS2 | SNV | Missense_Mutation | c.98N>A | p.Ser33Tyr | p.S33Y | Q86YH6 | protein_coding | tolerated(0.38) | benign(0) | TCGA-G4-6294-01 | Colorectum | colon adenocarcinoma | Male | >=65 | III/IV | Chemotherapy | fluorouracil | PD | |
| PDSS2 | SNV | Missense_Mutation | novel | c.38A>C | p.Tyr13Ser | p.Y13S | Q86YH6 | protein_coding | tolerated_low_confidence(0.2) | benign(0) | TCGA-F5-6814-01 | Colorectum | rectum adenocarcinoma | Male | <65 | I/II | Unknown | Unknown | SD |
| Page: 1 2 3 4 |
Top |
Related drugs of malignant transformation related genes |
| Identification of chemicals and drugs interact with genes involved in malignant transfromation |
| (DGIdb 4.0) |
| Entrez ID | Symbol | Category | Interaction Types | Drug Claim Name | Drug Name | PMIDs |
| Page: 1 |

Copyright 2023-Present -The University of Texas Health Science Center at Houston |