
|
|||||
|
 | |
| |
| |
| |
| |
| |
|
Gene: PDSS1 |
Gene summary for PDSS1 |
| Gene information | Species | Human | Gene symbol | PDSS1 | Gene ID | 23590 |
| Gene name | decaprenyl diphosphate synthase subunit 1 | |
| Gene Alias | COQ1 | |
| Cytomap | 10p12.1 | |
| Gene Type | protein-coding | GO ID | GO:0006629 | UniProtAcc | Q5T2R2 |
Top |
Malignant transformation analysis |
| Identification of the aberrant gene expression in precancerous and cancerous lesions by comparing the gene expression of stem-like cells in diseased tissues with normal stem cells |
| Entrez ID | Symbol | Replicates | Species | Organ | Tissue | Adj P-value | Log2FC | Malignancy |
| 23590 | PDSS1 | LZE24T | Human | Esophagus | ESCC | 3.44e-04 | 1.57e-01 | 0.0596 |
| 23590 | PDSS1 | P2T-E | Human | Esophagus | ESCC | 1.51e-05 | 1.43e-01 | 0.1177 |
| 23590 | PDSS1 | P4T-E | Human | Esophagus | ESCC | 6.93e-14 | 2.39e-01 | 0.1323 |
| 23590 | PDSS1 | P5T-E | Human | Esophagus | ESCC | 6.85e-10 | 2.31e-01 | 0.1327 |
| 23590 | PDSS1 | P8T-E | Human | Esophagus | ESCC | 8.69e-09 | 9.40e-02 | 0.0889 |
| 23590 | PDSS1 | P9T-E | Human | Esophagus | ESCC | 1.05e-05 | 7.30e-02 | 0.1131 |
| 23590 | PDSS1 | P10T-E | Human | Esophagus | ESCC | 1.69e-14 | 8.42e-02 | 0.116 |
| 23590 | PDSS1 | P11T-E | Human | Esophagus | ESCC | 1.33e-06 | 2.30e-01 | 0.1426 |
| 23590 | PDSS1 | P12T-E | Human | Esophagus | ESCC | 6.28e-09 | 1.63e-01 | 0.1122 |
| 23590 | PDSS1 | P15T-E | Human | Esophagus | ESCC | 5.34e-04 | 7.21e-02 | 0.1149 |
| 23590 | PDSS1 | P16T-E | Human | Esophagus | ESCC | 1.32e-10 | 1.50e-01 | 0.1153 |
| 23590 | PDSS1 | P20T-E | Human | Esophagus | ESCC | 3.55e-02 | 1.19e-01 | 0.1124 |
| 23590 | PDSS1 | P21T-E | Human | Esophagus | ESCC | 1.68e-20 | 4.45e-01 | 0.1617 |
| 23590 | PDSS1 | P22T-E | Human | Esophagus | ESCC | 3.03e-03 | 5.53e-02 | 0.1236 |
| 23590 | PDSS1 | P23T-E | Human | Esophagus | ESCC | 1.27e-10 | 1.20e-01 | 0.108 |
| 23590 | PDSS1 | P24T-E | Human | Esophagus | ESCC | 1.12e-12 | 1.80e-01 | 0.1287 |
| 23590 | PDSS1 | P26T-E | Human | Esophagus | ESCC | 9.78e-12 | 1.45e-01 | 0.1276 |
| 23590 | PDSS1 | P27T-E | Human | Esophagus | ESCC | 6.41e-20 | 1.35e-01 | 0.1055 |
| 23590 | PDSS1 | P28T-E | Human | Esophagus | ESCC | 1.81e-10 | 1.95e-01 | 0.1149 |
| 23590 | PDSS1 | P30T-E | Human | Esophagus | ESCC | 5.73e-10 | 2.34e-01 | 0.137 |
| Page: 1 2 3 |
| Tissue | Expression Dynamics | Abbreviation |
| Esophagus |  | ESCC: Esophageal squamous cell carcinoma |
| HGIN: High-grade intraepithelial neoplasias | ||
| LGIN: Low-grade intraepithelial neoplasias | ||
| Oral Cavity | 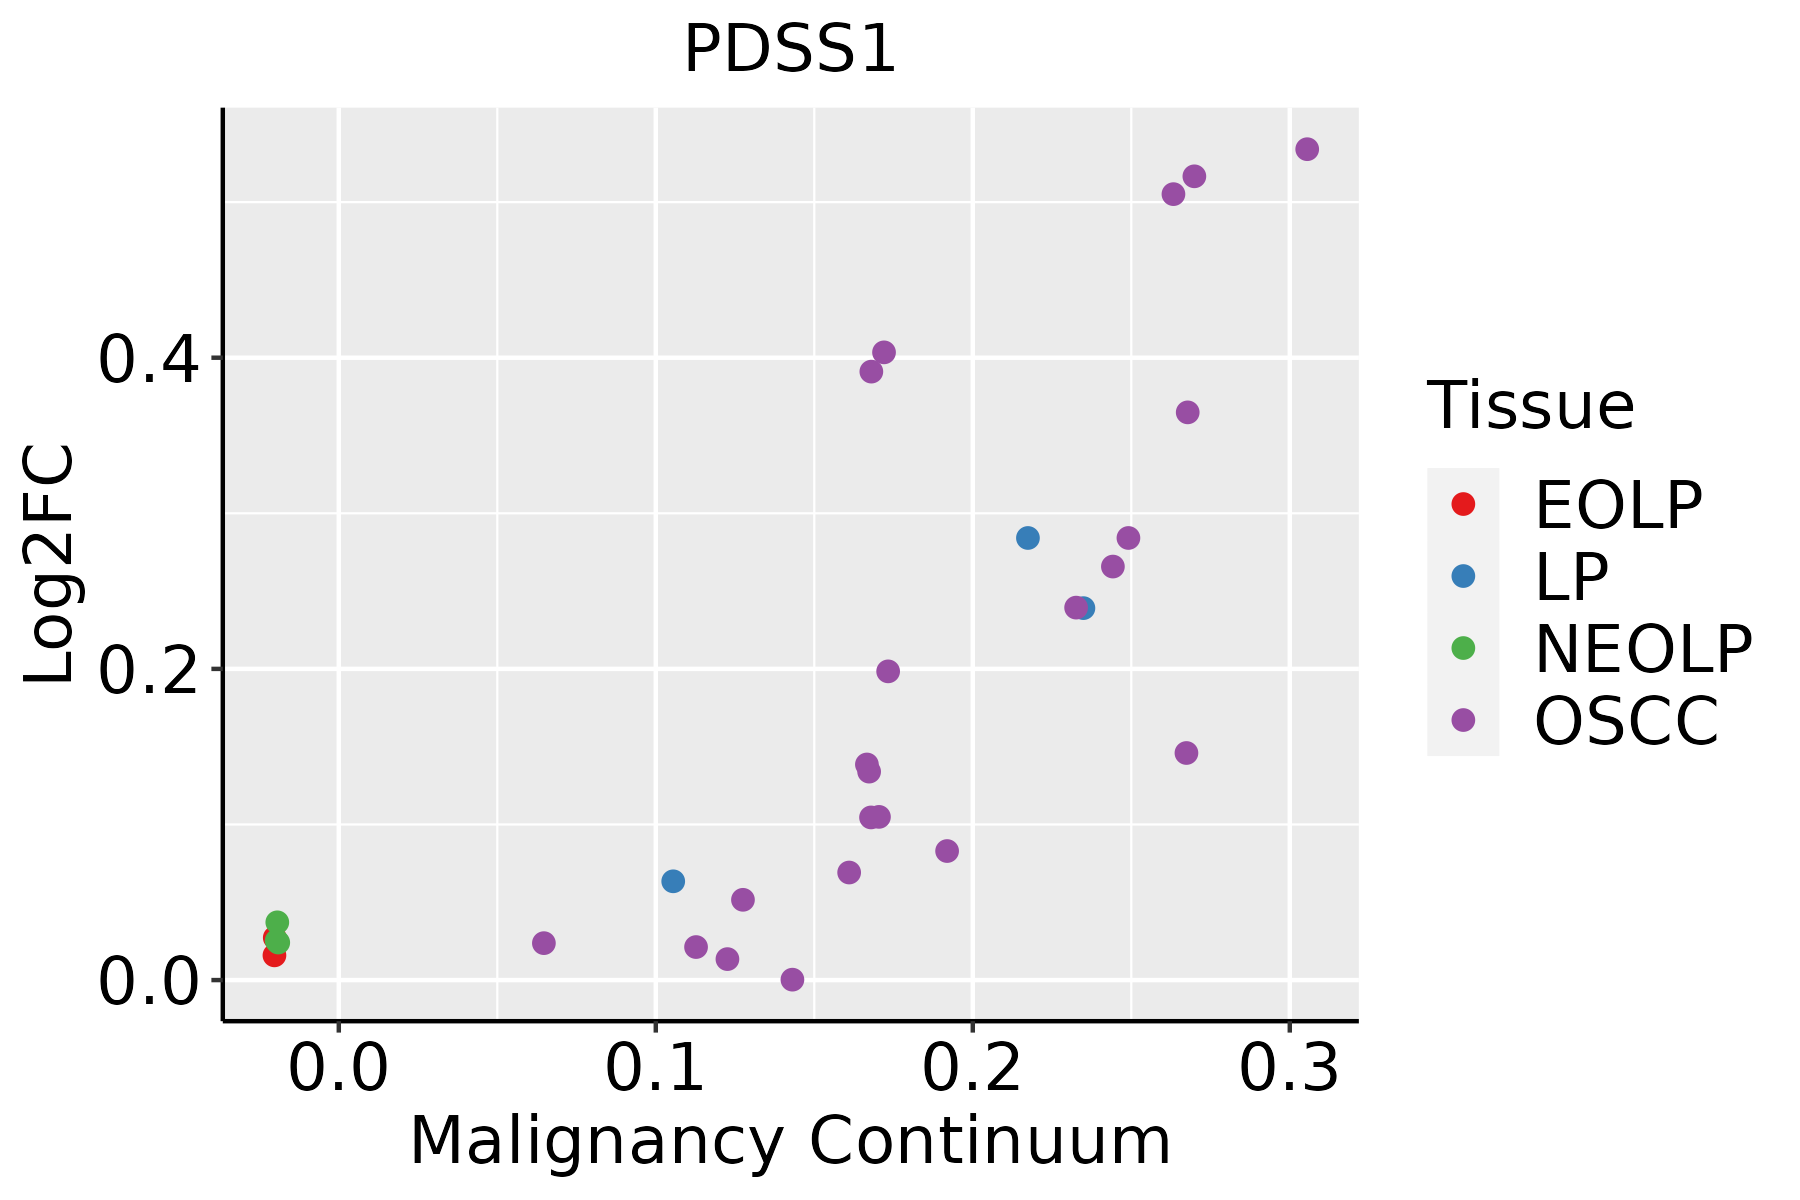 | EOLP: Erosive Oral lichen planus |
| LP: leukoplakia | ||
| NEOLP: Non-erosive oral lichen planus | ||
| OSCC: Oral squamous cell carcinoma |
| ∗log2FC in expression of this searched gene in stem-like cells from each diseased tissue sample relative to stem-like cells in normal samples in each tissue plotted against the malignancy continuum. Samples are colored based on if they are from different disease stage. |
Top |
Malignant transformation related pathway analysis |
| Find out the enriched GO biological processes and KEGG pathways involved in transition from healthy to precancer to cancer |
| Tissue | Disease Stage | Enriched GO biological Processes |
| Colorectum | AD |  |
| Colorectum | SER |  |
| Colorectum | MSS |  |
| Colorectum | MSI-H |  |
| Colorectum | FAP |  |
| ∗Top 15 enriched GO BP terms are showed in the bar plot of each disease state in each tissue. Each row represents a significant GO biological process which is colored according to the -log10(p.adjust). |
| Page: 1 2 3 4 5 6 7 8 9 |
| GO ID | Tissue | Disease Stage | Description | Gene Ratio | Bg Ratio | pvalue | p.adjust | Count |
| GO:190166112 | Esophagus | ESCC | quinone metabolic process | 34/8552 | 40/18723 | 3.00e-07 | 4.27e-06 | 34 |
| GO:00067432 | Esophagus | ESCC | ubiquinone metabolic process | 17/8552 | 19/18723 | 9.02e-05 | 6.50e-04 | 17 |
| GO:00067442 | Esophagus | ESCC | ubiquinone biosynthetic process | 15/8552 | 17/18723 | 3.48e-04 | 2.03e-03 | 15 |
| GO:19016632 | Esophagus | ESCC | quinone biosynthetic process | 15/8552 | 17/18723 | 3.48e-04 | 2.03e-03 | 15 |
| GO:00421805 | Esophagus | ESCC | cellular ketone metabolic process | 120/8552 | 211/18723 | 6.70e-04 | 3.55e-03 | 120 |
| GO:00082991 | Esophagus | ESCC | isoprenoid biosynthetic process | 21/8552 | 28/18723 | 1.57e-03 | 7.33e-03 | 21 |
| GO:19016613 | Oral cavity | OSCC | quinone metabolic process | 32/7305 | 40/18723 | 1.40e-07 | 2.34e-06 | 32 |
| GO:00421804 | Oral cavity | OSCC | cellular ketone metabolic process | 111/7305 | 211/18723 | 3.94e-05 | 3.45e-04 | 111 |
| GO:0006743 | Oral cavity | OSCC | ubiquinone metabolic process | 16/7305 | 19/18723 | 7.05e-05 | 5.60e-04 | 16 |
| GO:0006744 | Oral cavity | OSCC | ubiquinone biosynthetic process | 14/7305 | 17/18723 | 3.31e-04 | 2.04e-03 | 14 |
| GO:1901663 | Oral cavity | OSCC | quinone biosynthetic process | 14/7305 | 17/18723 | 3.31e-04 | 2.04e-03 | 14 |
| GO:0008299 | Oral cavity | OSCC | isoprenoid biosynthetic process | 20/7305 | 28/18723 | 5.13e-04 | 2.99e-03 | 20 |
| GO:0042181 | Oral cavity | OSCC | ketone biosynthetic process | 26/7305 | 43/18723 | 3.55e-03 | 1.49e-02 | 26 |
| GO:00067203 | Oral cavity | OSCC | isoprenoid metabolic process | 59/7305 | 116/18723 | 6.18e-03 | 2.33e-02 | 59 |
| Page: 1 |
| Pathway ID | Tissue | Disease Stage | Description | Gene Ratio | Bg Ratio | pvalue | p.adjust | qvalue | Count |
| hsa009004 | Oral cavity | OSCC | Terpenoid backbone biosynthesis | 19/3704 | 23/8465 | 1.55e-04 | 5.34e-04 | 2.72e-04 | 19 |
| hsa0090011 | Oral cavity | OSCC | Terpenoid backbone biosynthesis | 19/3704 | 23/8465 | 1.55e-04 | 5.34e-04 | 2.72e-04 | 19 |
| Page: 1 |
Top |
Cell-cell communication analysis |
| Identification of potential cell-cell interactions between two cell types and their ligand-receptor pairs for different disease states |
| Ligand | Receptor | LRpair | Pathway | Tissue | Disease Stage |
| Page: 1 |
Top |
Single-cell gene regulatory network inference analysis |
| Find out the significant the regulons (TFs) and the target genes of each regulon across cell types for different disease states |
| TF | Cell Type | Tissue | Disease Stage | Target Gene | RSS | Regulon Activity |
| ∗The dot plots of a searched regulon are shown for all cell subpopulations in each disease state of each tissue based on the regulon specific score inferred using pySCENIC and by calculating the average expression. |
| Page: 1 |
Top |
Somatic mutation of malignant transformation related genes |
| Annotation of somatic variants for genes involved in malignant transformation |
| Hugo Symbol | Variant Class | Variant Classification | dbSNP RS | HGVSc | HGVSp | HGVSp Short | SWISSPROT | BIOTYPE | SIFT | PolyPhen | Tumor Sample Barcode | Tissue | Histology | Sex | Age | Stage | Therapy Types | Drugs | Outcome |
| PDSS1 | SNV | Missense_Mutation | c.309G>C | p.Leu103Phe | p.L103F | Q5T2R2 | protein_coding | deleterious(0.02) | probably_damaging(0.973) | TCGA-BH-A18P-01 | Breast | breast invasive carcinoma | Female | <65 | I/II | Unknown | Unknown | PD | |
| PDSS1 | SNV | Missense_Mutation | c.874N>A | p.Ala292Thr | p.A292T | Q5T2R2 | protein_coding | deleterious(0.04) | possibly_damaging(0.595) | TCGA-BH-A1FN-01 | Breast | breast invasive carcinoma | Female | <65 | I/II | Unknown | Unknown | PD | |
| PDSS1 | insertion | In_Frame_Ins | novel | c.1100_1101insCATGCACCGCTGCTCAGATCCACTCTACAC | p.Val367_Leu368insMetHisArgCysSerAspProLeuTyrThr | p.V367_L368insMHRCSDPLYT | Q5T2R2 | protein_coding | TCGA-A2-A0D1-01 | Breast | breast invasive carcinoma | Female | >=65 | I/II | Chemotherapy | taxotere | SD | ||
| PDSS1 | SNV | Missense_Mutation | novel | c.637T>C | p.Ser213Pro | p.S213P | Q5T2R2 | protein_coding | deleterious(0.01) | possibly_damaging(0.906) | TCGA-2W-A8YY-01 | Cervix | cervical & endocervical cancer | Female | <65 | I/II | Chemotherapy | cisplatin | CR |
| PDSS1 | SNV | Missense_Mutation | rs766225494 | c.634N>A | p.Leu212Ile | p.L212I | Q5T2R2 | protein_coding | deleterious(0.02) | possibly_damaging(0.856) | TCGA-FU-A3HZ-01 | Cervix | cervical & endocervical cancer | Female | <65 | I/II | Chemotherapy | cisplatin | CR |
| PDSS1 | SNV | Missense_Mutation | c.601N>A | p.Glu201Lys | p.E201K | Q5T2R2 | protein_coding | deleterious(0.02) | possibly_damaging(0.593) | TCGA-JX-A3Q0-01 | Cervix | cervical & endocervical cancer | Female | <65 | III/IV | Unknown | Unknown | SD | |
| PDSS1 | SNV | Missense_Mutation | novel | c.606N>C | p.Lys202Asn | p.K202N | Q5T2R2 | protein_coding | deleterious(0) | possibly_damaging(0.9) | TCGA-VS-A958-01 | Cervix | cervical & endocervical cancer | Female | <65 | I/II | Chemotherapy | cisplatin | CR |
| PDSS1 | SNV | Missense_Mutation | novel | c.1111G>A | p.Asp371Asn | p.D371N | Q5T2R2 | protein_coding | tolerated(0.19) | benign(0.219) | TCGA-VS-A9UB-01 | Cervix | cervical & endocervical cancer | Female | <65 | I/II | Chemotherapy | cisplatin | CR |
| PDSS1 | SNV | Missense_Mutation | rs748477018 | c.1138G>A | p.Ala380Thr | p.A380T | Q5T2R2 | protein_coding | deleterious(0) | probably_damaging(0.999) | TCGA-AA-3672-01 | Colorectum | colon adenocarcinoma | Female | >=65 | III/IV | Unknown | Unknown | SD |
| PDSS1 | SNV | Missense_Mutation | c.920N>G | p.Asp307Gly | p.D307G | Q5T2R2 | protein_coding | deleterious(0) | probably_damaging(1) | TCGA-AA-3715-01 | Colorectum | colon adenocarcinoma | Male | >=65 | I/II | Unknown | Unknown | PD |
| Page: 1 2 3 4 5 |
Top |
Related drugs of malignant transformation related genes |
| Identification of chemicals and drugs interact with genes involved in malignant transfromation |
| (DGIdb 4.0) |
| Entrez ID | Symbol | Category | Interaction Types | Drug Claim Name | Drug Name | PMIDs |
| Page: 1 |

Copyright 2023-Present -The University of Texas Health Science Center at Houston |