
|
|||||
|
 | |
| |
| |
| |
| |
| |
|
Gene: PDS5B |
Gene summary for PDS5B |
| Gene information | Species | Human | Gene symbol | PDS5B | Gene ID | 23047 |
| Gene name | PDS5 cohesin associated factor B | |
| Gene Alias | APRIN | |
| Cytomap | 13q13.1 | |
| Gene Type | protein-coding | GO ID | GO:0000070 | UniProtAcc | Q9NTI5 |
Top |
Malignant transformation analysis |
| Identification of the aberrant gene expression in precancerous and cancerous lesions by comparing the gene expression of stem-like cells in diseased tissues with normal stem cells |
| Entrez ID | Symbol | Replicates | Species | Organ | Tissue | Adj P-value | Log2FC | Malignancy |
| 23047 | PDS5B | CCI_1 | Human | Cervix | CC | 1.23e-03 | 6.84e-01 | 0.528 |
| 23047 | PDS5B | CCI_2 | Human | Cervix | CC | 4.64e-09 | 9.19e-01 | 0.5249 |
| 23047 | PDS5B | CCI_3 | Human | Cervix | CC | 5.95e-16 | 8.94e-01 | 0.516 |
| 23047 | PDS5B | HTA11_3410_2000001011 | Human | Colorectum | AD | 1.46e-18 | -5.59e-01 | 0.0155 |
| 23047 | PDS5B | HTA11_866_3004761011 | Human | Colorectum | AD | 4.43e-11 | -4.94e-01 | 0.096 |
| 23047 | PDS5B | HTA11_9408_2000001011 | Human | Colorectum | AD | 8.62e-04 | -6.77e-01 | 0.0451 |
| 23047 | PDS5B | HTA11_8622_2000001021 | Human | Colorectum | SER | 1.06e-03 | -5.82e-01 | 0.0528 |
| 23047 | PDS5B | HTA11_10711_2000001011 | Human | Colorectum | AD | 1.51e-04 | -4.47e-01 | 0.0338 |
| 23047 | PDS5B | HTA11_7696_3000711011 | Human | Colorectum | AD | 5.16e-04 | -3.58e-01 | 0.0674 |
| 23047 | PDS5B | HTA11_99999974143_84620 | Human | Colorectum | MSS | 2.59e-04 | -3.69e-01 | 0.3005 |
| 23047 | PDS5B | F007 | Human | Colorectum | FAP | 1.45e-03 | -8.02e-02 | 0.1176 |
| 23047 | PDS5B | A001-C-207 | Human | Colorectum | FAP | 7.21e-06 | -1.07e-01 | 0.1278 |
| 23047 | PDS5B | A015-C-203 | Human | Colorectum | FAP | 9.61e-25 | -2.94e-01 | -0.1294 |
| 23047 | PDS5B | A015-C-204 | Human | Colorectum | FAP | 1.64e-07 | -2.29e-01 | -0.0228 |
| 23047 | PDS5B | A014-C-040 | Human | Colorectum | FAP | 6.95e-06 | -1.72e-01 | -0.1184 |
| 23047 | PDS5B | A002-C-201 | Human | Colorectum | FAP | 3.74e-14 | -2.59e-01 | 0.0324 |
| 23047 | PDS5B | A002-C-203 | Human | Colorectum | FAP | 2.38e-05 | -9.49e-02 | 0.2786 |
| 23047 | PDS5B | A001-C-119 | Human | Colorectum | FAP | 1.96e-07 | -3.28e-01 | -0.1557 |
| 23047 | PDS5B | A001-C-108 | Human | Colorectum | FAP | 9.40e-16 | -2.40e-01 | -0.0272 |
| 23047 | PDS5B | A002-C-205 | Human | Colorectum | FAP | 1.21e-25 | -4.11e-01 | -0.1236 |
| Page: 1 2 3 4 5 6 7 |
| Tissue | Expression Dynamics | Abbreviation |
| Cervix | 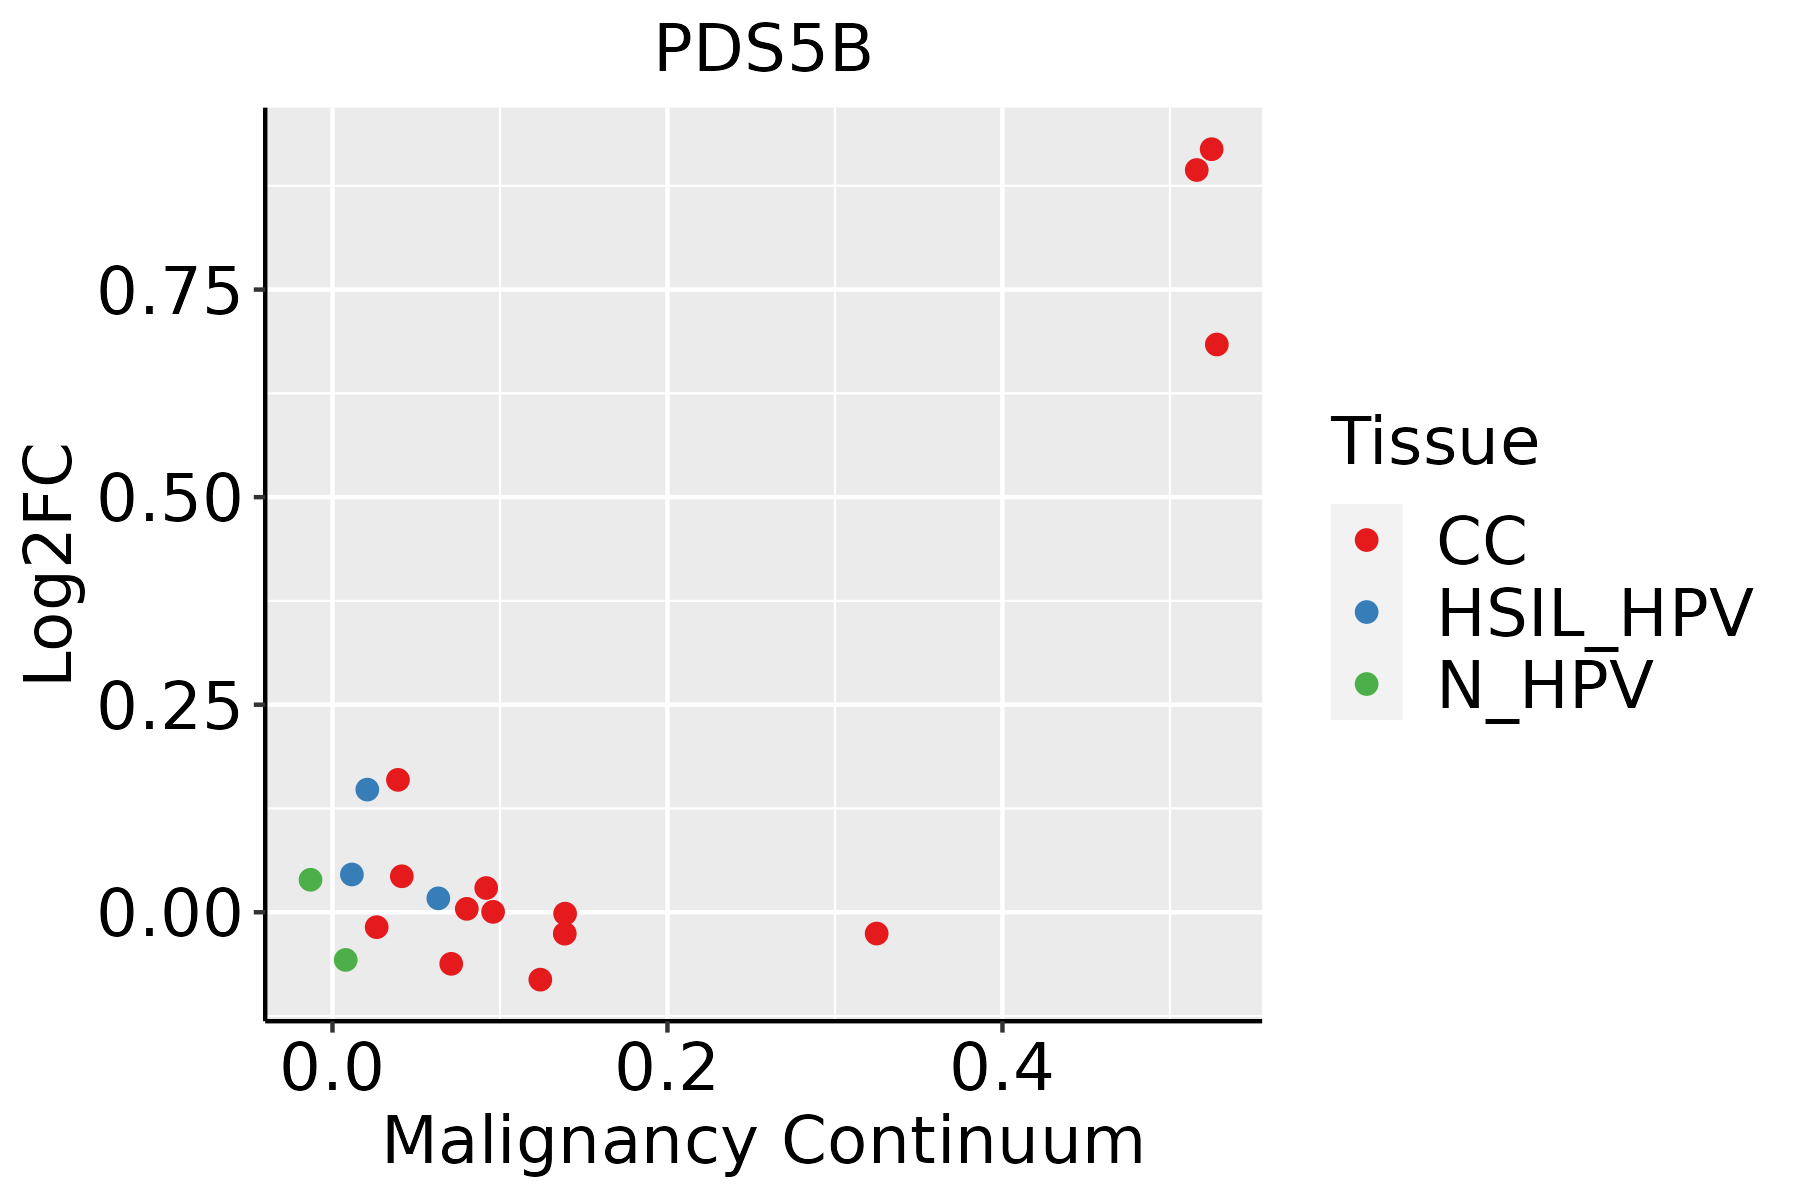 | CC: Cervix cancer |
| HSIL_HPV: HPV-infected high-grade squamous intraepithelial lesions | ||
| N_HPV: HPV-infected normal cervix | ||
| Colorectum (GSE201348) |  | FAP: Familial adenomatous polyposis |
| CRC: Colorectal cancer | ||
| Colorectum (HTA11) |  | AD: Adenomas |
| SER: Sessile serrated lesions | ||
| MSI-H: Microsatellite-high colorectal cancer | ||
| MSS: Microsatellite stable colorectal cancer | ||
| Esophagus | 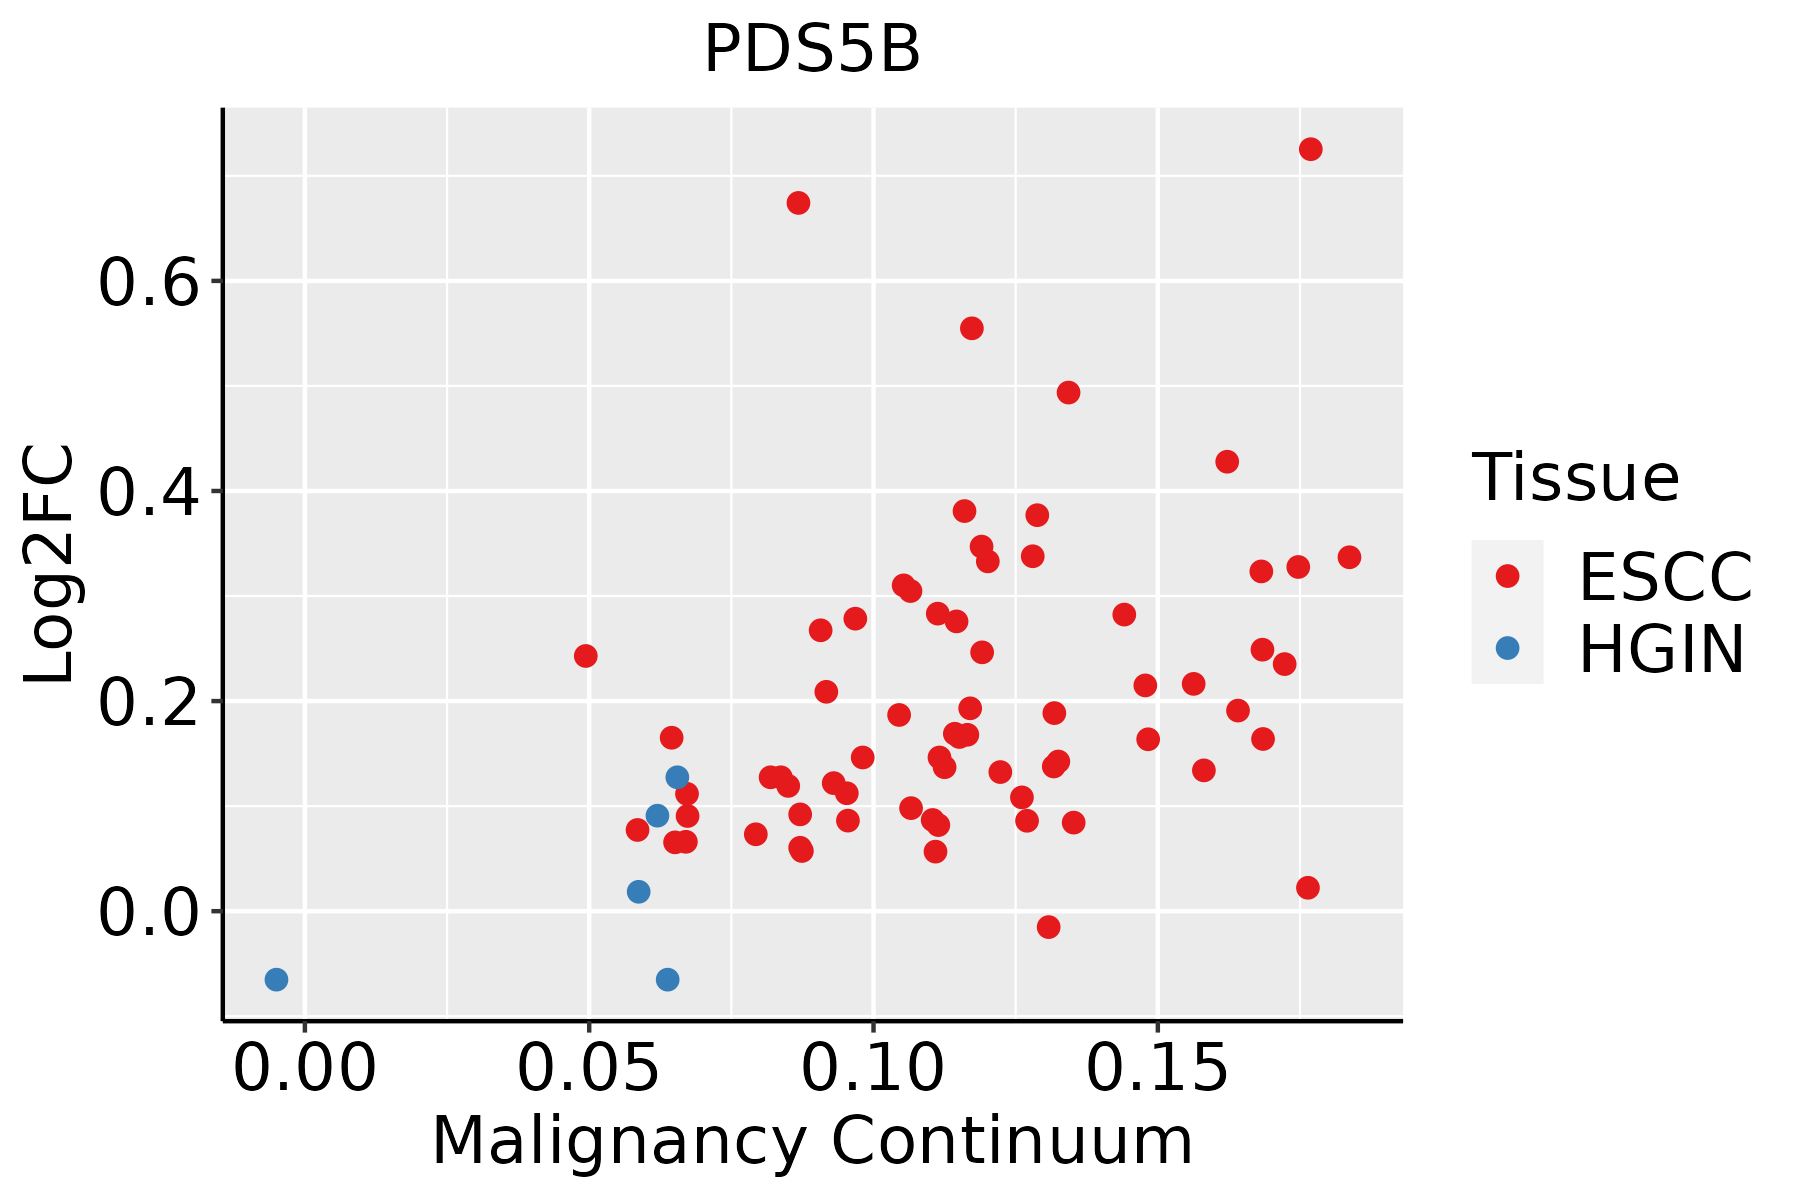 | ESCC: Esophageal squamous cell carcinoma |
| HGIN: High-grade intraepithelial neoplasias | ||
| LGIN: Low-grade intraepithelial neoplasias | ||
| Liver |  | HCC: Hepatocellular carcinoma |
| NAFLD: Non-alcoholic fatty liver disease | ||
| Thyroid | 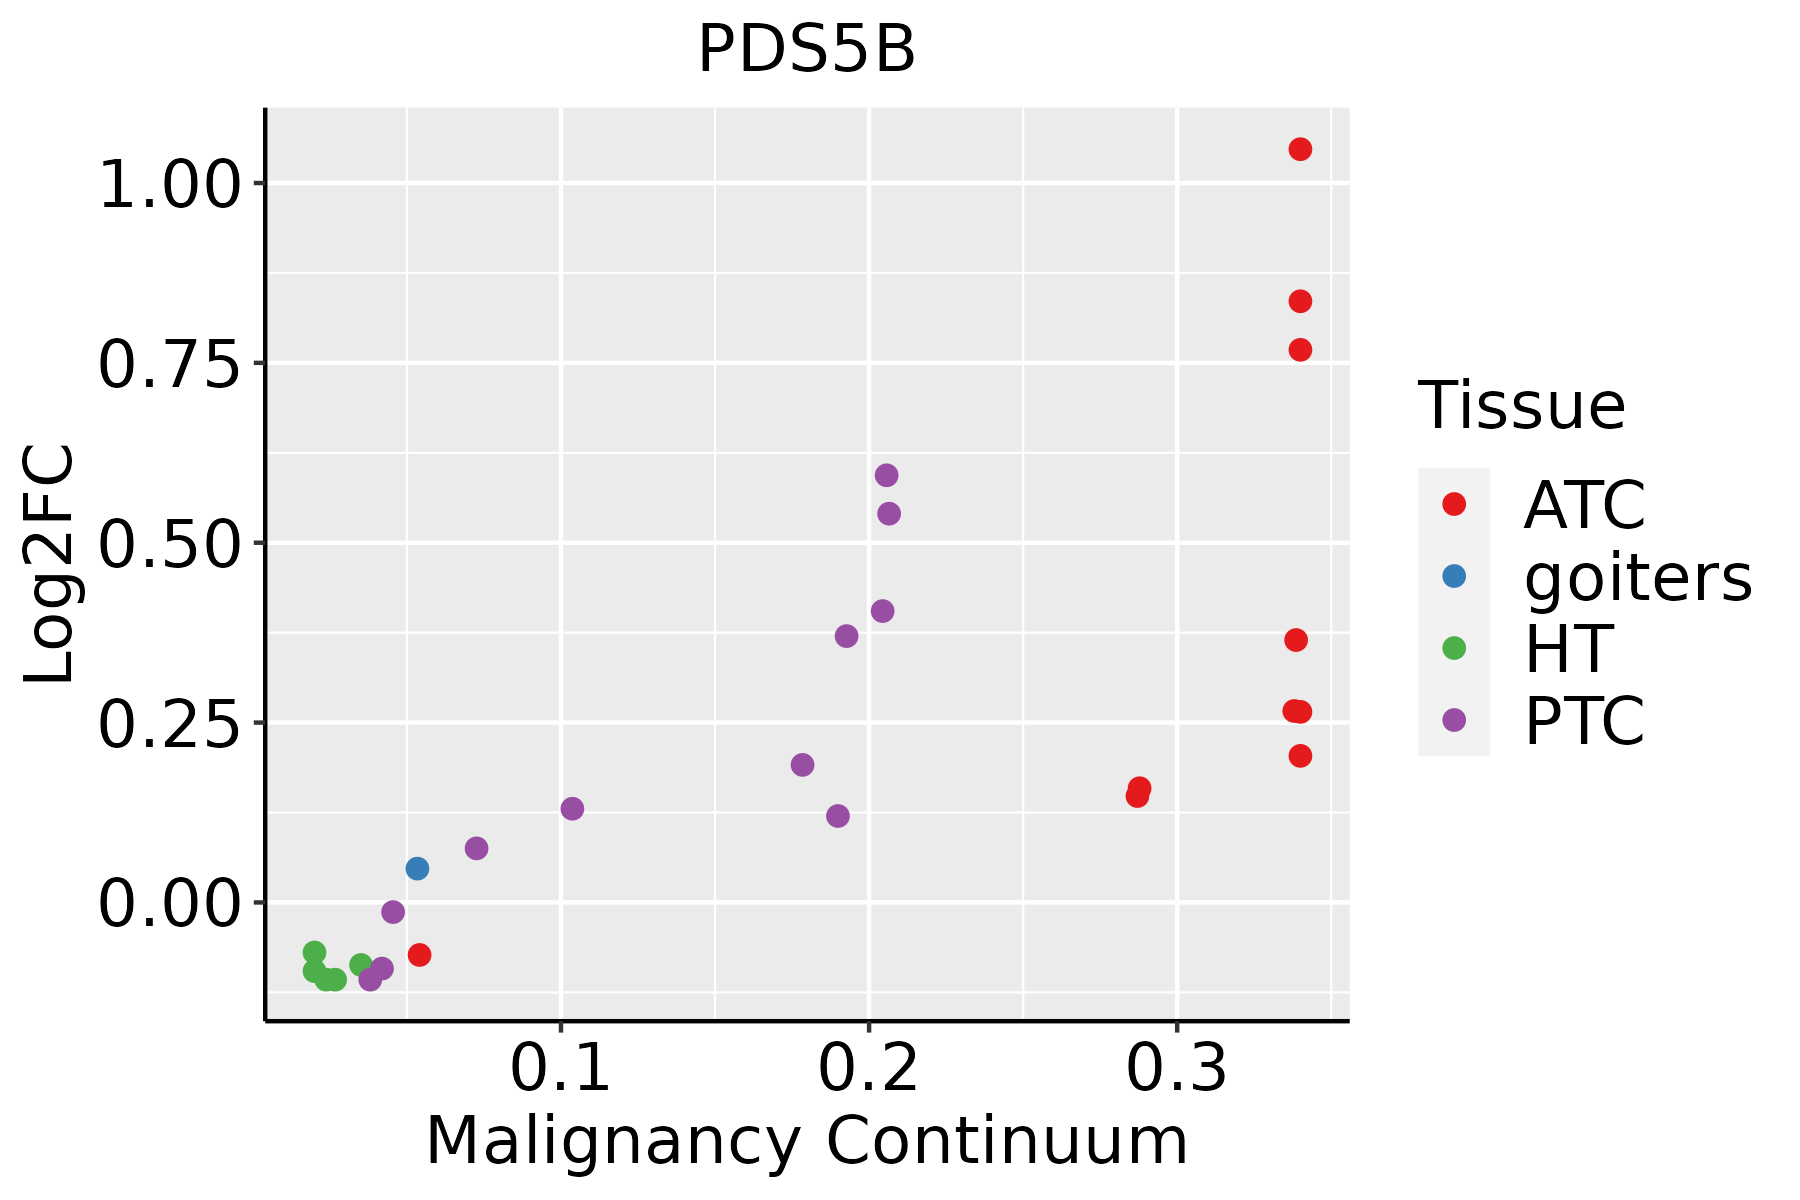 | ATC: Anaplastic thyroid cancer |
| HT: Hashimoto's thyroiditis | ||
| PTC: Papillary thyroid cancer |
| ∗log2FC in expression of this searched gene in stem-like cells from each diseased tissue sample relative to stem-like cells in normal samples in each tissue plotted against the malignancy continuum. Samples are colored based on if they are from different disease stage. |
Top |
Malignant transformation related pathway analysis |
| Find out the enriched GO biological processes and KEGG pathways involved in transition from healthy to precancer to cancer |
| Tissue | Disease Stage | Enriched GO biological Processes |
| Colorectum | AD |  |
| Colorectum | SER |  |
| Colorectum | MSS |  |
| Colorectum | MSI-H |  |
| Colorectum | FAP |  |
| ∗Top 15 enriched GO BP terms are showed in the bar plot of each disease state in each tissue. Each row represents a significant GO biological process which is colored according to the -log10(p.adjust). |
| Page: 1 2 3 4 5 6 7 8 9 |
| GO ID | Tissue | Disease Stage | Description | Gene Ratio | Bg Ratio | pvalue | p.adjust | Count |
| GO:00070646 | Cervix | CC | mitotic sister chromatid cohesion | 12/2311 | 28/18723 | 5.47e-05 | 8.06e-04 | 12 |
| GO:01400143 | Cervix | CC | mitotic nuclear division | 50/2311 | 287/18723 | 7.27e-03 | 3.91e-02 | 50 |
| GO:00070625 | Cervix | CC | sister chromatid cohesion | 15/2311 | 62/18723 | 7.30e-03 | 3.92e-02 | 15 |
| GO:00482851 | Cervix | CC | organelle fission | 78/2311 | 488/18723 | 9.70e-03 | 4.79e-02 | 78 |
| GO:0007064 | Colorectum | AD | mitotic sister chromatid cohesion | 13/3918 | 28/18723 | 2.22e-03 | 1.75e-02 | 13 |
| GO:0007062 | Colorectum | AD | sister chromatid cohesion | 23/3918 | 62/18723 | 2.51e-03 | 1.92e-02 | 23 |
| GO:0140014 | Colorectum | AD | mitotic nuclear division | 78/3918 | 287/18723 | 6.48e-03 | 4.05e-02 | 78 |
| GO:00070621 | Colorectum | MSS | sister chromatid cohesion | 20/3467 | 62/18723 | 6.63e-03 | 4.38e-02 | 20 |
| GO:01400141 | Colorectum | MSS | mitotic nuclear division | 70/3467 | 287/18723 | 7.48e-03 | 4.72e-02 | 70 |
| GO:00070641 | Colorectum | MSS | mitotic sister chromatid cohesion | 11/3467 | 28/18723 | 8.30e-03 | 5.00e-02 | 11 |
| GO:00070642 | Colorectum | FAP | mitotic sister chromatid cohesion | 11/2622 | 28/18723 | 8.55e-04 | 8.79e-03 | 11 |
| GO:00070622 | Colorectum | FAP | sister chromatid cohesion | 18/2622 | 62/18723 | 1.60e-03 | 1.42e-02 | 18 |
| GO:00070623 | Colorectum | CRC | sister chromatid cohesion | 16/2078 | 62/18723 | 9.40e-04 | 1.15e-02 | 16 |
| GO:00070643 | Colorectum | CRC | mitotic sister chromatid cohesion | 9/2078 | 28/18723 | 2.43e-03 | 2.30e-02 | 9 |
| GO:014001414 | Esophagus | ESCC | mitotic nuclear division | 218/8552 | 287/18723 | 6.17e-26 | 1.78e-23 | 218 |
| GO:000007011 | Esophagus | ESCC | mitotic sister chromatid segregation | 138/8552 | 168/18723 | 1.37e-22 | 2.63e-20 | 138 |
| GO:00008194 | Esophagus | ESCC | sister chromatid segregation | 157/8552 | 202/18723 | 8.41e-21 | 1.33e-18 | 157 |
| GO:000705911 | Esophagus | ESCC | chromosome segregation | 238/8552 | 346/18723 | 1.72e-18 | 1.82e-16 | 238 |
| GO:00482853 | Esophagus | ESCC | organelle fission | 301/8552 | 488/18723 | 4.64e-13 | 2.12e-11 | 301 |
| GO:00988133 | Esophagus | ESCC | nuclear chromosome segregation | 187/8552 | 281/18723 | 1.00e-12 | 4.36e-11 | 187 |
| Page: 1 2 3 |
| Pathway ID | Tissue | Disease Stage | Description | Gene Ratio | Bg Ratio | pvalue | p.adjust | qvalue | Count |
| hsa041106 | Cervix | CC | Cell cycle | 36/1267 | 157/8465 | 4.94e-03 | 1.67e-02 | 9.86e-03 | 36 |
| hsa0411013 | Cervix | CC | Cell cycle | 36/1267 | 157/8465 | 4.94e-03 | 1.67e-02 | 9.86e-03 | 36 |
| hsa04110 | Colorectum | FAP | Cell cycle | 37/1404 | 157/8465 | 1.44e-02 | 4.77e-02 | 2.90e-02 | 37 |
| hsa041101 | Colorectum | FAP | Cell cycle | 37/1404 | 157/8465 | 1.44e-02 | 4.77e-02 | 2.90e-02 | 37 |
| hsa0411023 | Esophagus | ESCC | Cell cycle | 126/4205 | 157/8465 | 1.34e-15 | 5.60e-14 | 2.87e-14 | 126 |
| hsa0411033 | Esophagus | ESCC | Cell cycle | 126/4205 | 157/8465 | 1.34e-15 | 5.60e-14 | 2.87e-14 | 126 |
| hsa041102 | Liver | HCC | Cell cycle | 106/4020 | 157/8465 | 2.54e-07 | 3.04e-06 | 1.69e-06 | 106 |
| hsa041103 | Liver | HCC | Cell cycle | 106/4020 | 157/8465 | 2.54e-07 | 3.04e-06 | 1.69e-06 | 106 |
| Page: 1 |
Top |
Cell-cell communication analysis |
| Identification of potential cell-cell interactions between two cell types and their ligand-receptor pairs for different disease states |
| Ligand | Receptor | LRpair | Pathway | Tissue | Disease Stage |
| Page: 1 |
Top |
Single-cell gene regulatory network inference analysis |
| Find out the significant the regulons (TFs) and the target genes of each regulon across cell types for different disease states |
| TF | Cell Type | Tissue | Disease Stage | Target Gene | RSS | Regulon Activity |
| ∗The dot plots of a searched regulon are shown for all cell subpopulations in each disease state of each tissue based on the regulon specific score inferred using pySCENIC and by calculating the average expression. |
| Page: 1 |
Top |
Somatic mutation of malignant transformation related genes |
| Annotation of somatic variants for genes involved in malignant transformation |
| Hugo Symbol | Variant Class | Variant Classification | dbSNP RS | HGVSc | HGVSp | HGVSp Short | SWISSPROT | BIOTYPE | SIFT | PolyPhen | Tumor Sample Barcode | Tissue | Histology | Sex | Age | Stage | Therapy Types | Drugs | Outcome |
| PDS5B | SNV | Missense_Mutation | rs764483823 | c.1010N>T | p.Ala337Val | p.A337V | Q9NTI5 | protein_coding | tolerated(0.08) | possibly_damaging(0.599) | TCGA-A2-A1G4-01 | Breast | breast invasive carcinoma | Female | >=65 | III/IV | Chemotherapy | adriamycin | SD |
| PDS5B | SNV | Missense_Mutation | c.1669G>A | p.Glu557Lys | p.E557K | Q9NTI5 | protein_coding | tolerated(0.31) | benign(0.059) | TCGA-A8-A076-01 | Breast | breast invasive carcinoma | Female | >=65 | I/II | Hormone Therapy | anastrozole | SD | |
| PDS5B | SNV | Missense_Mutation | c.605N>T | p.Asn202Ile | p.N202I | Q9NTI5 | protein_coding | deleterious(0) | probably_damaging(0.939) | TCGA-A8-A08X-01 | Breast | breast invasive carcinoma | Female | <65 | III/IV | Chemotherapy | doxorubicin | PD | |
| PDS5B | SNV | Missense_Mutation | novel | c.1336N>A | p.Gln446Lys | p.Q446K | Q9NTI5 | protein_coding | tolerated(0.17) | probably_damaging(0.996) | TCGA-AC-A3QQ-01 | Breast | breast invasive carcinoma | Female | <65 | I/II | Unknown | Unknown | SD |
| PDS5B | SNV | Missense_Mutation | novel | c.853N>T | p.Asp285Tyr | p.D285Y | Q9NTI5 | protein_coding | deleterious(0) | probably_damaging(0.971) | TCGA-AC-A3W5-01 | Breast | breast invasive carcinoma | Female | >=65 | I/II | Chemotherapy | docetaxel | CR |
| PDS5B | SNV | Missense_Mutation | novel | c.1810N>A | p.Leu604Ile | p.L604I | Q9NTI5 | protein_coding | deleterious(0) | possibly_damaging(0.839) | TCGA-AN-A046-01 | Breast | breast invasive carcinoma | Female | >=65 | I/II | Unknown | Unknown | SD |
| PDS5B | SNV | Missense_Mutation | c.970N>A | p.Asp324Asn | p.D324N | Q9NTI5 | protein_coding | deleterious(0.01) | probably_damaging(0.994) | TCGA-BH-A0DZ-01 | Breast | breast invasive carcinoma | Female | <65 | I/II | Chemotherapy | docetaxel | SD | |
| PDS5B | SNV | Missense_Mutation | c.1883C>T | p.Ser628Leu | p.S628L | Q9NTI5 | protein_coding | tolerated(0.07) | benign(0.167) | TCGA-BH-A208-01 | Breast | breast invasive carcinoma | Female | <65 | I/II | Unknown | Unknown | SD | |
| PDS5B | SNV | Missense_Mutation | novel | c.1219G>A | p.Glu407Lys | p.E407K | Q9NTI5 | protein_coding | deleterious(0) | probably_damaging(0.999) | TCGA-C8-A274-01 | Breast | breast invasive carcinoma | Female | <65 | I/II | Hormone Therapy | tamoxiphen | SD |
| PDS5B | SNV | Missense_Mutation | c.1940N>A | p.Arg647Lys | p.R647K | Q9NTI5 | protein_coding | tolerated(0.22) | possibly_damaging(0.501) | TCGA-EW-A1J5-01 | Breast | breast invasive carcinoma | Female | <65 | I/II | Chemotherapy | adriamycin | SD |
| Page: 1 2 3 4 5 6 7 8 9 10 11 12 13 14 15 16 17 18 19 20 |
Top |
Related drugs of malignant transformation related genes |
| Identification of chemicals and drugs interact with genes involved in malignant transfromation |
| (DGIdb 4.0) |
| Entrez ID | Symbol | Category | Interaction Types | Drug Claim Name | Drug Name | PMIDs |
| Page: 1 |

Copyright 2023-Present -The University of Texas Health Science Center at Houston |