
|
|||||
|
 | |
| |
| |
| |
| |
| |
|
Gene: PDS5A |
Gene summary for PDS5A |
| Gene information | Species | Human | Gene symbol | PDS5A | Gene ID | 23244 |
| Gene name | PDS5 cohesin associated factor A | |
| Gene Alias | PIG54 | |
| Cytomap | 4p14 | |
| Gene Type | protein-coding | GO ID | GO:0000070 | UniProtAcc | G1UI16 |
Top |
Malignant transformation analysis |
| Identification of the aberrant gene expression in precancerous and cancerous lesions by comparing the gene expression of stem-like cells in diseased tissues with normal stem cells |
| Entrez ID | Symbol | Replicates | Species | Organ | Tissue | Adj P-value | Log2FC | Malignancy |
| 23244 | PDS5A | CCI_1 | Human | Cervix | CC | 3.00e-03 | 7.22e-01 | 0.528 |
| 23244 | PDS5A | CCI_2 | Human | Cervix | CC | 5.54e-09 | 9.30e-01 | 0.5249 |
| 23244 | PDS5A | CCI_3 | Human | Cervix | CC | 7.84e-05 | 5.57e-01 | 0.516 |
| 23244 | PDS5A | HTA11_3410_2000001011 | Human | Colorectum | AD | 9.61e-05 | -3.07e-01 | 0.0155 |
| 23244 | PDS5A | HTA11_347_2000001011 | Human | Colorectum | AD | 2.16e-09 | 5.74e-01 | -0.1954 |
| 23244 | PDS5A | F007 | Human | Colorectum | FAP | 5.91e-04 | -2.90e-01 | 0.1176 |
| 23244 | PDS5A | A001-C-207 | Human | Colorectum | FAP | 8.51e-04 | -2.44e-01 | 0.1278 |
| 23244 | PDS5A | A015-C-203 | Human | Colorectum | FAP | 8.23e-37 | -5.10e-01 | -0.1294 |
| 23244 | PDS5A | A015-C-204 | Human | Colorectum | FAP | 2.29e-09 | -3.96e-01 | -0.0228 |
| 23244 | PDS5A | A014-C-040 | Human | Colorectum | FAP | 5.45e-07 | -4.90e-01 | -0.1184 |
| 23244 | PDS5A | A002-C-201 | Human | Colorectum | FAP | 9.92e-17 | -4.08e-01 | 0.0324 |
| 23244 | PDS5A | A002-C-203 | Human | Colorectum | FAP | 2.04e-05 | -2.26e-01 | 0.2786 |
| 23244 | PDS5A | A001-C-119 | Human | Colorectum | FAP | 9.54e-09 | -3.79e-01 | -0.1557 |
| 23244 | PDS5A | A001-C-108 | Human | Colorectum | FAP | 2.29e-18 | -3.05e-01 | -0.0272 |
| 23244 | PDS5A | A002-C-205 | Human | Colorectum | FAP | 4.37e-30 | -5.26e-01 | -0.1236 |
| 23244 | PDS5A | A001-C-104 | Human | Colorectum | FAP | 3.65e-04 | -2.04e-01 | 0.0184 |
| 23244 | PDS5A | A015-C-005 | Human | Colorectum | FAP | 1.57e-06 | -3.72e-01 | -0.0336 |
| 23244 | PDS5A | A015-C-006 | Human | Colorectum | FAP | 2.03e-21 | -5.80e-01 | -0.0994 |
| 23244 | PDS5A | A015-C-106 | Human | Colorectum | FAP | 2.96e-12 | -2.78e-01 | -0.0511 |
| 23244 | PDS5A | A002-C-114 | Human | Colorectum | FAP | 5.17e-25 | -4.87e-01 | -0.1561 |
| Page: 1 2 3 4 5 6 7 8 9 10 11 |
| Tissue | Expression Dynamics | Abbreviation |
| Cervix | 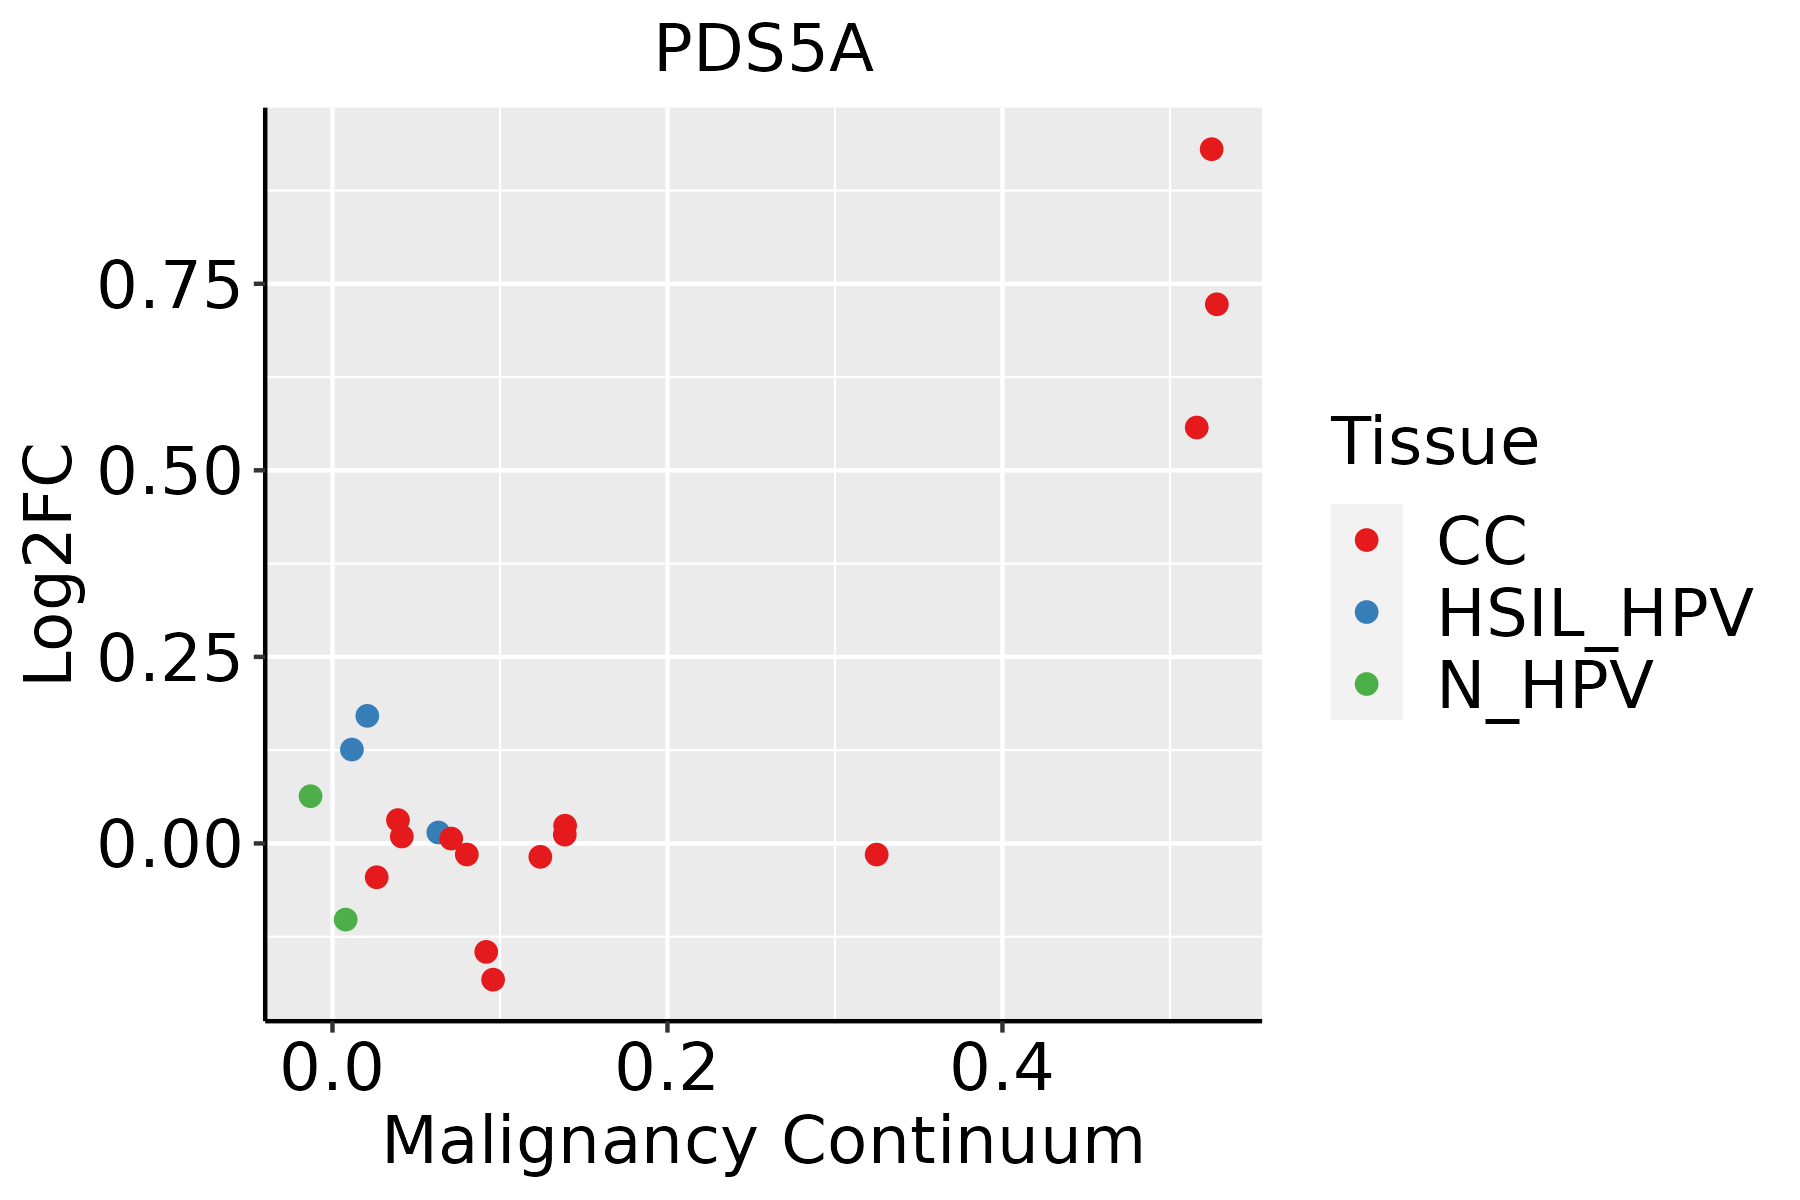 | CC: Cervix cancer |
| HSIL_HPV: HPV-infected high-grade squamous intraepithelial lesions | ||
| N_HPV: HPV-infected normal cervix | ||
| Colorectum (GSE201348) |  | FAP: Familial adenomatous polyposis |
| CRC: Colorectal cancer | ||
| Colorectum (HTA11) |  | AD: Adenomas |
| SER: Sessile serrated lesions | ||
| MSI-H: Microsatellite-high colorectal cancer | ||
| MSS: Microsatellite stable colorectal cancer | ||
| Endometrium | 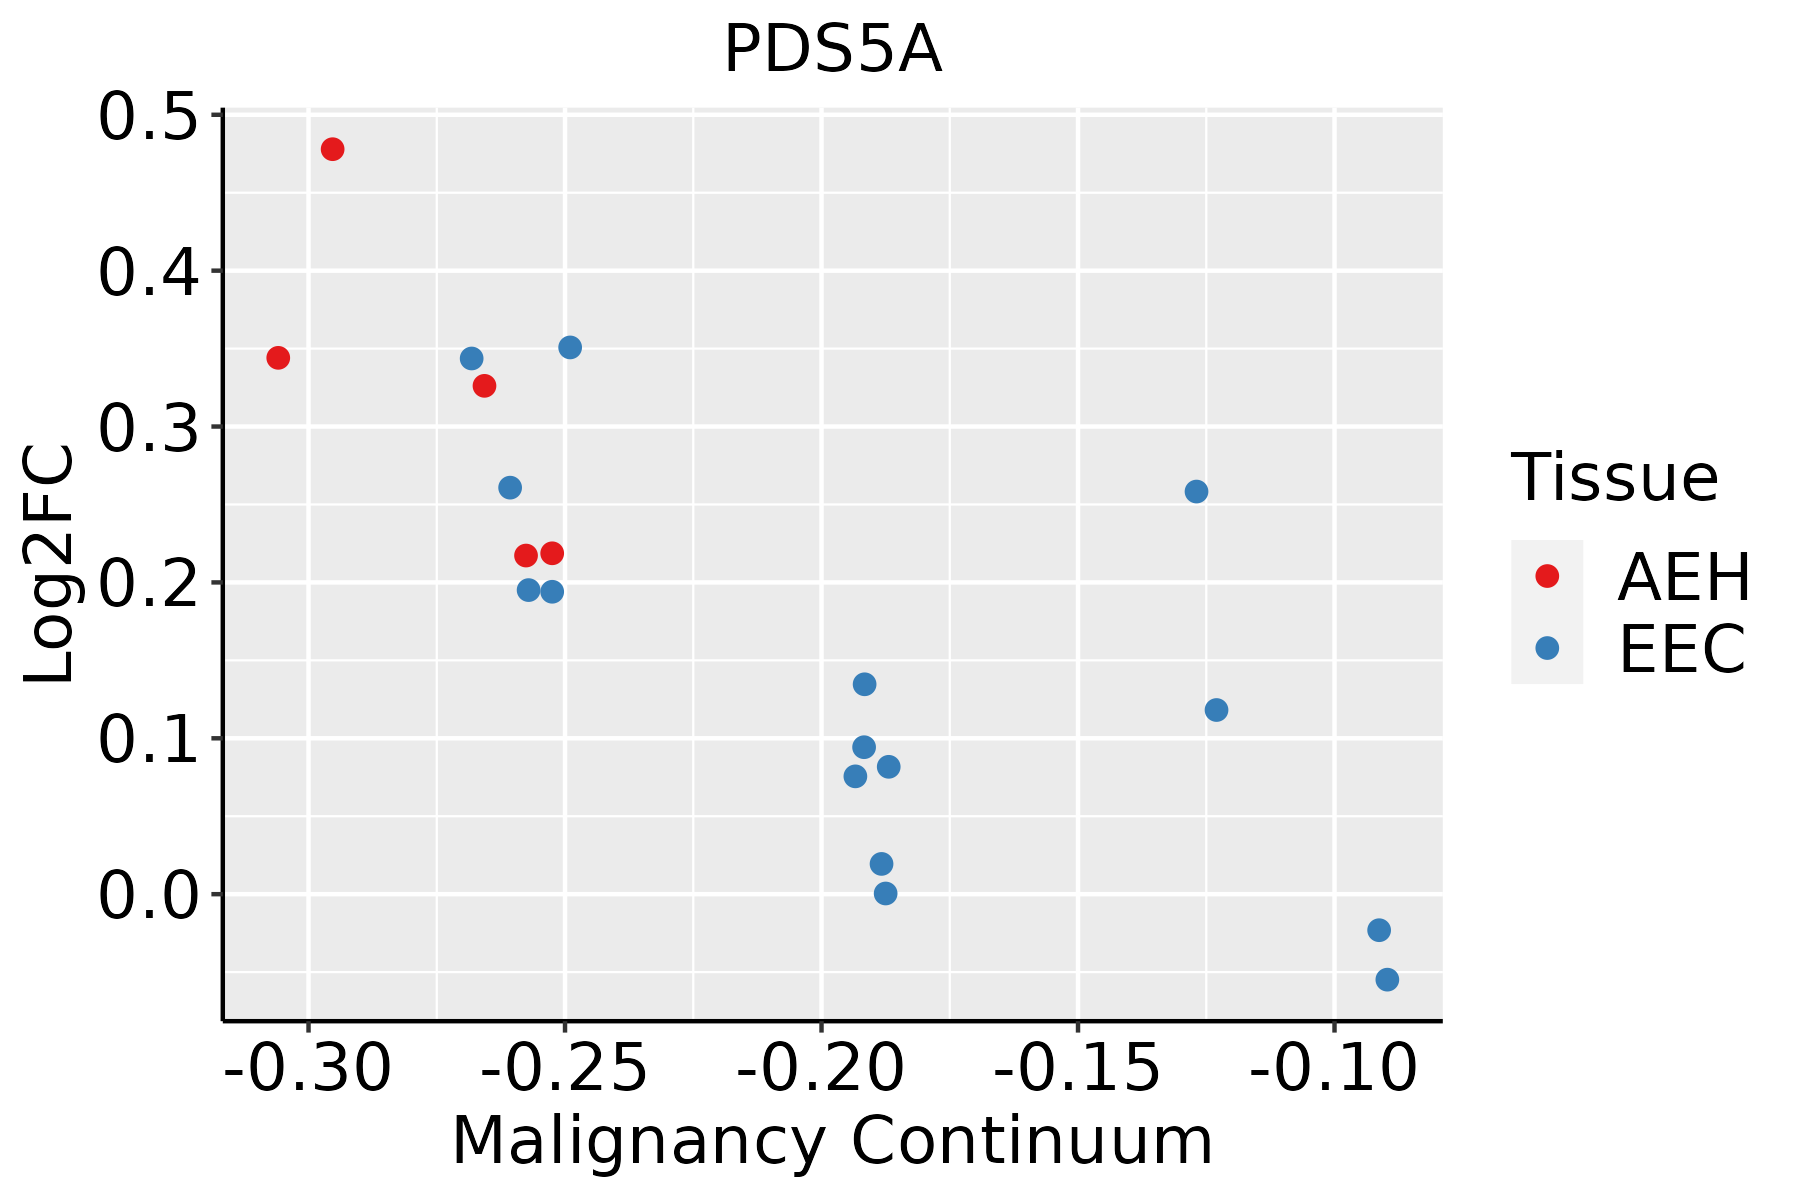 | AEH: Atypical endometrial hyperplasia |
| EEC: Endometrioid Cancer | ||
| Esophagus |  | ESCC: Esophageal squamous cell carcinoma |
| HGIN: High-grade intraepithelial neoplasias | ||
| LGIN: Low-grade intraepithelial neoplasias | ||
| Liver | 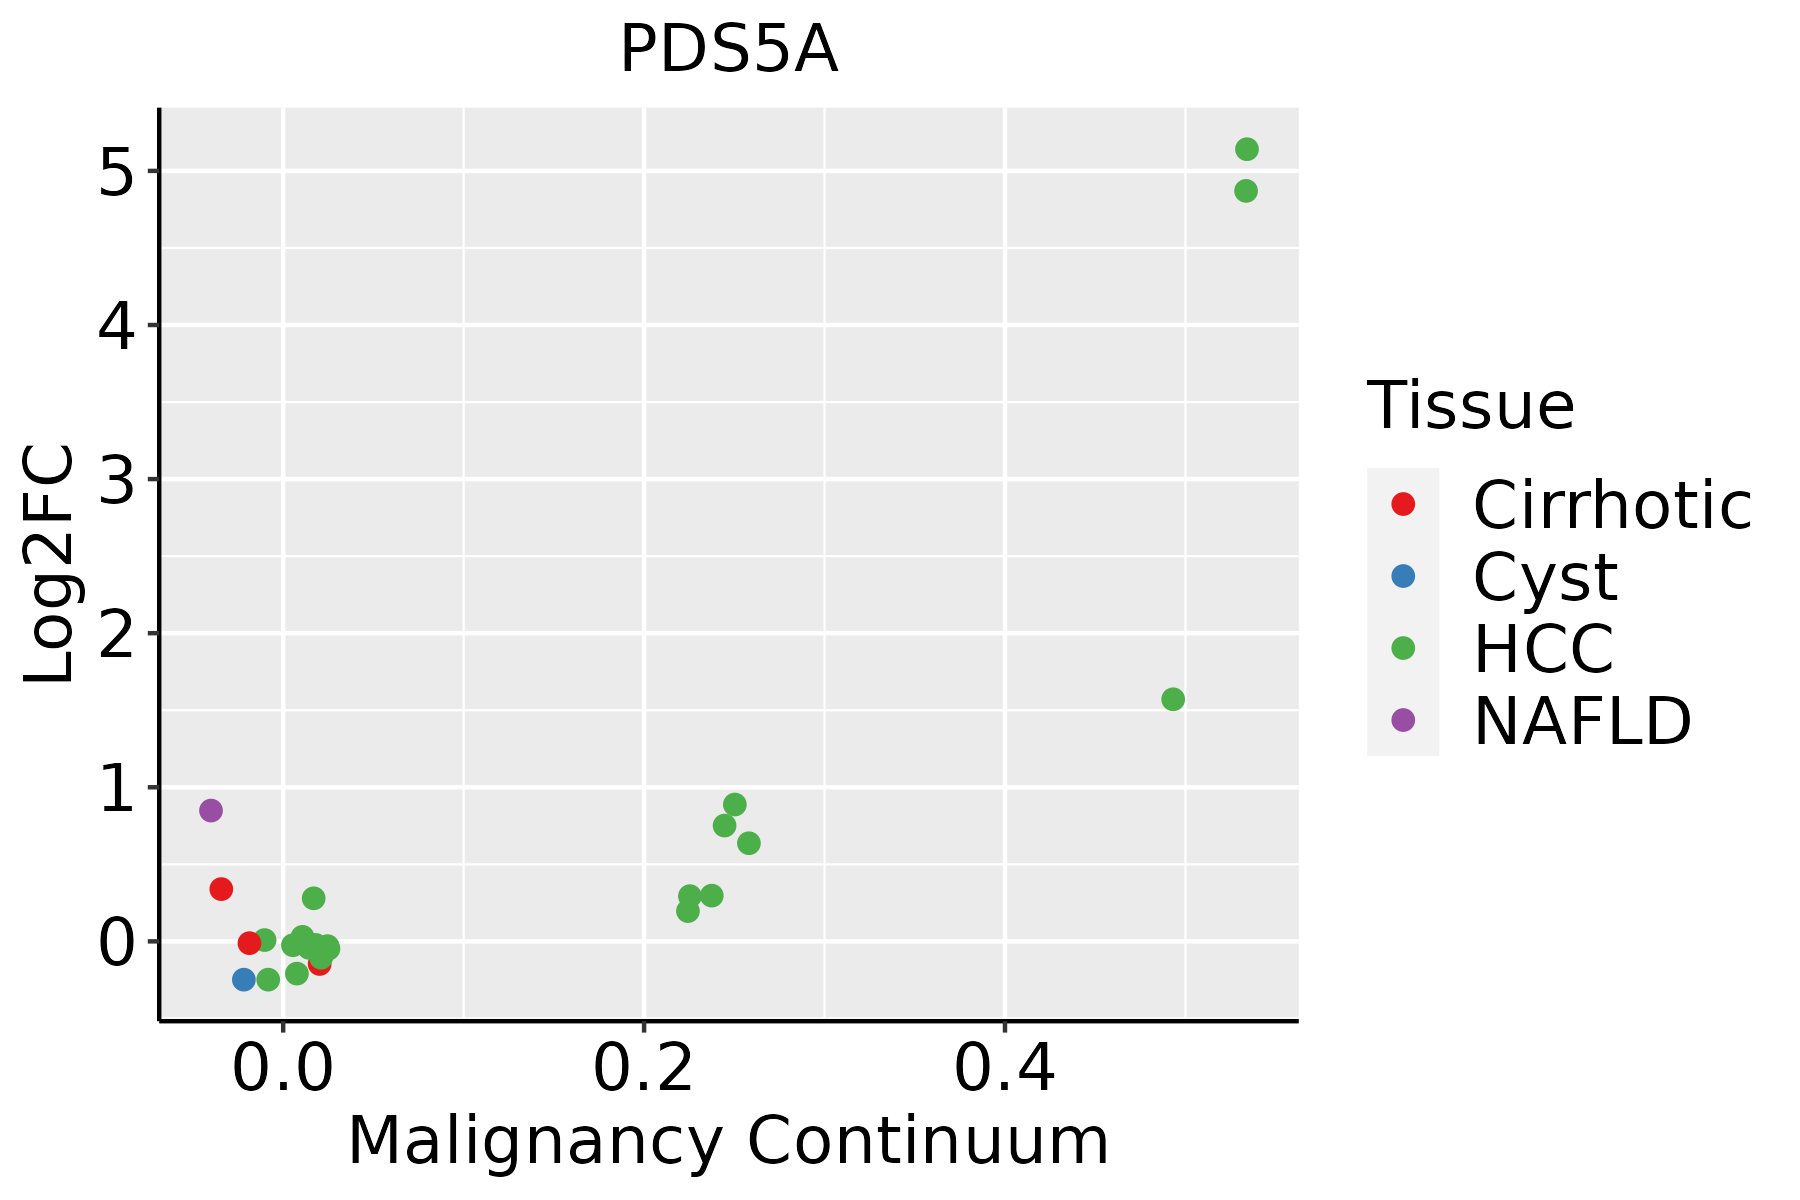 | HCC: Hepatocellular carcinoma |
| NAFLD: Non-alcoholic fatty liver disease | ||
| Lung |  | AAH: Atypical adenomatous hyperplasia |
| AIS: Adenocarcinoma in situ | ||
| IAC: Invasive lung adenocarcinoma | ||
| MIA: Minimally invasive adenocarcinoma | ||
| Oral Cavity | 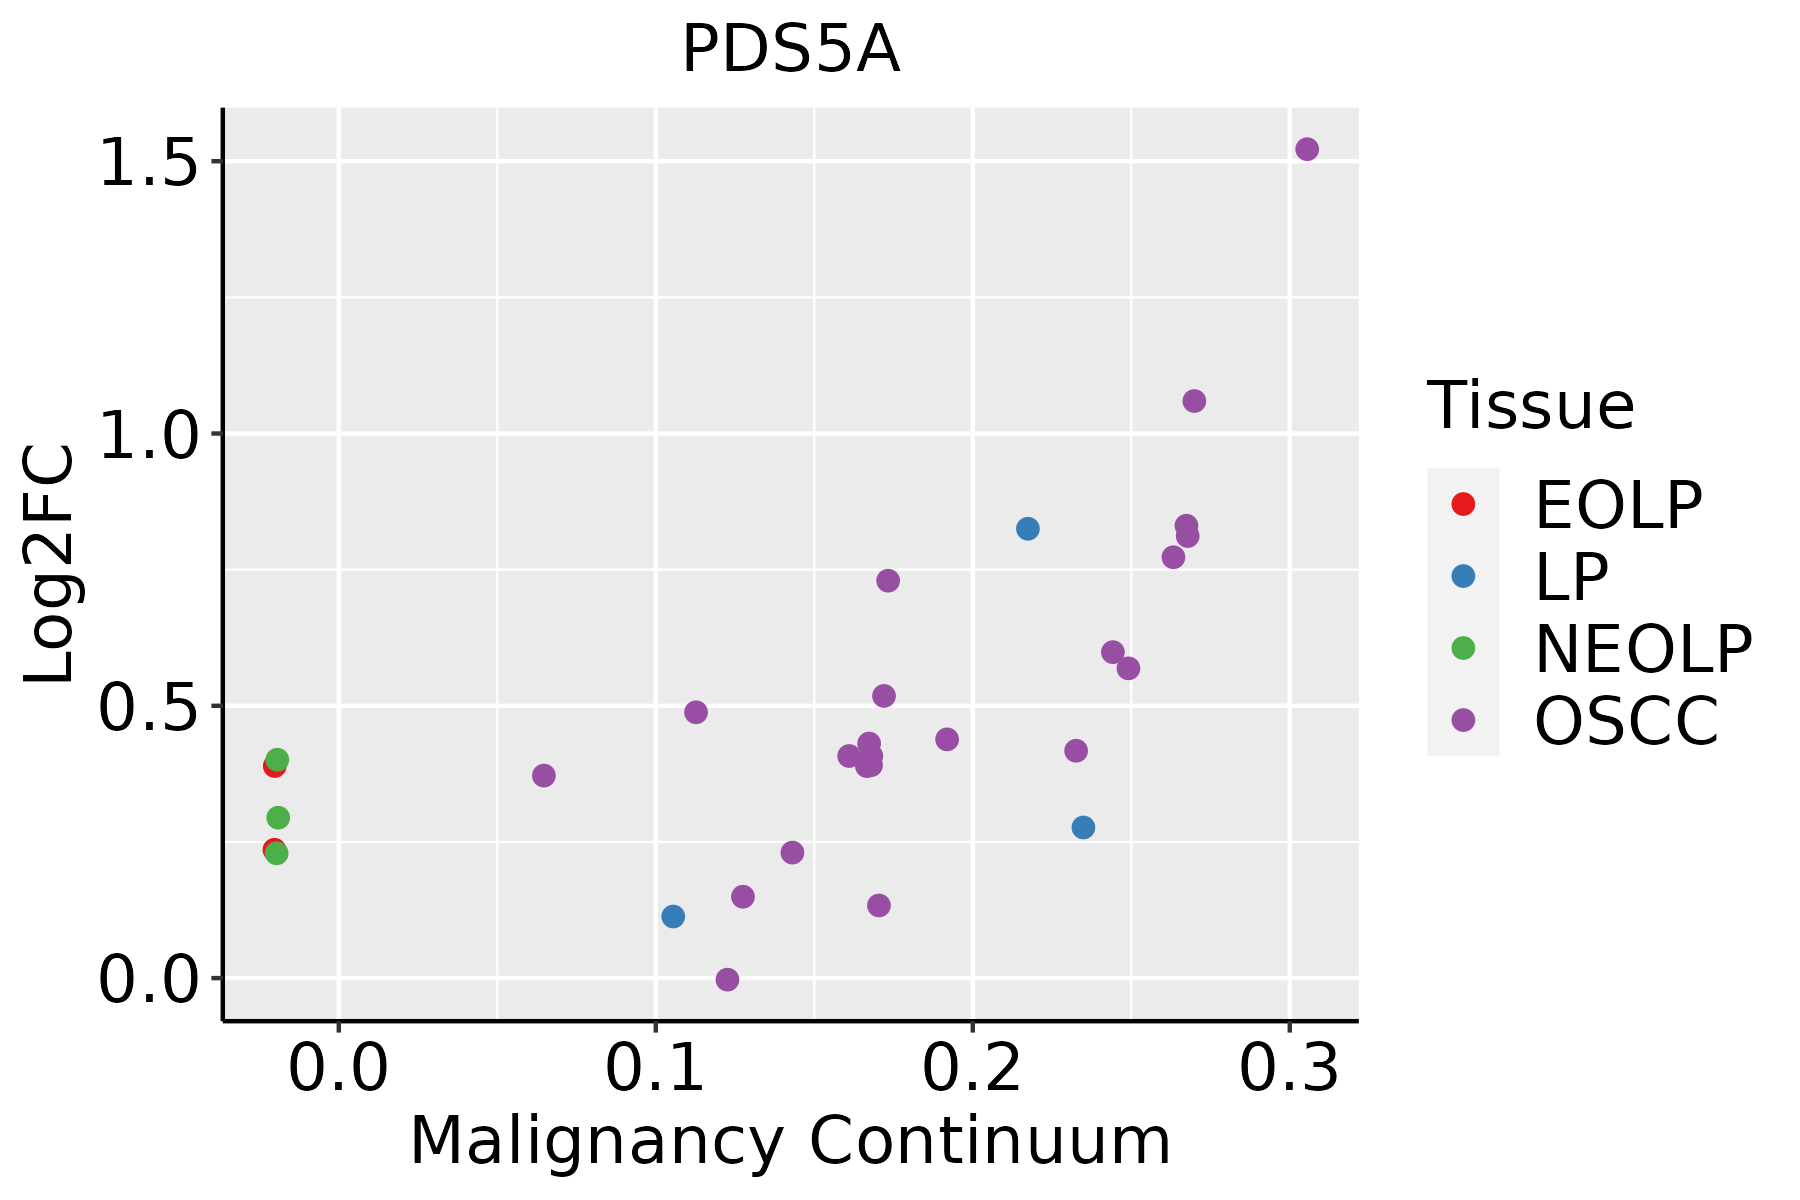 | EOLP: Erosive Oral lichen planus |
| LP: leukoplakia | ||
| NEOLP: Non-erosive oral lichen planus | ||
| OSCC: Oral squamous cell carcinoma | ||
| Prostate |  | BPH: Benign Prostatic Hyperplasia |
| Skin |  | AK: Actinic keratosis |
| cSCC: Cutaneous squamous cell carcinoma | ||
| SCCIS:squamous cell carcinoma in situ | ||
| Thyroid |  | ATC: Anaplastic thyroid cancer |
| HT: Hashimoto's thyroiditis | ||
| PTC: Papillary thyroid cancer |
| ∗log2FC in expression of this searched gene in stem-like cells from each diseased tissue sample relative to stem-like cells in normal samples in each tissue plotted against the malignancy continuum. Samples are colored based on if they are from different disease stage. |
Top |
Malignant transformation related pathway analysis |
| Find out the enriched GO biological processes and KEGG pathways involved in transition from healthy to precancer to cancer |
| Tissue | Disease Stage | Enriched GO biological Processes |
| Colorectum | AD |  |
| Colorectum | SER |  |
| Colorectum | MSS |  |
| Colorectum | MSI-H |  |
| Colorectum | FAP |  |
| ∗Top 15 enriched GO BP terms are showed in the bar plot of each disease state in each tissue. Each row represents a significant GO biological process which is colored according to the -log10(p.adjust). |
| Page: 1 2 3 4 5 6 7 8 9 |
| GO ID | Tissue | Disease Stage | Description | Gene Ratio | Bg Ratio | pvalue | p.adjust | Count |
| GO:00070646 | Cervix | CC | mitotic sister chromatid cohesion | 12/2311 | 28/18723 | 5.47e-05 | 8.06e-04 | 12 |
| GO:00062602 | Cervix | CC | DNA replication | 48/2311 | 260/18723 | 2.70e-03 | 1.85e-02 | 48 |
| GO:01400143 | Cervix | CC | mitotic nuclear division | 50/2311 | 287/18723 | 7.27e-03 | 3.91e-02 | 50 |
| GO:00070625 | Cervix | CC | sister chromatid cohesion | 15/2311 | 62/18723 | 7.30e-03 | 3.92e-02 | 15 |
| GO:00482851 | Cervix | CC | organelle fission | 78/2311 | 488/18723 | 9.70e-03 | 4.79e-02 | 78 |
| GO:0007064 | Colorectum | AD | mitotic sister chromatid cohesion | 13/3918 | 28/18723 | 2.22e-03 | 1.75e-02 | 13 |
| GO:0007062 | Colorectum | AD | sister chromatid cohesion | 23/3918 | 62/18723 | 2.51e-03 | 1.92e-02 | 23 |
| GO:0140014 | Colorectum | AD | mitotic nuclear division | 78/3918 | 287/18723 | 6.48e-03 | 4.05e-02 | 78 |
| GO:00070642 | Colorectum | FAP | mitotic sister chromatid cohesion | 11/2622 | 28/18723 | 8.55e-04 | 8.79e-03 | 11 |
| GO:00070622 | Colorectum | FAP | sister chromatid cohesion | 18/2622 | 62/18723 | 1.60e-03 | 1.42e-02 | 18 |
| GO:00070623 | Colorectum | CRC | sister chromatid cohesion | 16/2078 | 62/18723 | 9.40e-04 | 1.15e-02 | 16 |
| GO:00070643 | Colorectum | CRC | mitotic sister chromatid cohesion | 9/2078 | 28/18723 | 2.43e-03 | 2.30e-02 | 9 |
| GO:0006275 | Colorectum | CRC | regulation of DNA replication | 21/2078 | 107/18723 | 6.56e-03 | 4.70e-02 | 21 |
| GO:00062752 | Endometrium | AEH | regulation of DNA replication | 21/2100 | 107/18723 | 7.38e-03 | 4.20e-02 | 21 |
| GO:000627511 | Endometrium | EEC | regulation of DNA replication | 22/2168 | 107/18723 | 5.09e-03 | 3.20e-02 | 22 |
| GO:014001414 | Esophagus | ESCC | mitotic nuclear division | 218/8552 | 287/18723 | 6.17e-26 | 1.78e-23 | 218 |
| GO:000007011 | Esophagus | ESCC | mitotic sister chromatid segregation | 138/8552 | 168/18723 | 1.37e-22 | 2.63e-20 | 138 |
| GO:00008194 | Esophagus | ESCC | sister chromatid segregation | 157/8552 | 202/18723 | 8.41e-21 | 1.33e-18 | 157 |
| GO:000705911 | Esophagus | ESCC | chromosome segregation | 238/8552 | 346/18723 | 1.72e-18 | 1.82e-16 | 238 |
| GO:00062604 | Esophagus | ESCC | DNA replication | 181/8552 | 260/18723 | 3.55e-15 | 2.05e-13 | 181 |
| Page: 1 2 3 4 5 6 |
| Pathway ID | Tissue | Disease Stage | Description | Gene Ratio | Bg Ratio | pvalue | p.adjust | qvalue | Count |
| hsa041106 | Cervix | CC | Cell cycle | 36/1267 | 157/8465 | 4.94e-03 | 1.67e-02 | 9.86e-03 | 36 |
| hsa0411013 | Cervix | CC | Cell cycle | 36/1267 | 157/8465 | 4.94e-03 | 1.67e-02 | 9.86e-03 | 36 |
| hsa04110 | Colorectum | FAP | Cell cycle | 37/1404 | 157/8465 | 1.44e-02 | 4.77e-02 | 2.90e-02 | 37 |
| hsa041101 | Colorectum | FAP | Cell cycle | 37/1404 | 157/8465 | 1.44e-02 | 4.77e-02 | 2.90e-02 | 37 |
| hsa0411023 | Esophagus | ESCC | Cell cycle | 126/4205 | 157/8465 | 1.34e-15 | 5.60e-14 | 2.87e-14 | 126 |
| hsa0411033 | Esophagus | ESCC | Cell cycle | 126/4205 | 157/8465 | 1.34e-15 | 5.60e-14 | 2.87e-14 | 126 |
| hsa041104 | Liver | Cirrhotic | Cell cycle | 61/2530 | 157/8465 | 9.53e-03 | 3.21e-02 | 1.98e-02 | 61 |
| hsa0411011 | Liver | Cirrhotic | Cell cycle | 61/2530 | 157/8465 | 9.53e-03 | 3.21e-02 | 1.98e-02 | 61 |
| hsa041102 | Liver | HCC | Cell cycle | 106/4020 | 157/8465 | 2.54e-07 | 3.04e-06 | 1.69e-06 | 106 |
| hsa041103 | Liver | HCC | Cell cycle | 106/4020 | 157/8465 | 2.54e-07 | 3.04e-06 | 1.69e-06 | 106 |
| hsa041105 | Lung | IAC | Cell cycle | 30/1053 | 157/8465 | 1.03e-02 | 3.83e-02 | 2.54e-02 | 30 |
| hsa0411012 | Lung | IAC | Cell cycle | 30/1053 | 157/8465 | 1.03e-02 | 3.83e-02 | 2.54e-02 | 30 |
| hsa041108 | Oral cavity | OSCC | Cell cycle | 118/3704 | 157/8465 | 7.15e-16 | 2.66e-14 | 1.35e-14 | 118 |
| hsa0411015 | Oral cavity | OSCC | Cell cycle | 118/3704 | 157/8465 | 7.15e-16 | 2.66e-14 | 1.35e-14 | 118 |
| hsa0411022 | Oral cavity | LP | Cell cycle | 70/2418 | 157/8465 | 1.17e-05 | 8.27e-05 | 5.33e-05 | 70 |
| hsa0411032 | Oral cavity | LP | Cell cycle | 70/2418 | 157/8465 | 1.17e-05 | 8.27e-05 | 5.33e-05 | 70 |
| hsa0411041 | Oral cavity | EOLP | Cell cycle | 42/1218 | 157/8465 | 3.20e-05 | 1.61e-04 | 9.52e-05 | 42 |
| hsa0411051 | Oral cavity | EOLP | Cell cycle | 42/1218 | 157/8465 | 3.20e-05 | 1.61e-04 | 9.52e-05 | 42 |
| hsa0411061 | Oral cavity | NEOLP | Cell cycle | 37/1112 | 157/8465 | 2.29e-04 | 1.58e-03 | 9.95e-04 | 37 |
| hsa0411071 | Oral cavity | NEOLP | Cell cycle | 37/1112 | 157/8465 | 2.29e-04 | 1.58e-03 | 9.95e-04 | 37 |
| Page: 1 2 |
Top |
Cell-cell communication analysis |
| Identification of potential cell-cell interactions between two cell types and their ligand-receptor pairs for different disease states |
| Ligand | Receptor | LRpair | Pathway | Tissue | Disease Stage |
| Page: 1 |
Top |
Single-cell gene regulatory network inference analysis |
| Find out the significant the regulons (TFs) and the target genes of each regulon across cell types for different disease states |
| TF | Cell Type | Tissue | Disease Stage | Target Gene | RSS | Regulon Activity |
| ∗The dot plots of a searched regulon are shown for all cell subpopulations in each disease state of each tissue based on the regulon specific score inferred using pySCENIC and by calculating the average expression. |
| Page: 1 |
Top |
Somatic mutation of malignant transformation related genes |
| Annotation of somatic variants for genes involved in malignant transformation |
| Hugo Symbol | Variant Class | Variant Classification | dbSNP RS | HGVSc | HGVSp | HGVSp Short | SWISSPROT | BIOTYPE | SIFT | PolyPhen | Tumor Sample Barcode | Tissue | Histology | Sex | Age | Stage | Therapy Types | Drugs | Outcome |
| PDS5A | SNV | Missense_Mutation | rs772049125 | c.559N>G | p.Met187Val | p.M187V | Q29RF7 | protein_coding | deleterious(0) | probably_damaging(0.986) | TCGA-AN-A0FT-01 | Breast | breast invasive carcinoma | Female | <65 | I/II | Unknown | Unknown | SD |
| PDS5A | SNV | Missense_Mutation | c.2771N>C | p.Glu924Ala | p.E924A | Q29RF7 | protein_coding | deleterious(0.04) | probably_damaging(0.96) | TCGA-AR-A0TP-01 | Breast | breast invasive carcinoma | Female | <65 | I/II | Chemotherapy | doxorubicin | SD | |
| PDS5A | SNV | Missense_Mutation | c.886G>A | p.Gly296Arg | p.G296R | Q29RF7 | protein_coding | tolerated(0.11) | benign(0.295) | TCGA-D8-A27G-01 | Breast | breast invasive carcinoma | Female | >=65 | I/II | Unknown | Unknown | SD | |
| PDS5A | SNV | Missense_Mutation | c.2687N>A | p.Ile896Lys | p.I896K | Q29RF7 | protein_coding | deleterious(0) | probably_damaging(0.962) | TCGA-EW-A1PA-01 | Breast | breast invasive carcinoma | Female | <65 | I/II | Chemotherapy | cyclophosphamide | SD | |
| PDS5A | SNV | Missense_Mutation | novel | c.308N>A | p.Pro103Gln | p.P103Q | Q29RF7 | protein_coding | deleterious(0) | probably_damaging(1) | TCGA-OL-A66P-01 | Breast | breast invasive carcinoma | Female | >=65 | I/II | Chemotherapy | cytoxan | CR |
| PDS5A | deletion | Frame_Shift_Del | novel | c.3886_3911delNNNNNNNNNNNNNNNNNNNNNNNNNN | p.Arg1296GlufsTer9 | p.R1296Efs*9 | Q29RF7 | protein_coding | TCGA-A2-A0D4-01 | Breast | breast invasive carcinoma | Female | <65 | I/II | Chemotherapy | adriamycin | SD | ||
| PDS5A | insertion | Nonsense_Mutation | novel | c.3616_3617insGAGACCAGCCTGGCCAACATGGCGAAAC | p.Ser1206Ter | p.S1206* | Q29RF7 | protein_coding | TCGA-AN-A0FX-01 | Breast | breast invasive carcinoma | Female | <65 | I/II | Unknown | Unknown | SD | ||
| PDS5A | SNV | Missense_Mutation | novel | c.965G>A | p.Arg322His | p.R322H | Q29RF7 | protein_coding | tolerated(0.06) | possibly_damaging(0.681) | TCGA-2W-A8YY-01 | Cervix | cervical & endocervical cancer | Female | <65 | I/II | Chemotherapy | cisplatin | CR |
| PDS5A | SNV | Missense_Mutation | c.1321G>C | p.Glu441Gln | p.E441Q | Q29RF7 | protein_coding | tolerated(0.21) | benign(0.034) | TCGA-DR-A0ZM-01 | Cervix | cervical & endocervical cancer | Female | <65 | III/IV | Unspecific | Cisplatin | SD | |
| PDS5A | SNV | Missense_Mutation | c.2567N>G | p.Ser856Cys | p.S856C | Q29RF7 | protein_coding | deleterious(0) | probably_damaging(0.999) | TCGA-LP-A4AX-01 | Cervix | cervical & endocervical cancer | Female | <65 | I/II | Unknown | Unknown | SD |
| Page: 1 2 3 4 5 6 7 8 9 10 11 12 |
Top |
Related drugs of malignant transformation related genes |
| Identification of chemicals and drugs interact with genes involved in malignant transfromation |
| (DGIdb 4.0) |
| Entrez ID | Symbol | Category | Interaction Types | Drug Claim Name | Drug Name | PMIDs |
| Page: 1 |

Copyright 2023-Present -The University of Texas Health Science Center at Houston |