
|
|||||
|
 | |
| |
| |
| |
| |
| |
|
Gene: PDRG1 |
Gene summary for PDRG1 |
| Gene information | Species | Human | Gene symbol | PDRG1 | Gene ID | 81572 |
| Gene name | p53 and DNA damage regulated 1 | |
| Gene Alias | C20orf126 | |
| Cytomap | 20q11.21 | |
| Gene Type | protein-coding | GO ID | GO:0006457 | UniProtAcc | Q9NUG6 |
Top |
Malignant transformation analysis |
| Identification of the aberrant gene expression in precancerous and cancerous lesions by comparing the gene expression of stem-like cells in diseased tissues with normal stem cells |
| Entrez ID | Symbol | Replicates | Species | Organ | Tissue | Adj P-value | Log2FC | Malignancy |
| 81572 | PDRG1 | LZE4T | Human | Esophagus | ESCC | 5.46e-15 | 4.76e-01 | 0.0811 |
| 81572 | PDRG1 | LZE7T | Human | Esophagus | ESCC | 2.21e-06 | 5.31e-01 | 0.0667 |
| 81572 | PDRG1 | LZE20T | Human | Esophagus | ESCC | 2.06e-05 | 2.35e-01 | 0.0662 |
| 81572 | PDRG1 | LZE24T | Human | Esophagus | ESCC | 1.29e-29 | 9.49e-01 | 0.0596 |
| 81572 | PDRG1 | P1T-E | Human | Esophagus | ESCC | 3.34e-04 | 2.66e-01 | 0.0875 |
| 81572 | PDRG1 | P2T-E | Human | Esophagus | ESCC | 3.21e-21 | 4.11e-01 | 0.1177 |
| 81572 | PDRG1 | P4T-E | Human | Esophagus | ESCC | 7.96e-23 | 6.11e-01 | 0.1323 |
| 81572 | PDRG1 | P5T-E | Human | Esophagus | ESCC | 6.75e-24 | 4.88e-01 | 0.1327 |
| 81572 | PDRG1 | P8T-E | Human | Esophagus | ESCC | 2.66e-21 | 4.71e-01 | 0.0889 |
| 81572 | PDRG1 | P9T-E | Human | Esophagus | ESCC | 1.68e-07 | 2.12e-01 | 0.1131 |
| 81572 | PDRG1 | P10T-E | Human | Esophagus | ESCC | 9.19e-51 | 8.71e-01 | 0.116 |
| 81572 | PDRG1 | P11T-E | Human | Esophagus | ESCC | 2.12e-10 | 4.19e-01 | 0.1426 |
| 81572 | PDRG1 | P12T-E | Human | Esophagus | ESCC | 2.83e-29 | 5.87e-01 | 0.1122 |
| 81572 | PDRG1 | P15T-E | Human | Esophagus | ESCC | 7.78e-19 | 4.97e-01 | 0.1149 |
| 81572 | PDRG1 | P16T-E | Human | Esophagus | ESCC | 7.54e-40 | 7.70e-01 | 0.1153 |
| 81572 | PDRG1 | P17T-E | Human | Esophagus | ESCC | 2.98e-06 | 3.96e-01 | 0.1278 |
| 81572 | PDRG1 | P19T-E | Human | Esophagus | ESCC | 2.28e-11 | 6.26e-01 | 0.1662 |
| 81572 | PDRG1 | P20T-E | Human | Esophagus | ESCC | 8.33e-34 | 7.34e-01 | 0.1124 |
| 81572 | PDRG1 | P21T-E | Human | Esophagus | ESCC | 4.86e-24 | 6.72e-01 | 0.1617 |
| 81572 | PDRG1 | P22T-E | Human | Esophagus | ESCC | 2.44e-35 | 6.35e-01 | 0.1236 |
| Page: 1 2 3 4 5 6 |
| Tissue | Expression Dynamics | Abbreviation |
| Esophagus | 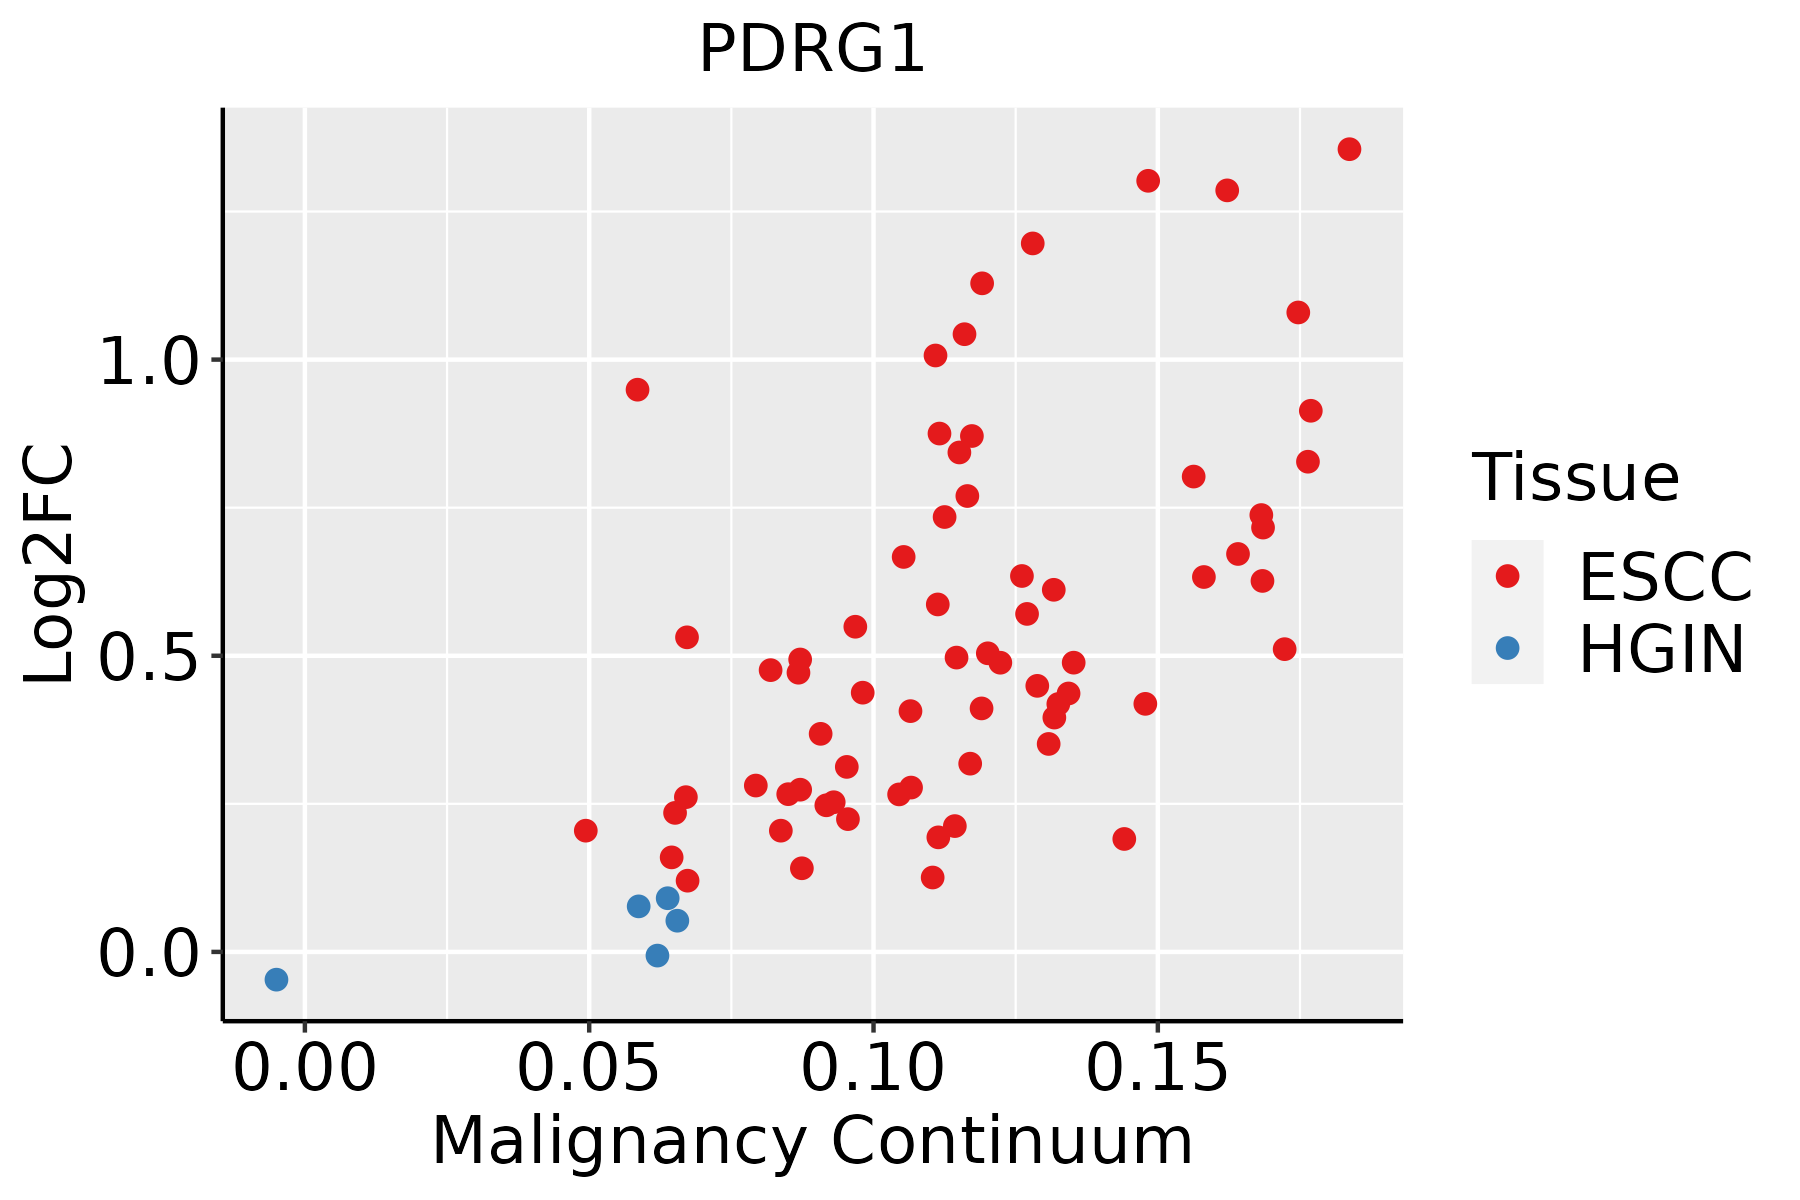 | ESCC: Esophageal squamous cell carcinoma |
| HGIN: High-grade intraepithelial neoplasias | ||
| LGIN: Low-grade intraepithelial neoplasias | ||
| Liver | 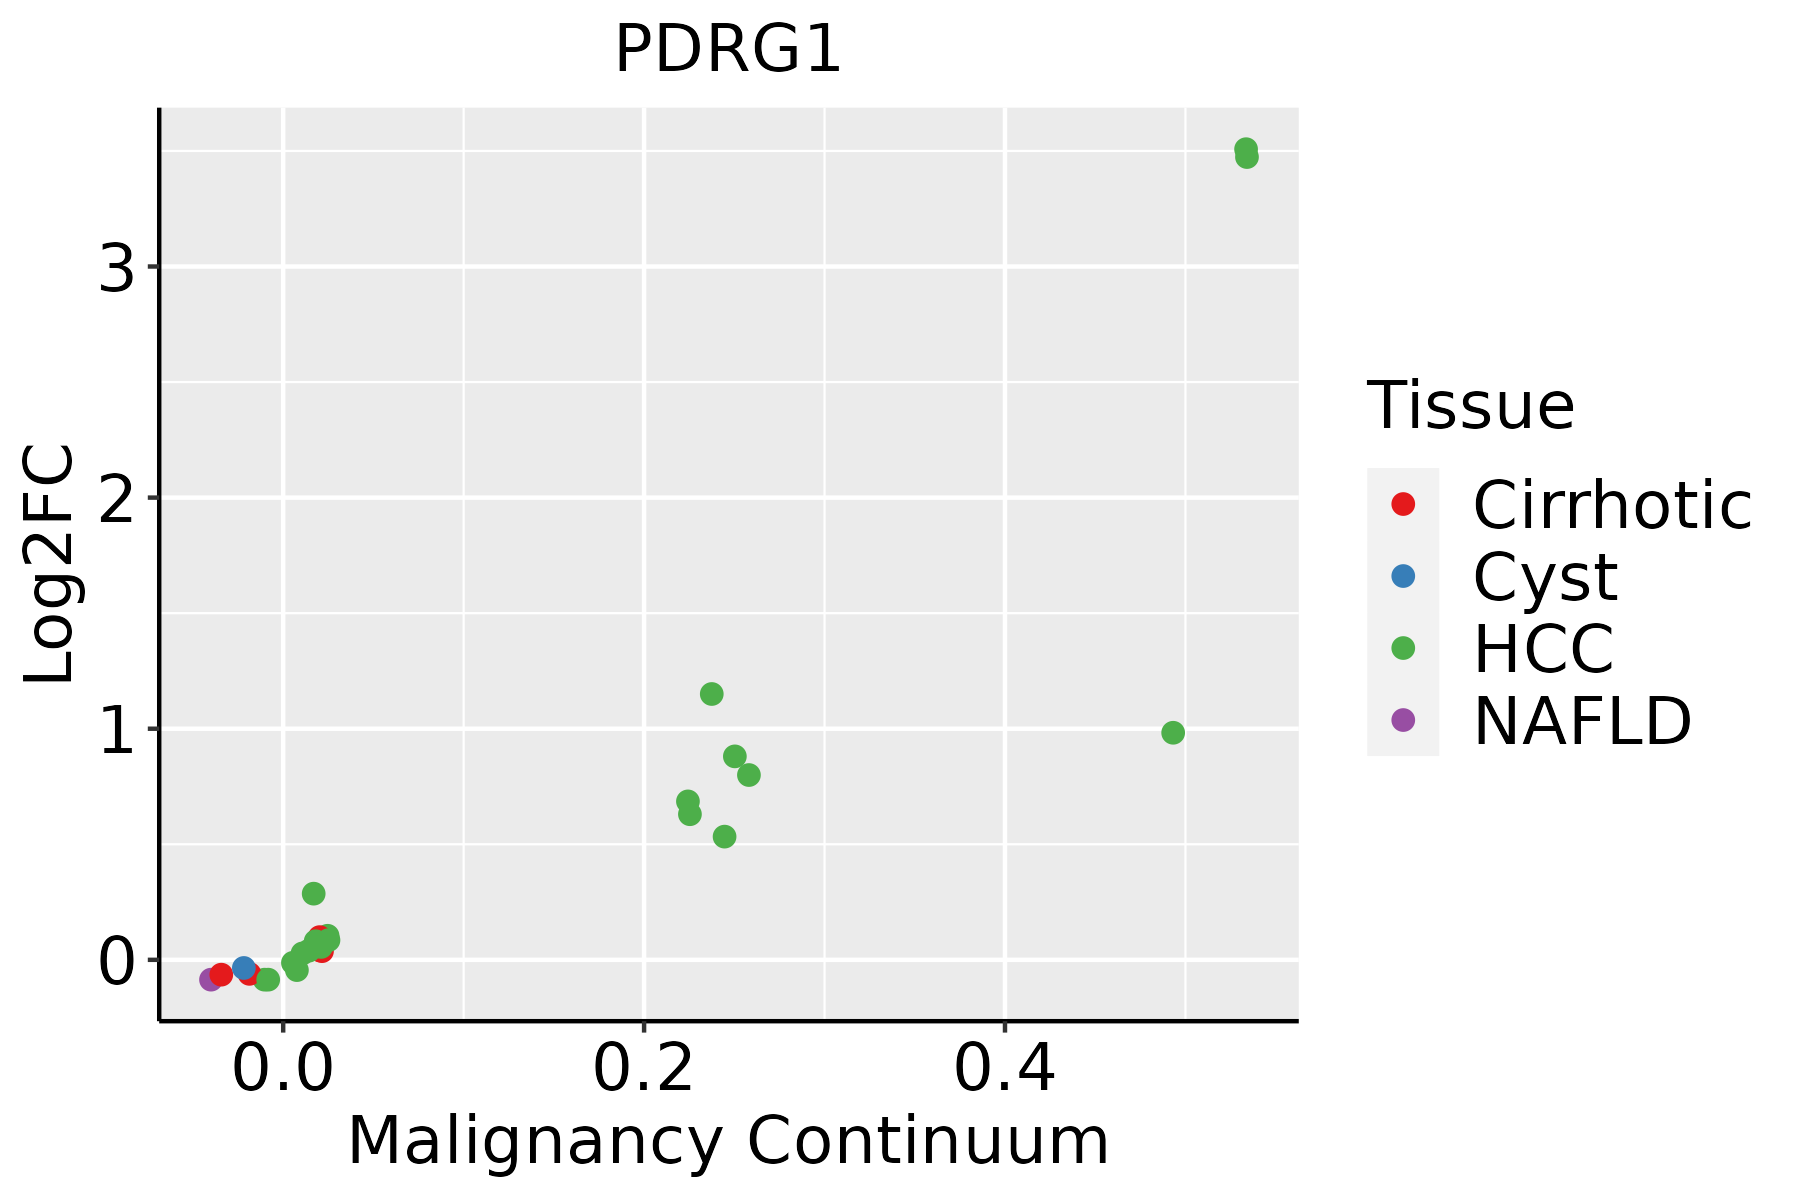 | HCC: Hepatocellular carcinoma |
| NAFLD: Non-alcoholic fatty liver disease | ||
| Oral Cavity | 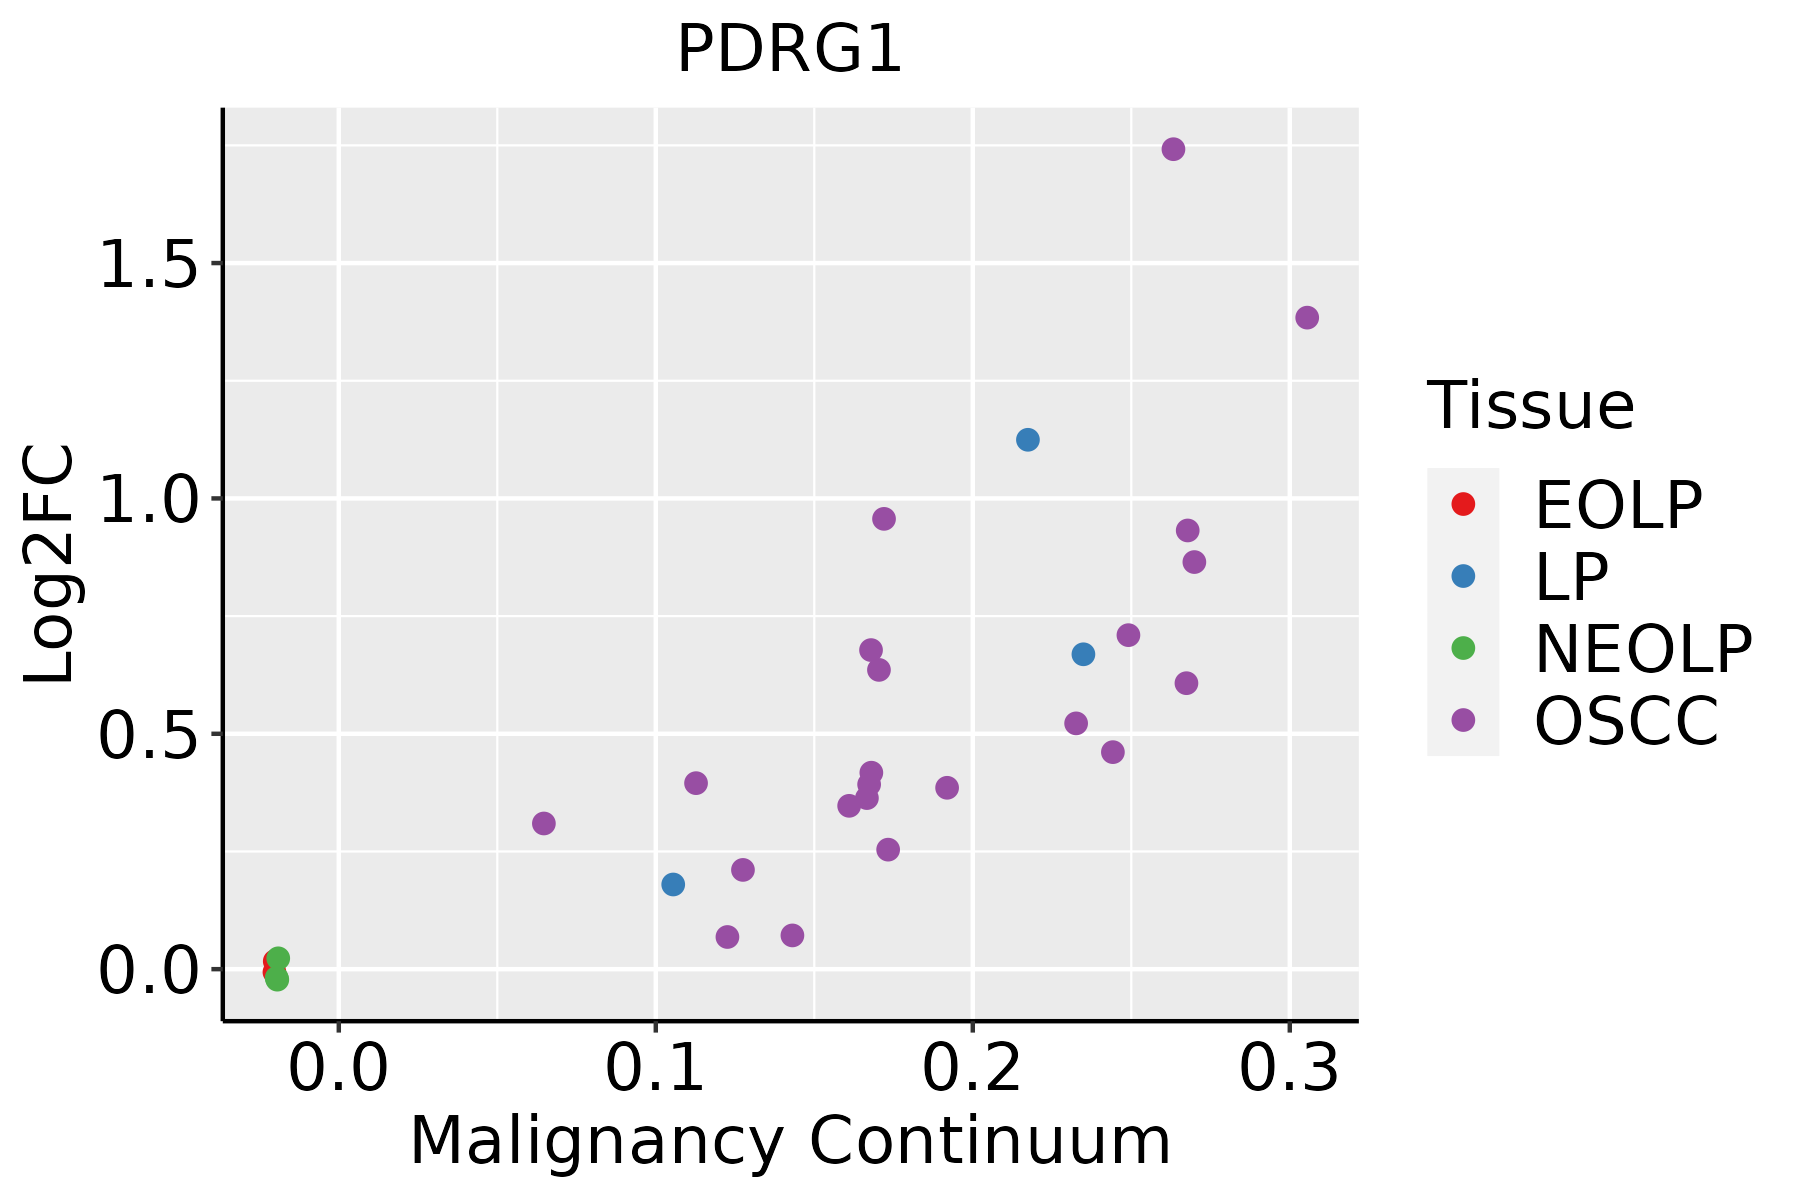 | EOLP: Erosive Oral lichen planus |
| LP: leukoplakia | ||
| NEOLP: Non-erosive oral lichen planus | ||
| OSCC: Oral squamous cell carcinoma | ||
| Skin | 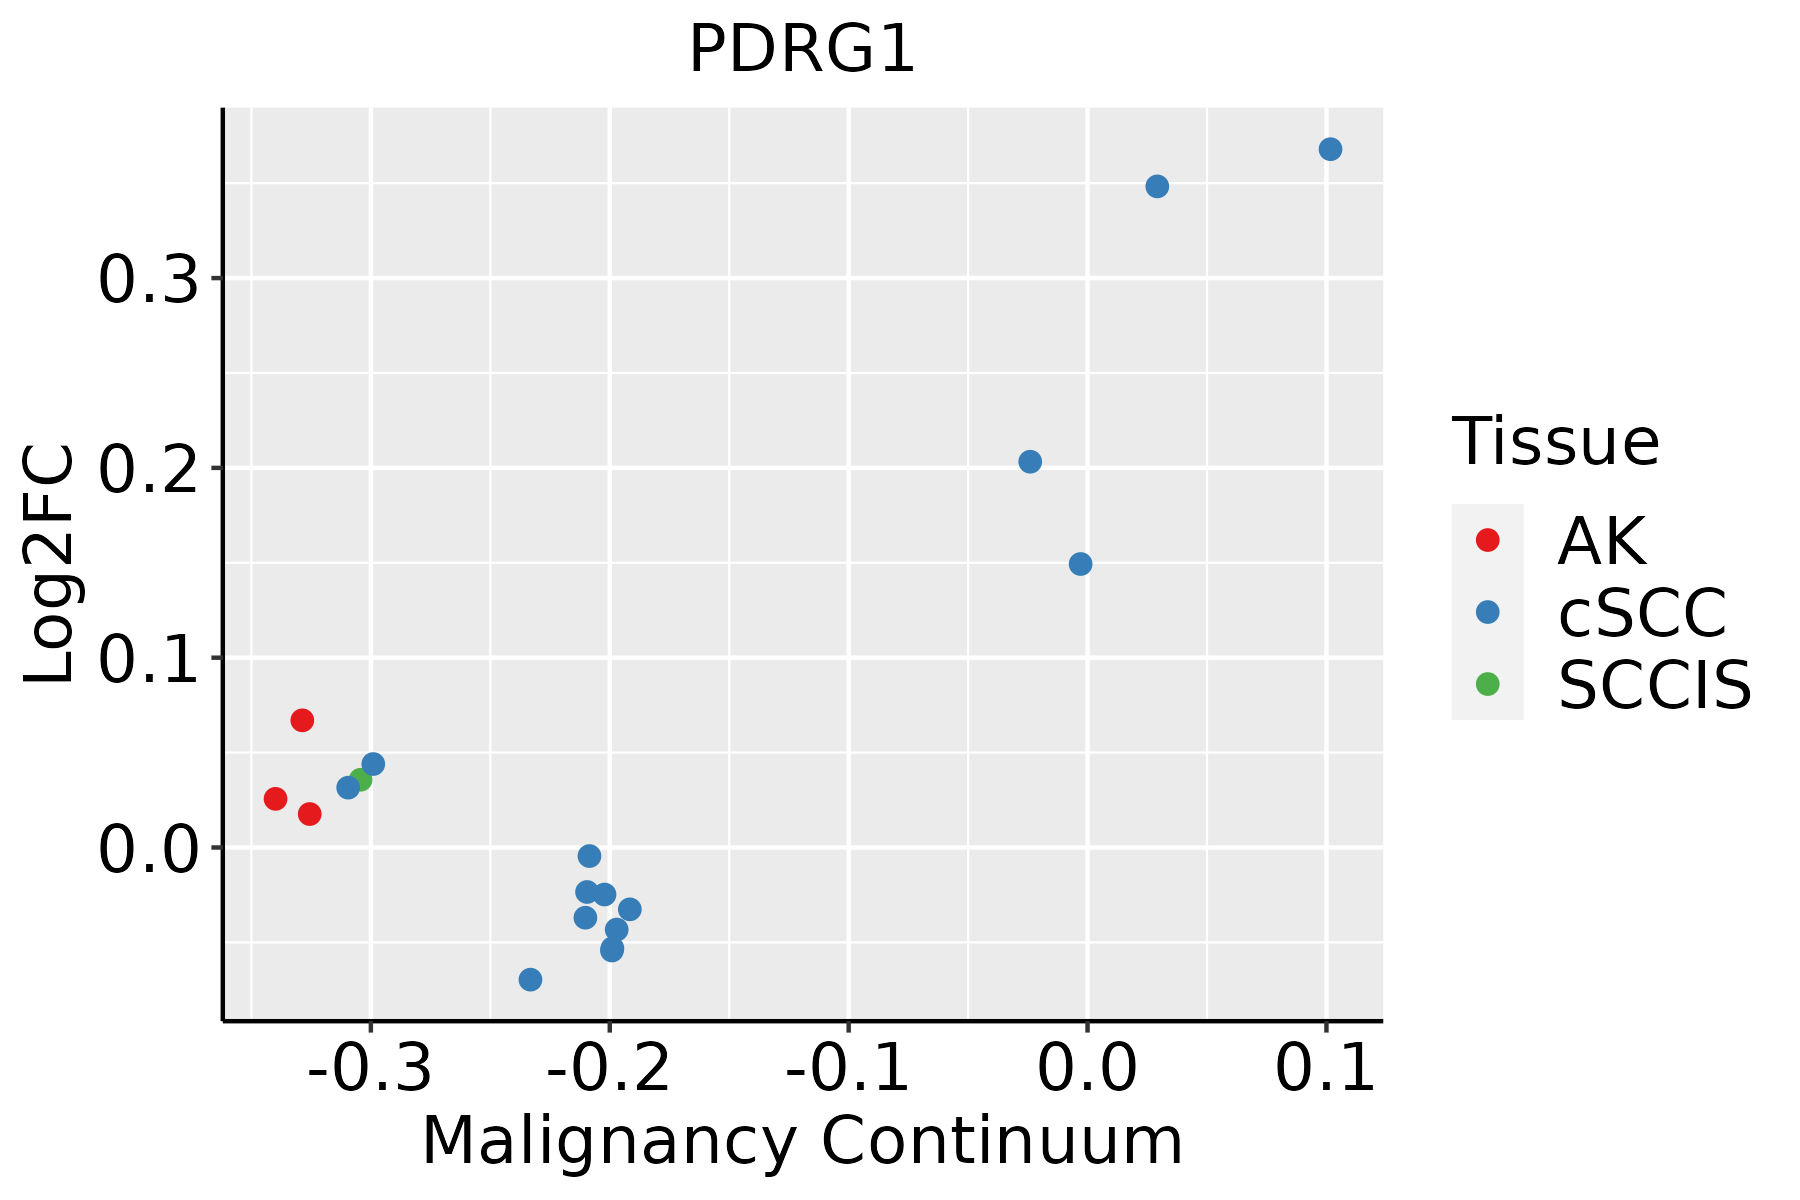 | AK: Actinic keratosis |
| cSCC: Cutaneous squamous cell carcinoma | ||
| SCCIS:squamous cell carcinoma in situ | ||
| Thyroid |  | ATC: Anaplastic thyroid cancer |
| HT: Hashimoto's thyroiditis | ||
| PTC: Papillary thyroid cancer |
| ∗log2FC in expression of this searched gene in stem-like cells from each diseased tissue sample relative to stem-like cells in normal samples in each tissue plotted against the malignancy continuum. Samples are colored based on if they are from different disease stage. |
Top |
Malignant transformation related pathway analysis |
| Find out the enriched GO biological processes and KEGG pathways involved in transition from healthy to precancer to cancer |
| Tissue | Disease Stage | Enriched GO biological Processes |
| Colorectum | AD |  |
| Colorectum | SER |  |
| Colorectum | MSS |  |
| Colorectum | MSI-H |  |
| Colorectum | FAP |  |
| ∗Top 15 enriched GO BP terms are showed in the bar plot of each disease state in each tissue. Each row represents a significant GO biological process which is colored according to the -log10(p.adjust). |
| Page: 1 2 3 4 5 6 7 8 9 |
| GO ID | Tissue | Disease Stage | Description | Gene Ratio | Bg Ratio | pvalue | p.adjust | Count |
| GO:0006457110 | Esophagus | ESCC | protein folding | 163/8552 | 212/18723 | 1.13e-20 | 1.74e-18 | 163 |
| GO:00064577 | Liver | Cirrhotic | protein folding | 114/4634 | 212/18723 | 9.23e-20 | 2.31e-17 | 114 |
| GO:000645712 | Liver | HCC | protein folding | 160/7958 | 212/18723 | 1.07e-22 | 1.88e-20 | 160 |
| GO:000645718 | Oral cavity | OSCC | protein folding | 154/7305 | 212/18723 | 1.89e-23 | 4.60e-21 | 154 |
| GO:000645719 | Oral cavity | LP | protein folding | 125/4623 | 212/18723 | 1.62e-26 | 8.45e-24 | 125 |
| GO:0006457111 | Skin | cSCC | protein folding | 131/4864 | 212/18723 | 2.96e-28 | 1.32e-25 | 131 |
| GO:0006457112 | Thyroid | PTC | protein folding | 137/5968 | 212/18723 | 8.29e-23 | 2.01e-20 | 137 |
| GO:000645733 | Thyroid | ATC | protein folding | 140/6293 | 212/18723 | 3.46e-22 | 8.09e-20 | 140 |
| Page: 1 |
| Pathway ID | Tissue | Disease Stage | Description | Gene Ratio | Bg Ratio | pvalue | p.adjust | qvalue | Count |
| Page: 1 |
Top |
Cell-cell communication analysis |
| Identification of potential cell-cell interactions between two cell types and their ligand-receptor pairs for different disease states |
| Ligand | Receptor | LRpair | Pathway | Tissue | Disease Stage |
| Page: 1 |
Top |
Single-cell gene regulatory network inference analysis |
| Find out the significant the regulons (TFs) and the target genes of each regulon across cell types for different disease states |
| TF | Cell Type | Tissue | Disease Stage | Target Gene | RSS | Regulon Activity |
| ∗The dot plots of a searched regulon are shown for all cell subpopulations in each disease state of each tissue based on the regulon specific score inferred using pySCENIC and by calculating the average expression. |
| Page: 1 |
Top |
Somatic mutation of malignant transformation related genes |
| Annotation of somatic variants for genes involved in malignant transformation |
| Hugo Symbol | Variant Class | Variant Classification | dbSNP RS | HGVSc | HGVSp | HGVSp Short | SWISSPROT | BIOTYPE | SIFT | PolyPhen | Tumor Sample Barcode | Tissue | Histology | Sex | Age | Stage | Therapy Types | Drugs | Outcome |
| PDRG1 | SNV | Missense_Mutation | c.310N>C | p.Glu104Gln | p.E104Q | Q9NUG6 | protein_coding | deleterious(0.01) | probably_damaging(0.976) | TCGA-AR-A1AI-01 | Breast | breast invasive carcinoma | Female | <65 | I/II | Chemotherapy | cytoxan | PD | |
| PDRG1 | SNV | Missense_Mutation | novel | c.100G>C | p.Asp34His | p.D34H | Q9NUG6 | protein_coding | deleterious(0.01) | probably_damaging(0.936) | TCGA-BH-A2L8-01 | Breast | breast invasive carcinoma | Female | <65 | I/II | Chemotherapy | cytoxan | CR |
| PDRG1 | SNV | Missense_Mutation | c.299N>G | p.Asn100Ser | p.N100S | Q9NUG6 | protein_coding | tolerated(0.25) | benign(0.01) | TCGA-D8-A1XK-01 | Breast | breast invasive carcinoma | Female | <65 | I/II | Chemotherapy | doxorubicine+cyclophosphamide | SD | |
| PDRG1 | SNV | Missense_Mutation | c.232N>C | p.Glu78Gln | p.E78Q | Q9NUG6 | protein_coding | tolerated(1) | benign(0.006) | TCGA-GM-A2DH-01 | Breast | breast invasive carcinoma | Female | <65 | I/II | Chemotherapy | taxol | CR | |
| PDRG1 | insertion | Frame_Shift_Ins | novel | c.246_247insGCTGATGGATCATCTTCTCTCCTAGGCAAACCGGAGCTGAAGG | p.His83AlafsTer18 | p.H83Afs*18 | Q9NUG6 | protein_coding | TCGA-A8-A06Q-01 | Breast | breast invasive carcinoma | Female | <65 | III/IV | Unknown | Unknown | SD | ||
| PDRG1 | SNV | Missense_Mutation | c.367N>A | p.Glu123Lys | p.E123K | Q9NUG6 | protein_coding | deleterious(0) | probably_damaging(0.946) | TCGA-EK-A3GK-01 | Cervix | cervical & endocervical cancer | Female | <65 | I/II | Unknown | Unknown | SD | |
| PDRG1 | SNV | Missense_Mutation | c.228N>T | p.Met76Ile | p.M76I | Q9NUG6 | protein_coding | tolerated(0.15) | benign(0.134) | TCGA-AA-3510-01 | Colorectum | colon adenocarcinoma | Male | >=65 | I/II | Unknown | Unknown | SD | |
| PDRG1 | SNV | Missense_Mutation | c.187A>G | p.Asn63Asp | p.N63D | Q9NUG6 | protein_coding | tolerated(0.15) | benign(0.006) | TCGA-AA-A010-01 | Colorectum | colon adenocarcinoma | Female | <65 | I/II | Chemotherapy | folinic | CR | |
| PDRG1 | SNV | Missense_Mutation | c.358A>G | p.Asn120Asp | p.N120D | Q9NUG6 | protein_coding | deleterious(0.01) | benign(0.006) | TCGA-CM-5861-01 | Colorectum | colon adenocarcinoma | Female | <65 | I/II | Unknown | Unknown | PD | |
| PDRG1 | SNV | Missense_Mutation | rs755286962 | c.32G>A | p.Arg11Gln | p.R11Q | Q9NUG6 | protein_coding | tolerated(0.72) | benign(0) | TCGA-F5-6814-01 | Colorectum | rectum adenocarcinoma | Male | <65 | I/II | Unknown | Unknown | SD |
| Page: 1 2 |
Top |
Related drugs of malignant transformation related genes |
| Identification of chemicals and drugs interact with genes involved in malignant transfromation |
| (DGIdb 4.0) |
| Entrez ID | Symbol | Category | Interaction Types | Drug Claim Name | Drug Name | PMIDs |
| Page: 1 |

Copyright 2023-Present -The University of Texas Health Science Center at Houston |