
|
|||||
|
 | |
| |
| |
| |
| |
| |
|
Gene: PDPN |
Gene summary for PDPN |
| Gene information | Species | Human | Gene symbol | PDPN | Gene ID | 10630 |
| Gene name | podoplanin | |
| Gene Alias | AGGRUS | |
| Cytomap | 1p36.21 | |
| Gene Type | protein-coding | GO ID | GO:0000902 | UniProtAcc | Q86YL7 |
Top |
Malignant transformation analysis |
| Identification of the aberrant gene expression in precancerous and cancerous lesions by comparing the gene expression of stem-like cells in diseased tissues with normal stem cells |
| Entrez ID | Symbol | Replicates | Species | Organ | Tissue | Adj P-value | Log2FC | Malignancy |
| 10630 | PDPN | LZE6T | Human | Esophagus | ESCC | 3.16e-06 | 3.45e-01 | 0.0845 |
| 10630 | PDPN | P2T-E | Human | Esophagus | ESCC | 4.40e-21 | 6.38e-01 | 0.1177 |
| 10630 | PDPN | P4T-E | Human | Esophagus | ESCC | 4.93e-05 | 9.30e-01 | 0.1323 |
| 10630 | PDPN | P5T-E | Human | Esophagus | ESCC | 2.38e-69 | 1.87e+00 | 0.1327 |
| 10630 | PDPN | P8T-E | Human | Esophagus | ESCC | 2.76e-07 | 3.79e-01 | 0.0889 |
| 10630 | PDPN | P9T-E | Human | Esophagus | ESCC | 9.68e-21 | 1.38e+00 | 0.1131 |
| 10630 | PDPN | P10T-E | Human | Esophagus | ESCC | 2.27e-100 | 3.29e+00 | 0.116 |
| 10630 | PDPN | P11T-E | Human | Esophagus | ESCC | 3.37e-29 | 2.09e+00 | 0.1426 |
| 10630 | PDPN | P12T-E | Human | Esophagus | ESCC | 7.94e-30 | 8.49e-01 | 0.1122 |
| 10630 | PDPN | P15T-E | Human | Esophagus | ESCC | 1.04e-19 | 1.14e+00 | 0.1149 |
| 10630 | PDPN | P16T-E | Human | Esophagus | ESCC | 8.78e-03 | -4.02e-02 | 0.1153 |
| 10630 | PDPN | P17T-E | Human | Esophagus | ESCC | 1.36e-09 | 1.12e+00 | 0.1278 |
| 10630 | PDPN | P19T-E | Human | Esophagus | ESCC | 1.60e-13 | 1.92e+00 | 0.1662 |
| 10630 | PDPN | P21T-E | Human | Esophagus | ESCC | 4.83e-40 | 1.16e+00 | 0.1617 |
| 10630 | PDPN | P22T-E | Human | Esophagus | ESCC | 5.67e-44 | 1.12e+00 | 0.1236 |
| 10630 | PDPN | P23T-E | Human | Esophagus | ESCC | 4.73e-02 | 6.86e-01 | 0.108 |
| 10630 | PDPN | P26T-E | Human | Esophagus | ESCC | 1.07e-09 | 2.27e-01 | 0.1276 |
| 10630 | PDPN | P27T-E | Human | Esophagus | ESCC | 5.79e-07 | 3.83e-01 | 0.1055 |
| 10630 | PDPN | P28T-E | Human | Esophagus | ESCC | 3.45e-09 | 5.16e-01 | 0.1149 |
| 10630 | PDPN | P30T-E | Human | Esophagus | ESCC | 6.82e-09 | 1.10e+00 | 0.137 |
| Page: 1 2 3 4 |
| Tissue | Expression Dynamics | Abbreviation |
| Esophagus | 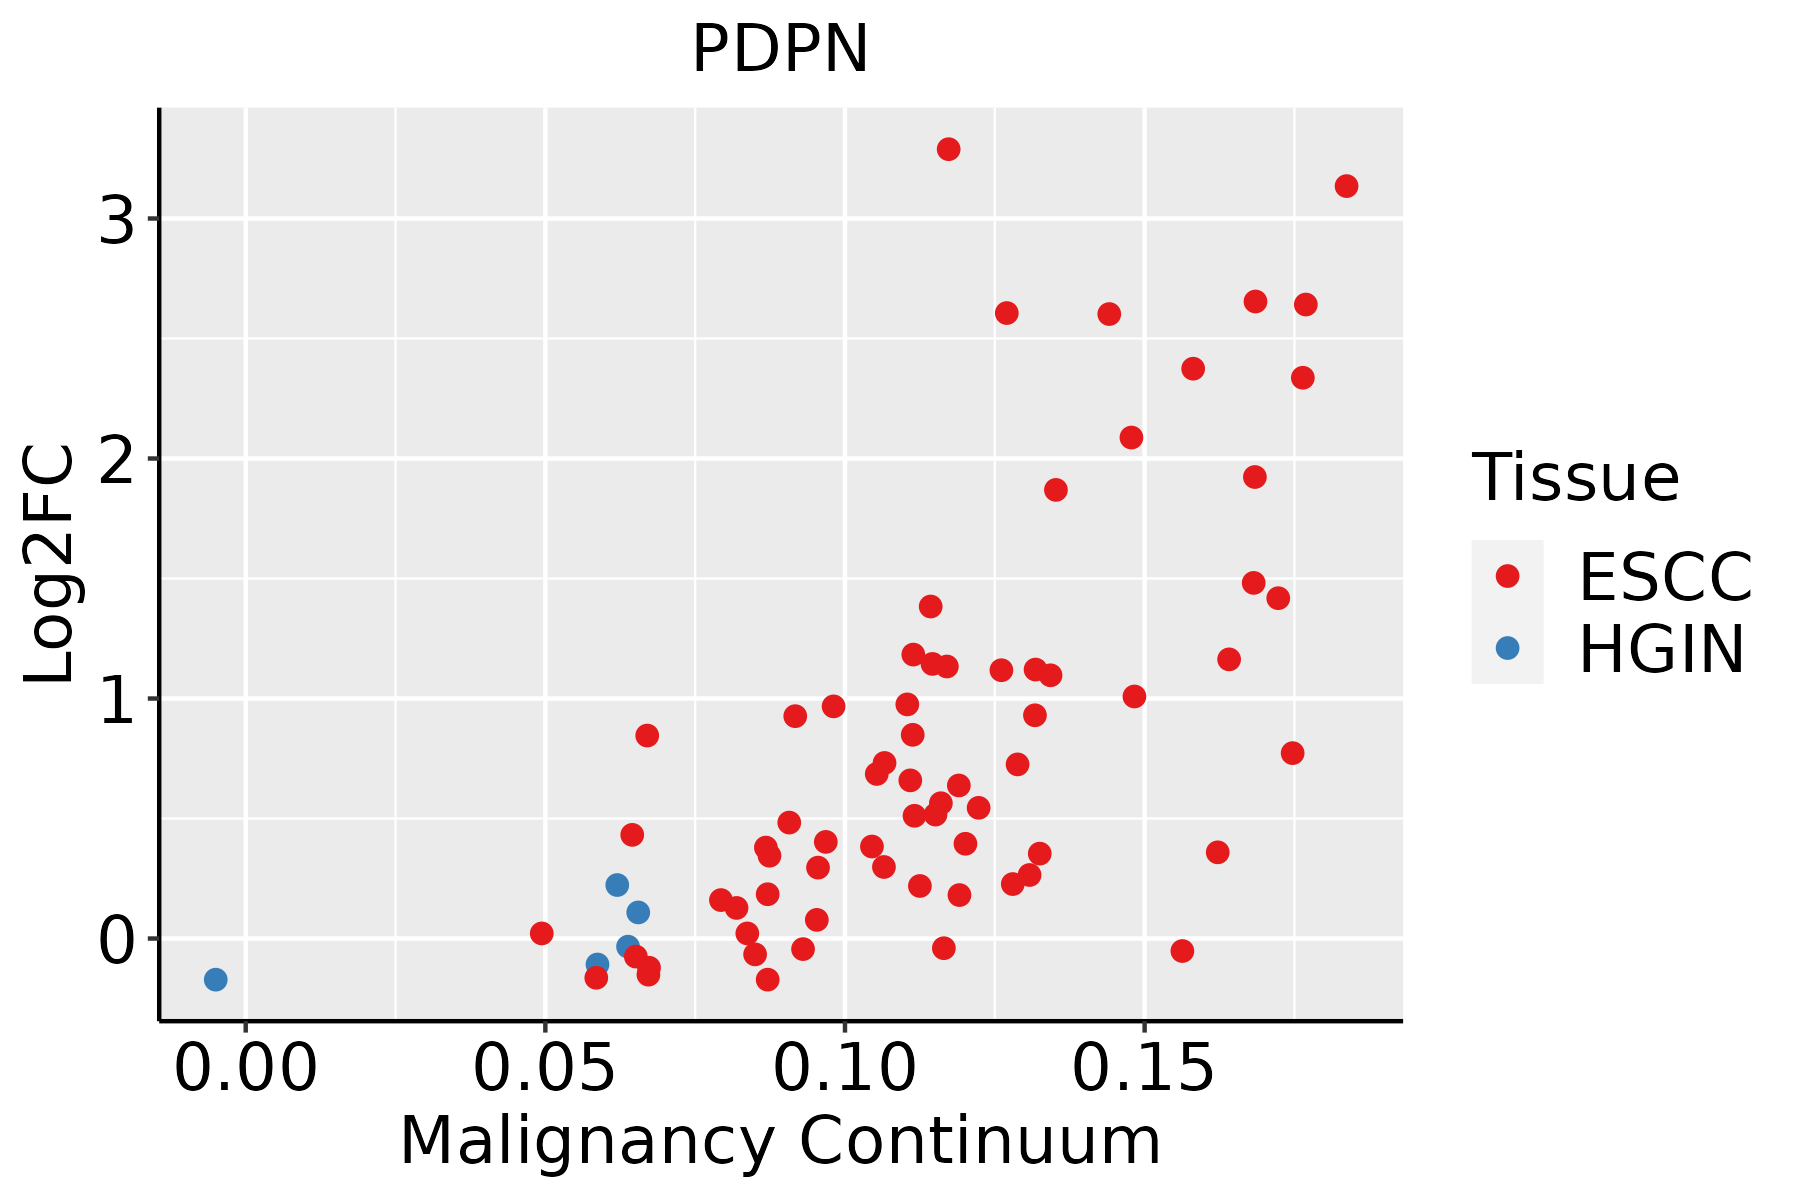 | ESCC: Esophageal squamous cell carcinoma |
| HGIN: High-grade intraepithelial neoplasias | ||
| LGIN: Low-grade intraepithelial neoplasias | ||
| Oral Cavity | 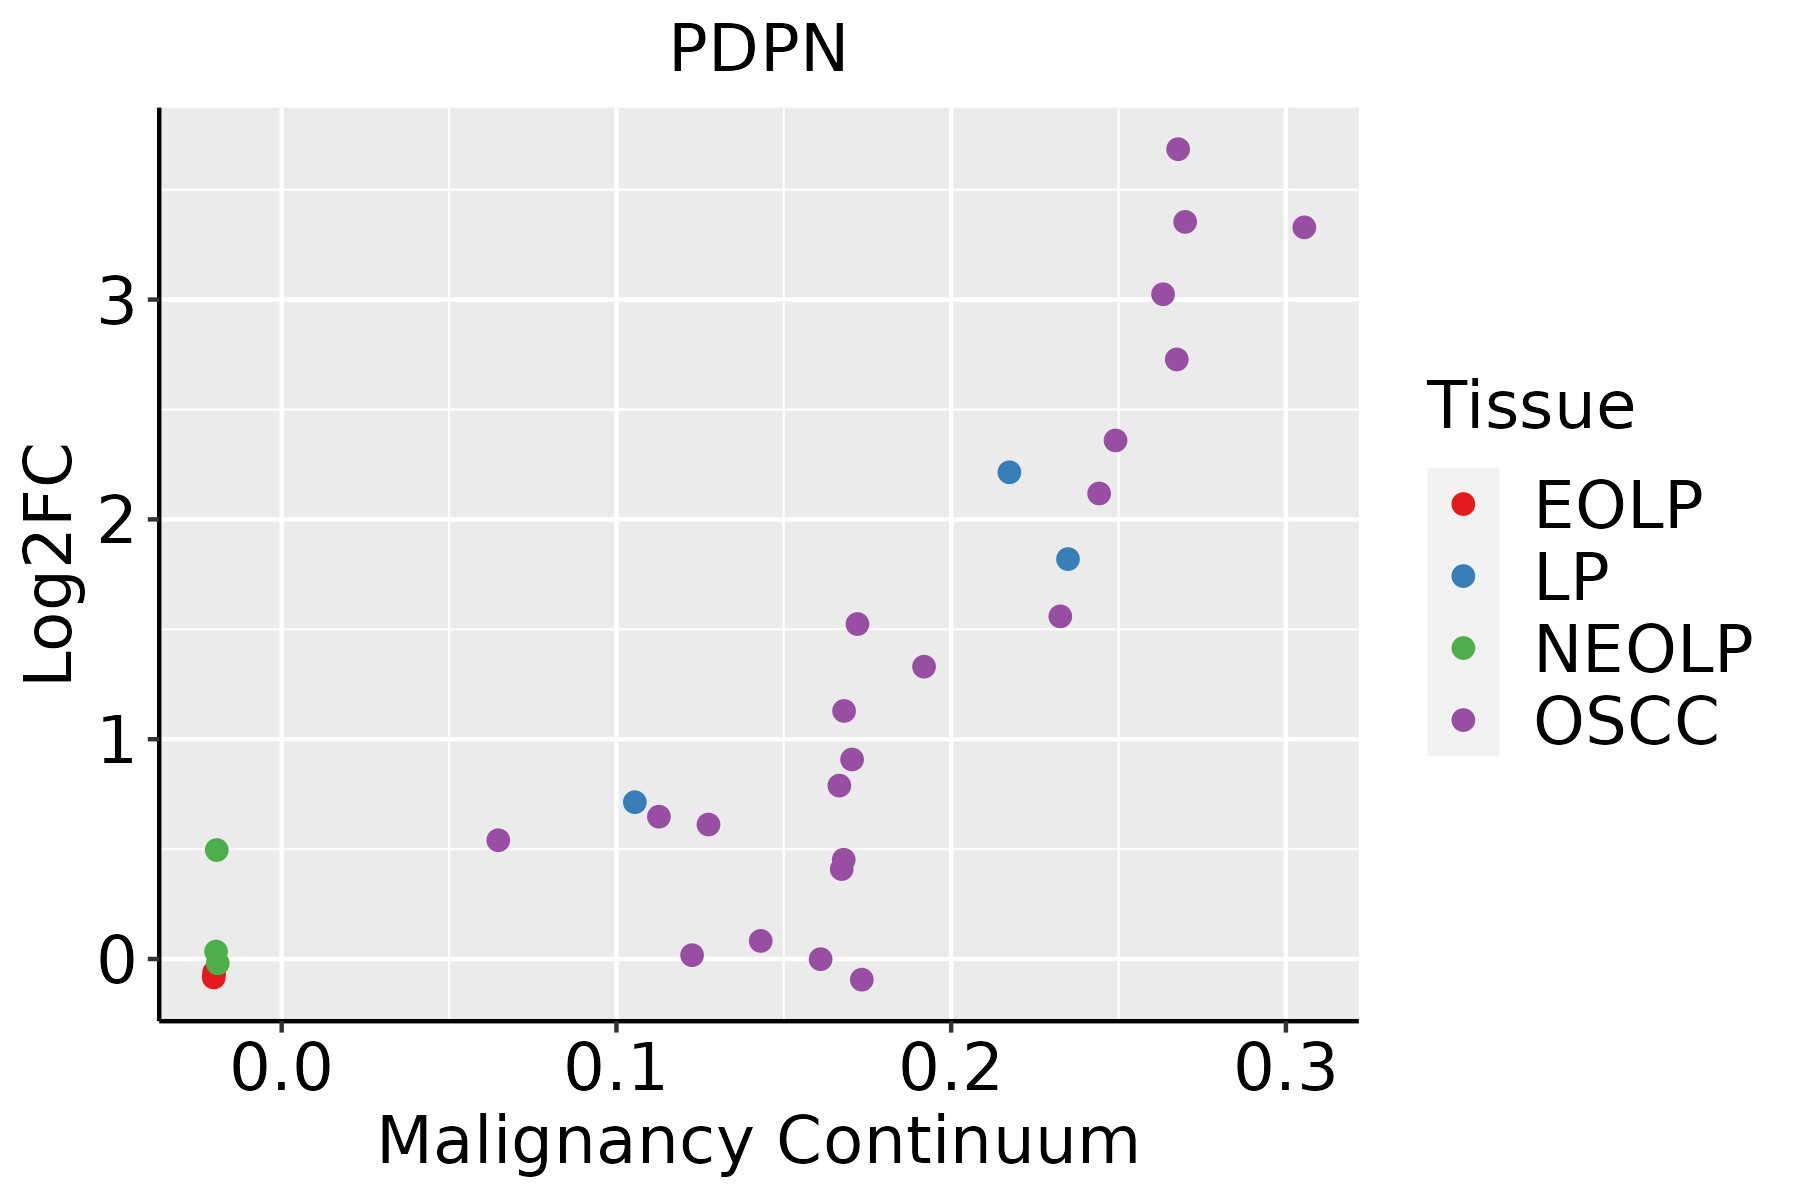 | EOLP: Erosive Oral lichen planus |
| LP: leukoplakia | ||
| NEOLP: Non-erosive oral lichen planus | ||
| OSCC: Oral squamous cell carcinoma | ||
| Prostate |  | BPH: Benign Prostatic Hyperplasia |
| Skin | 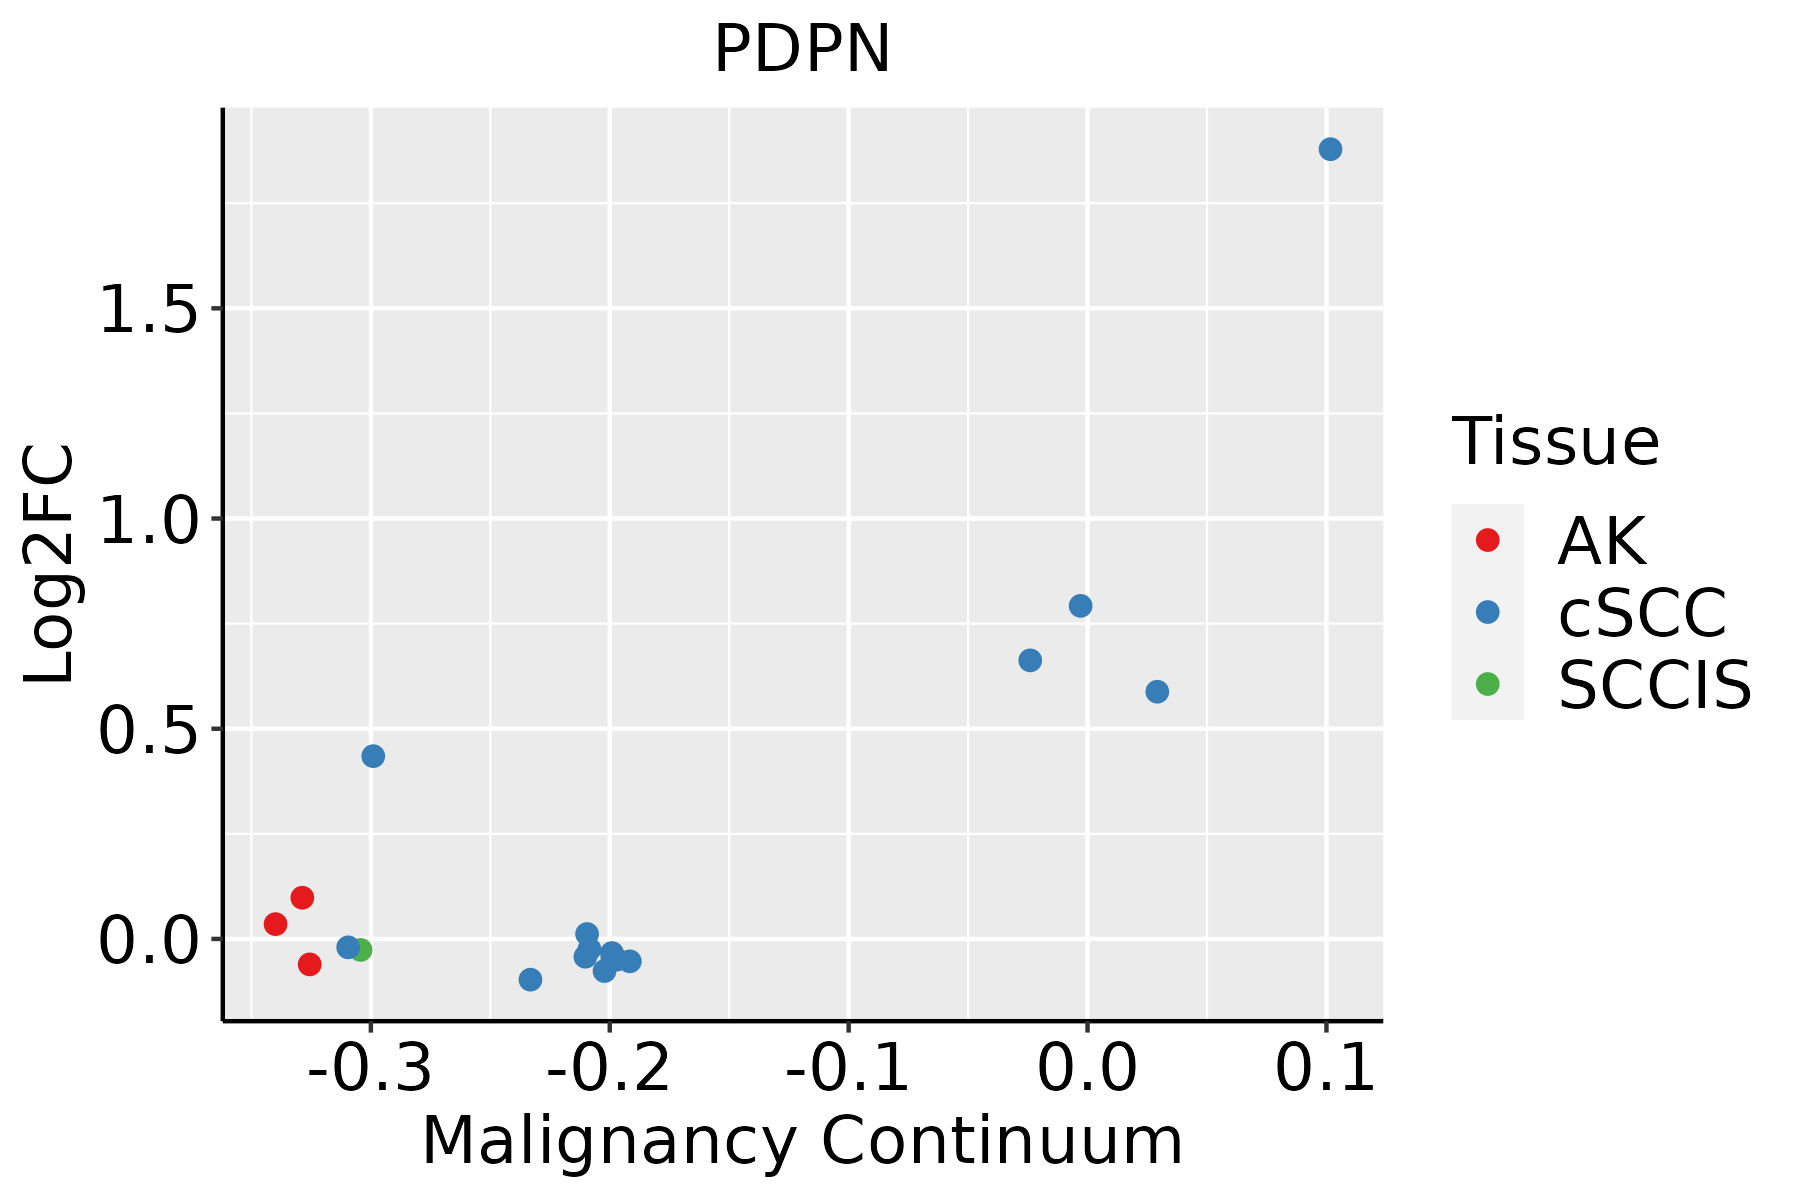 | AK: Actinic keratosis |
| cSCC: Cutaneous squamous cell carcinoma | ||
| SCCIS:squamous cell carcinoma in situ | ||
| Thyroid |  | ATC: Anaplastic thyroid cancer |
| HT: Hashimoto's thyroiditis | ||
| PTC: Papillary thyroid cancer |
| ∗log2FC in expression of this searched gene in stem-like cells from each diseased tissue sample relative to stem-like cells in normal samples in each tissue plotted against the malignancy continuum. Samples are colored based on if they are from different disease stage. |
Top |
Malignant transformation related pathway analysis |
| Find out the enriched GO biological processes and KEGG pathways involved in transition from healthy to precancer to cancer |
| Tissue | Disease Stage | Enriched GO biological Processes |
| Colorectum | AD |  |
| Colorectum | SER |  |
| Colorectum | MSS |  |
| Colorectum | MSI-H |  |
| Colorectum | FAP |  |
| ∗Top 15 enriched GO BP terms are showed in the bar plot of each disease state in each tissue. Each row represents a significant GO biological process which is colored according to the -log10(p.adjust). |
| Page: 1 2 3 4 5 6 7 8 9 |
| GO ID | Tissue | Disease Stage | Description | Gene Ratio | Bg Ratio | pvalue | p.adjust | Count |
| GO:0022411111 | Esophagus | ESCC | cellular component disassembly | 305/8552 | 443/18723 | 1.94e-23 | 4.57e-21 | 305 |
| GO:0070482111 | Esophagus | ESCC | response to oxygen levels | 218/8552 | 347/18723 | 6.91e-11 | 2.17e-09 | 218 |
| GO:003158919 | Esophagus | ESCC | cell-substrate adhesion | 221/8552 | 363/18723 | 3.06e-09 | 6.62e-08 | 221 |
| GO:001081020 | Esophagus | ESCC | regulation of cell-substrate adhesion | 144/8552 | 221/18723 | 3.55e-09 | 7.45e-08 | 144 |
| GO:004578527 | Esophagus | ESCC | positive regulation of cell adhesion | 255/8552 | 437/18723 | 5.07e-08 | 9.11e-07 | 255 |
| GO:000726510 | Esophagus | ESCC | Ras protein signal transduction | 201/8552 | 337/18723 | 1.44e-07 | 2.30e-06 | 201 |
| GO:0032970111 | Esophagus | ESCC | regulation of actin filament-based process | 231/8552 | 397/18723 | 2.91e-07 | 4.20e-06 | 231 |
| GO:004206027 | Esophagus | ESCC | wound healing | 243/8552 | 422/18723 | 4.62e-07 | 6.25e-06 | 243 |
| GO:00107184 | Esophagus | ESCC | positive regulation of epithelial to mesenchymal transition | 40/8552 | 52/18723 | 4.25e-06 | 4.56e-05 | 40 |
| GO:002260420 | Esophagus | ESCC | regulation of cell morphogenesis | 180/8552 | 309/18723 | 5.19e-06 | 5.45e-05 | 180 |
| GO:00303239 | Esophagus | ESCC | respiratory tube development | 112/8552 | 181/18723 | 7.82e-06 | 7.69e-05 | 112 |
| GO:00605417 | Esophagus | ESCC | respiratory system development | 123/8552 | 203/18723 | 1.26e-05 | 1.15e-04 | 123 |
| GO:00303249 | Esophagus | ESCC | lung development | 109/8552 | 177/18723 | 1.40e-05 | 1.27e-04 | 109 |
| GO:00020115 | Esophagus | ESCC | morphogenesis of an epithelial sheet | 42/8552 | 57/18723 | 1.62e-05 | 1.45e-04 | 42 |
| GO:00301984 | Esophagus | ESCC | extracellular matrix organization | 171/8552 | 301/18723 | 6.08e-05 | 4.67e-04 | 171 |
| GO:00430624 | Esophagus | ESCC | extracellular structure organization | 171/8552 | 302/18723 | 7.73e-05 | 5.76e-04 | 171 |
| GO:00452294 | Esophagus | ESCC | external encapsulating structure organization | 172/8552 | 304/18723 | 7.80e-05 | 5.80e-04 | 172 |
| GO:00018378 | Esophagus | ESCC | epithelial to mesenchymal transition | 95/8552 | 157/18723 | 1.25e-04 | 8.56e-04 | 95 |
| GO:00443197 | Esophagus | ESCC | wound healing, spreading of cells | 26/8552 | 34/18723 | 2.53e-04 | 1.55e-03 | 26 |
| GO:00905057 | Esophagus | ESCC | epiboly involved in wound healing | 26/8552 | 34/18723 | 2.53e-04 | 1.55e-03 | 26 |
| Page: 1 2 3 4 5 6 7 8 9 10 11 12 13 14 15 16 |
| Pathway ID | Tissue | Disease Stage | Description | Gene Ratio | Bg Ratio | pvalue | p.adjust | qvalue | Count |
| Page: 1 |
Top |
Cell-cell communication analysis |
| Identification of potential cell-cell interactions between two cell types and their ligand-receptor pairs for different disease states |
| Ligand | Receptor | LRpair | Pathway | Tissue | Disease Stage |
| Page: 1 |
Top |
Single-cell gene regulatory network inference analysis |
| Find out the significant the regulons (TFs) and the target genes of each regulon across cell types for different disease states |
| TF | Cell Type | Tissue | Disease Stage | Target Gene | RSS | Regulon Activity |
| ∗The dot plots of a searched regulon are shown for all cell subpopulations in each disease state of each tissue based on the regulon specific score inferred using pySCENIC and by calculating the average expression. |
| Page: 1 |
Top |
Somatic mutation of malignant transformation related genes |
| Annotation of somatic variants for genes involved in malignant transformation |
| Hugo Symbol | Variant Class | Variant Classification | dbSNP RS | HGVSc | HGVSp | HGVSp Short | SWISSPROT | BIOTYPE | SIFT | PolyPhen | Tumor Sample Barcode | Tissue | Histology | Sex | Age | Stage | Therapy Types | Drugs | Outcome |
| PDPN | deletion | Frame_Shift_Del | novel | c.640delG | p.Val214SerfsTer3 | p.V214Sfs*3 | Q86YL7 | protein_coding | TCGA-EW-A2FV-01 | Breast | breast invasive carcinoma | Female | <65 | III/IV | Chemotherapy | docetaxel | SD | ||
| PDPN | SNV | Missense_Mutation | c.16G>A | p.Gly6Arg | p.G6R | Q86YL7 | protein_coding | tolerated_low_confidence(0.07) | benign(0.013) | TCGA-3L-AA1B-01 | Colorectum | colon adenocarcinoma | Female | <65 | I/II | Unknown | Unknown | SD | |
| PDPN | SNV | Missense_Mutation | rs140760055 | c.263N>A | p.Gly88Glu | p.G88E | Q86YL7 | protein_coding | deleterious(0) | probably_damaging(1) | TCGA-AA-A01K-01 | Colorectum | colon adenocarcinoma | Female | >=65 | III/IV | Chemotherapy | folinic | CR |
| PDPN | SNV | Missense_Mutation | c.353N>T | p.Ala118Val | p.A118V | Q86YL7 | protein_coding | tolerated(1) | benign(0) | TCGA-G4-6588-01 | Colorectum | colon adenocarcinoma | Female | <65 | I/II | Unknown | Unknown | SD | |
| PDPN | SNV | Missense_Mutation | rs377220172 | c.676G>A | p.Val226Ile | p.V226I | Q86YL7 | protein_coding | tolerated(1) | benign(0) | TCGA-AG-4005-01 | Colorectum | rectum adenocarcinoma | Male | <65 | III/IV | Chemotherapy | folinic | CR |
| PDPN | deletion | Frame_Shift_Del | c.113delN | p.Pro40HisfsTer16 | p.P40Hfs*16 | Q86YL7 | protein_coding | TCGA-AD-A5EJ-01 | Colorectum | colon adenocarcinoma | Female | >=65 | I/II | Unknown | Unknown | SD | |||
| PDPN | SNV | Missense_Mutation | novel | c.327N>T | p.Glu109Asp | p.E109D | Q86YL7 | protein_coding | tolerated(0.53) | benign(0.114) | TCGA-A5-A0G2-01 | Endometrium | uterine corpus endometrioid carcinoma | Female | <65 | III/IV | Unknown | Unknown | SD |
| PDPN | SNV | Missense_Mutation | c.517N>T | p.Pro173Ser | p.P173S | Q86YL7 | protein_coding | tolerated(0.26) | benign(0.086) | TCGA-A5-A0G2-01 | Endometrium | uterine corpus endometrioid carcinoma | Female | <65 | III/IV | Unknown | Unknown | SD | |
| PDPN | SNV | Missense_Mutation | c.582N>T | p.Gln194His | p.Q194H | Q86YL7 | protein_coding | deleterious(0.03) | possibly_damaging(0.871) | TCGA-AJ-A3EL-01 | Endometrium | uterine corpus endometrioid carcinoma | Female | <65 | I/II | Unknown | Unknown | SD | |
| PDPN | SNV | Missense_Mutation | novel | c.434C>T | p.Ala145Val | p.A145V | Q86YL7 | protein_coding | tolerated(0.22) | benign(0.097) | TCGA-AJ-A3NE-01 | Endometrium | uterine corpus endometrioid carcinoma | Female | <65 | I/II | Unknown | Unknown | SD |
| Page: 1 2 3 4 |
Top |
Related drugs of malignant transformation related genes |
| Identification of chemicals and drugs interact with genes involved in malignant transfromation |
| (DGIdb 4.0) |
| Entrez ID | Symbol | Category | Interaction Types | Drug Claim Name | Drug Name | PMIDs |
| Page: 1 |

Copyright 2023-Present -The University of Texas Health Science Center at Houston |